

Key Insights
The global Power Supply in Package (PSIP) and Power Supply on Chip (PSoC) market is projected for substantial growth, driven by demand for miniaturization, enhanced efficiency, and integrated functionality. With a current market size of 3.06 billion, the sector is expected to expand at a Compound Annual Growth Rate (CAGR) of 7.86%. Key growth catalysts include the increasing complexity of consumer electronics like smartphones and wearables, requiring compact, integrated power solutions. The expansion of telecommunications, including 5G, and data centers fuels demand for high-performance PSIP and PSoC solutions. The automotive sector's electrification and adoption of advanced driver-assistance systems (ADAS) also contribute significantly, necessitating sophisticated, space-saving power management components.
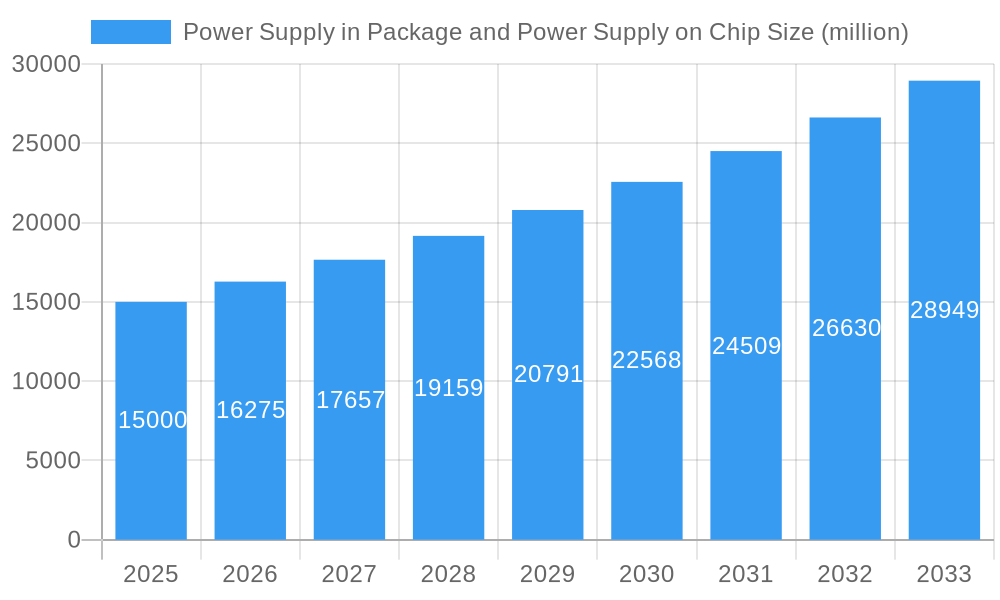
Power Supply in Package and Power Supply on Chip Market Size (In Billion)
Market expansion is further driven by continuous innovation in semiconductor manufacturing, enabling smaller and more powerful integrated circuits. The proliferation of IoT devices across smart homes and industrial automation spurs demand for low-power, integrated PSIP and PSoC solutions. Advancements in GaN and SiC power semiconductors are enhancing efficiency and reducing form factors. Challenges include high R&D costs and potential supply chain disruptions. However, the benefits of reduced system complexity, improved thermal performance, and enhanced reliability are expected to drive sustained market expansion. The Asia Pacific region, led by China and India, is anticipated to spearhead this growth due to its robust manufacturing base and expanding electronics industry.
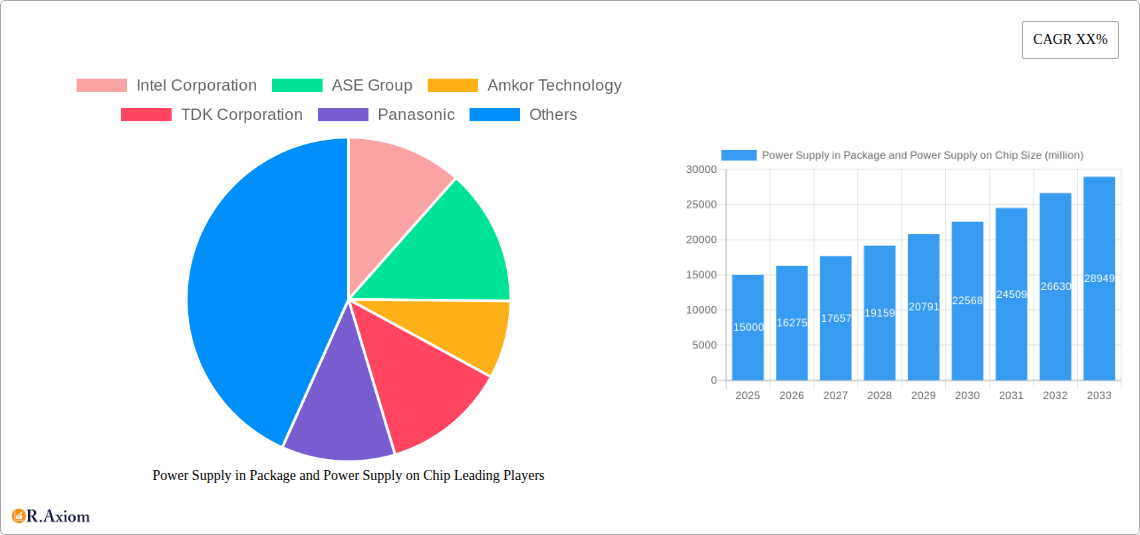
Power Supply in Package and Power Supply on Chip Company Market Share
This comprehensive market research report analyzes the global Power Supply in Package (PSiP) and Power Supply on Chip (PSoC) market. It provides critical insights into market dynamics, concentration, innovation, trends, dominant segments, product developments, growth drivers, challenges, and emerging opportunities. Based on a market size of 3.06 billion in the base year 2024, with a projected CAGR of 7.86%, the report offers a thorough outlook for the forecast period.
Power Supply in Package and Power Supply on Chip Market Concentration & Innovation
The global Power Supply in Package (PSiP) and Power Supply on Chip (PSoC) market exhibits a moderate to high concentration, with key players like Intel Corporation, ASE Group, Amkor Technology, TDK Corporation, and Texas Instruments Incorporated dominating a significant portion of the market share. Innovation is a primary driver, fueled by the relentless demand for miniaturization, higher power density, improved energy efficiency, and advanced thermal management solutions across diverse applications. Regulatory frameworks, particularly those pertaining to energy efficiency standards and hazardous materials, are increasingly influencing product design and market entry. Product substitutes, such as discrete power components, continue to exist but face growing pressure from the integrated solutions offered by PSiP and PSoC. End-user trends highlight a strong preference for compact, high-performance power management solutions, particularly within consumer electronics and telecommunications. Mergers and acquisitions (M&A) are anticipated to play a crucial role in market consolidation. For instance, recent M&A deals are estimated to involve transaction values in the hundreds of millions of dollars, reflecting the strategic importance of acquiring advanced power management technologies and market access. The market share of leading companies is projected to be between 10% and 20% individually, with the top five players collectively holding over 60% of the market by 2025.
Power Supply in Package and Power Supply on Chip Industry Trends & Insights
The Power Supply in Package (PSiP) and Power Supply on Chip (PSoC) industry is poised for substantial growth, driven by several interconnected trends. A Compound Annual Growth Rate (CAGR) of approximately 12% is projected from 2025 to 2033, reflecting the increasing adoption of these integrated power solutions. Technological disruptions, including advancements in Gallium Nitride (GaN) and Silicon Carbide (SiC) semiconductor materials, are enabling higher power densities and superior performance, thus expanding the application scope of PSiP and PSoC. Consumer preferences are shifting towards more portable, energy-efficient, and feature-rich electronic devices, creating a strong pull for compact and integrated power management systems. The expanding Internet of Things (IoT) ecosystem, with its myriad of connected devices, requires efficient and small-form-factor power solutions, further bolstering market demand. The automotive sector's electrification and the increasing sophistication of in-car electronics are major growth catalysts, necessitating advanced PSiP and PSoC for onboard power management, battery charging, and advanced driver-assistance systems (ADAS). In the telecommunications and IT sectors, the proliferation of 5G infrastructure and data centers demands highly efficient and scalable power delivery solutions. Market penetration for PSiP and PSoC in emerging applications is expected to grow by over 15% annually. The competitive dynamics are characterized by intense innovation, strategic partnerships, and a focus on cost-effective manufacturing processes. Companies are investing heavily in research and development to overcome challenges related to thermal management, integration complexity, and yield optimization. The estimated market size for PSiP and PSoC is expected to reach several tens of billions of dollars by the end of the forecast period, with an initial market size of approximately 20 million dollars in the base year of 2025.
Dominant Markets & Segments in Power Supply in Package and Power Supply on Chip
The Consumer Electronics segment is currently the dominant market for Power Supply in Package (PSiP) and Power Supply on Chip (PSoC), driven by the insatiable demand for smartphones, laptops, wearables, and smart home devices. Key drivers include the increasing disposable income globally, the rapid pace of technological obsolescence, and the growing consumer appetite for portable and feature-rich electronics. Within this segment, the Power Supply in Package type holds a larger market share due to its flexibility in integrating multiple power components and its suitability for higher power applications found in consumer devices.
The Telecom & IT segment is another significant contributor, with strong growth fueled by the expansion of 5G networks, cloud computing infrastructure, and the increasing power demands of data centers. Economic policies promoting digital transformation and infrastructure development are key drivers.
The Automotive segment is emerging as a high-growth area. The relentless push towards electric vehicles (EVs) and the increasing complexity of automotive electronics, including infotainment systems and ADAS, are creating substantial opportunities for advanced PSiP and PSoC solutions. Government incentives for EV adoption and stringent safety regulations are major influencing factors.
The Medical Devices sector, while smaller in volume, presents lucrative opportunities due to the stringent reliability and miniaturization requirements for medical equipment, including portable diagnostic devices and implantable sensors. Regulatory approval processes are a critical aspect of this segment.
The Military & Defense segment, characterized by its demand for ruggedized, high-reliability, and high-performance power solutions, also contributes to market growth, particularly for applications in defense electronics and communication systems.
Geographically, Asia Pacific is the dominant region, driven by its robust manufacturing capabilities, substantial consumer base, and the presence of leading semiconductor manufacturers. Countries like China, South Korea, and Taiwan are at the forefront of PSiP and PSoC production and consumption.
Power Supply in Package and Power Supply on Chip Product Developments
Recent product developments in the Power Supply in Package (PSiP) and Power Supply on Chip (PSoC) market are centered on achieving higher power density, improved thermal performance, and enhanced energy efficiency. Innovations in advanced packaging technologies and the integration of new semiconductor materials like GaN are enabling smaller form factors and higher operating frequencies. These advancements are crucial for meeting the stringent requirements of next-generation consumer electronics, high-performance computing, and automotive applications, providing designers with greater flexibility and improved system performance.
Report Scope & Segmentation Analysis
This report comprehensively segments the Power Supply in Package (PSiP) and Power Supply on Chip (PSoC) market across various Application and Type categories.
Application Segments:
- Consumer Electronics: Expected to maintain its leading position with projected market sizes in the tens of billions of dollars, driven by rapid product cycles and miniaturization trends.
- Telecom & IT: A robust growth segment with significant market expansion anticipated due to 5G rollout and data center expansion, with market sizes in the single-digit billions of dollars.
- Automotive: The fastest-growing segment, fueled by EV adoption and advanced vehicle electronics, with market sizes projected to reach several billions of dollars by 2033.
- Medical Devices: A niche but high-value segment, characterized by stringent quality and reliability demands, with market sizes in the hundreds of millions of dollars.
- Military & Defense: A stable market with consistent demand for high-performance and ruggedized solutions, with market sizes in the hundreds of millions of dollars.
- Other: Encompasses emerging applications and niche markets, contributing a smaller but growing portion of the overall market.
Type Segments:
- Power Supply in Package (PSiP): Expected to hold a larger market share due to its versatility in integrating multiple power functions.
- Power Supply on Chip (PSoC): Growing in importance for highly integrated systems demanding extreme miniaturization.
Key Drivers of Power Supply in Package and Power Supply on Chip Growth
The growth of the Power Supply in Package (PSiP) and Power Supply on Chip (PSoC) market is propelled by several key factors:
- Miniaturization and Power Density: The relentless demand for smaller, lighter, and more powerful electronic devices across all sectors.
- Energy Efficiency: Increasing regulatory mandates and consumer demand for energy-saving solutions to reduce operational costs and environmental impact.
- Advancements in Semiconductor Technology: Innovations in materials (e.g., GaN, SiC) and packaging techniques enable higher performance and integration.
- Growth of IoT and 5G: The proliferation of connected devices and the infrastructure supporting 5G require efficient and compact power management.
- Electrification of Vehicles: The surge in EV production and the increasing electronic content in traditional vehicles necessitate sophisticated power solutions.
Challenges in the Power Supply in Package and Power Supply on Chip Sector
Despite robust growth prospects, the PSiP and PSoC sector faces several challenges:
- Thermal Management: Integrating multiple power components in a small package generates significant heat, requiring advanced thermal dissipation solutions.
- Integration Complexity and Yield: Achieving high yields in complex manufacturing processes for highly integrated power solutions remains a challenge, impacting cost-effectiveness.
- Supply Chain Disruptions: Geopolitical factors and the reliance on global supply chains for critical raw materials and components can lead to production delays and increased costs, with potential impacts of tens of millions of dollars on project timelines.
- High Development Costs: Research and development for advanced PSiP and PSoC technologies require significant capital investment.
Emerging Opportunities in Power Supply in Package and Power Supply on Chip
The Power Supply in Package (PSiP) and Power Supply on Chip (PSoC) market is ripe with emerging opportunities:
- High-Frequency Power Conversion: Development of PSiP and PSoC capable of operating at higher frequencies for improved efficiency and reduced component size.
- Smart Power Management: Integration of intelligent features for dynamic power allocation, predictive maintenance, and enhanced system control.
- Renewable Energy Integration: Solutions for microgrids, solar inverters, and energy storage systems requiring compact and efficient power conversion.
- Advanced Medical Implants: Highly miniaturized and reliable PSiP and PSoC for implantable medical devices requiring minimal power consumption.
Leading Players in the Power Supply in Package and Power Supply on Chip Market
- Intel Corporation
- ASE Group
- Amkor Technology
- TDK Corporation
- Panasonic
- Bel Fuse Inc.
- Jiangsu Changjiang Electronics Technology
- Texas Instruments Incorporated
- ON Semiconductor
- Vicor Corporation
Key Developments in Power Supply in Package and Power Supply on Chip Industry
- 2023: Launch of advanced GaN-based PSiP modules by multiple vendors, enabling higher power density for consumer electronics.
- 2023: Increased M&A activity targeting companies with expertise in advanced packaging for power semiconductors.
- 2024: Introduction of novel thermal management solutions for high-power density PSoC, improving reliability.
- 2024: Significant investments in R&D for SiC-based PSiP for electric vehicle applications.
- 2025: Expected release of next-generation PSoC with integrated digital control features for improved system efficiency.
Strategic Outlook for Power Supply in Package and Power Supply on Chip Market
The strategic outlook for the Power Supply in Package (PSiP) and Power Supply on Chip (PSoC) market is exceptionally positive, driven by ongoing technological advancements and the expanding applications landscape. Continued innovation in materials, packaging, and integration will be crucial for companies to maintain a competitive edge. Strategic partnerships and collaborations will likely intensify, enabling faster product development cycles and broader market reach. The increasing demand for sustainable and energy-efficient power solutions will further fuel growth, particularly in sectors like automotive and consumer electronics. Companies that can effectively address thermal management challenges and optimize manufacturing costs will be well-positioned to capitalize on the substantial market opportunities projected in the coming years, with an estimated market expansion of over 80% by 2033.
Power Supply in Package and Power Supply on Chip Segmentation
-
1. Application
- 1.1. Consumer Electronics
- 1.2. Telecom & IT
- 1.3. Automotive
- 1.4. Medical Devices
- 1.5. Military & Defense
- 1.6. Other
-
2. Types
- 2.1. Power Supply in Package
- 2.2. Power Supply on Chip
Power Supply in Package and Power Supply on Chip Segmentation By Geography
-
1. North America
- 1.1. United States
- 1.2. Canada
- 1.3. Mexico
-
2. South America
- 2.1. Brazil
- 2.2. Argentina
- 2.3. Rest of South America
-
3. Europe
- 3.1. United Kingdom
- 3.2. Germany
- 3.3. France
- 3.4. Italy
- 3.5. Spain
- 3.6. Russia
- 3.7. Benelux
- 3.8. Nordics
- 3.9. Rest of Europe
-
4. Middle East & Africa
- 4.1. Turkey
- 4.2. Israel
- 4.3. GCC
- 4.4. North Africa
- 4.5. South Africa
- 4.6. Rest of Middle East & Africa
-
5. Asia Pacific
- 5.1. China
- 5.2. India
- 5.3. Japan
- 5.4. South Korea
- 5.5. ASEAN
- 5.6. Oceania
- 5.7. Rest of Asia Pacific
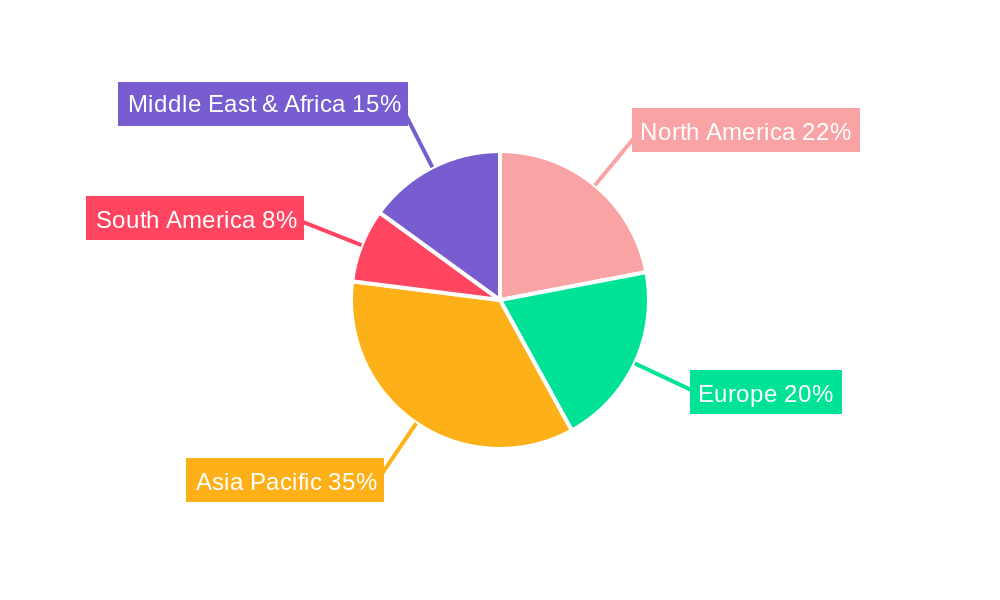
Power Supply in Package and Power Supply on Chip Regional Market Share
Geographic Coverage of Power Supply in Package and Power Supply on Chip
Power Supply in Package and Power Supply on Chip REPORT HIGHLIGHTS
| Aspects | Details |
|---|---|
| Study Period | 2020-2034 |
| Base Year | 2025 |
| Estimated Year | 2026 |
| Forecast Period | 2026-2034 |
| Historical Period | 2020-2025 |
| Growth Rate | CAGR of 7.86% from 2020-2034 |
| Segmentation |
|
Table of Contents
- 1. Introduction
- 1.1. Research Scope
- 1.2. Market Segmentation
- 1.3. Research Objective
- 1.4. Definitions and Assumptions
- 2. Executive Summary
- 2.1. Market Snapshot
- 3. Market Dynamics
- 3.1. Market Drivers
- 3.2. Market Restrains
- 3.3. Market Trends
- 3.4. Market Opportunities
- 4. Market Factor Analysis
- 4.1. Porters Five Forces
- 4.1.1. Bargaining Power of Suppliers
- 4.1.2. Bargaining Power of Buyers
- 4.1.3. Threat of New Entrants
- 4.1.4. Threat of Substitutes
- 4.1.5. Competitive Rivalry
- 4.2. PESTEL analysis
- 4.3. BCG Analysis
- 4.3.1. Stars (High Growth, High Market Share)
- 4.3.2. Cash Cows (Low Growth, High Market Share)
- 4.3.3. Question Mark (High Growth, Low Market Share)
- 4.3.4. Dogs (Low Growth, Low Market Share)
- 4.4. Ansoff Matrix Analysis
- 4.5. Supply Chain Analysis
- 4.6. Regulatory Landscape
- 4.7. Current Market Potential and Opportunity Assessment (TAM–SAM–SOM Framework)
- 4.8. RAX Analyst Note
- 4.1. Porters Five Forces
- 5. Market Analysis, Insights and Forecast 2021-2033
- 5.1. Market Analysis, Insights and Forecast - by Application
- 5.1.1. Consumer Electronics
- 5.1.2. Telecom & IT
- 5.1.3. Automotive
- 5.1.4. Medical Devices
- 5.1.5. Military & Defense
- 5.1.6. Other
- 5.2. Market Analysis, Insights and Forecast - by Types
- 5.2.1. Power Supply in Package
- 5.2.2. Power Supply on Chip
- 5.3. Market Analysis, Insights and Forecast - by Region
- 5.3.1. North America
- 5.3.2. South America
- 5.3.3. Europe
- 5.3.4. Middle East & Africa
- 5.3.5. Asia Pacific
- 5.1. Market Analysis, Insights and Forecast - by Application
- 6. Global Power Supply in Package and Power Supply on Chip Analysis, Insights and Forecast, 2021-2033
- 6.1. Market Analysis, Insights and Forecast - by Application
- 6.1.1. Consumer Electronics
- 6.1.2. Telecom & IT
- 6.1.3. Automotive
- 6.1.4. Medical Devices
- 6.1.5. Military & Defense
- 6.1.6. Other
- 6.2. Market Analysis, Insights and Forecast - by Types
- 6.2.1. Power Supply in Package
- 6.2.2. Power Supply on Chip
- 6.1. Market Analysis, Insights and Forecast - by Application
- 7. North America Power Supply in Package and Power Supply on Chip Analysis, Insights and Forecast, 2020-2032
- 7.1. Market Analysis, Insights and Forecast - by Application
- 7.1.1. Consumer Electronics
- 7.1.2. Telecom & IT
- 7.1.3. Automotive
- 7.1.4. Medical Devices
- 7.1.5. Military & Defense
- 7.1.6. Other
- 7.2. Market Analysis, Insights and Forecast - by Types
- 7.2.1. Power Supply in Package
- 7.2.2. Power Supply on Chip
- 7.1. Market Analysis, Insights and Forecast - by Application
- 8. South America Power Supply in Package and Power Supply on Chip Analysis, Insights and Forecast, 2020-2032
- 8.1. Market Analysis, Insights and Forecast - by Application
- 8.1.1. Consumer Electronics
- 8.1.2. Telecom & IT
- 8.1.3. Automotive
- 8.1.4. Medical Devices
- 8.1.5. Military & Defense
- 8.1.6. Other
- 8.2. Market Analysis, Insights and Forecast - by Types
- 8.2.1. Power Supply in Package
- 8.2.2. Power Supply on Chip
- 8.1. Market Analysis, Insights and Forecast - by Application
- 9. Europe Power Supply in Package and Power Supply on Chip Analysis, Insights and Forecast, 2020-2032
- 9.1. Market Analysis, Insights and Forecast - by Application
- 9.1.1. Consumer Electronics
- 9.1.2. Telecom & IT
- 9.1.3. Automotive
- 9.1.4. Medical Devices
- 9.1.5. Military & Defense
- 9.1.6. Other
- 9.2. Market Analysis, Insights and Forecast - by Types
- 9.2.1. Power Supply in Package
- 9.2.2. Power Supply on Chip
- 9.1. Market Analysis, Insights and Forecast - by Application
- 10. Middle East & Africa Power Supply in Package and Power Supply on Chip Analysis, Insights and Forecast, 2020-2032
- 10.1. Market Analysis, Insights and Forecast - by Application
- 10.1.1. Consumer Electronics
- 10.1.2. Telecom & IT
- 10.1.3. Automotive
- 10.1.4. Medical Devices
- 10.1.5. Military & Defense
- 10.1.6. Other
- 10.2. Market Analysis, Insights and Forecast - by Types
- 10.2.1. Power Supply in Package
- 10.2.2. Power Supply on Chip
- 10.1. Market Analysis, Insights and Forecast - by Application
- 11. Asia Pacific Power Supply in Package and Power Supply on Chip Analysis, Insights and Forecast, 2020-2032
- 11.1. Market Analysis, Insights and Forecast - by Application
- 11.1.1. Consumer Electronics
- 11.1.2. Telecom & IT
- 11.1.3. Automotive
- 11.1.4. Medical Devices
- 11.1.5. Military & Defense
- 11.1.6. Other
- 11.2. Market Analysis, Insights and Forecast - by Types
- 11.2.1. Power Supply in Package
- 11.2.2. Power Supply on Chip
- 11.1. Market Analysis, Insights and Forecast - by Application
- 12. Competitive Analysis
- 12.1. Company Profiles
- 12.1.1 Intel Corporation
- 12.1.1.1. Company Overview
- 12.1.1.2. Products
- 12.1.1.3. Company Financials
- 12.1.1.4. SWOT Analysis
- 12.1.2 ASE Group
- 12.1.2.1. Company Overview
- 12.1.2.2. Products
- 12.1.2.3. Company Financials
- 12.1.2.4. SWOT Analysis
- 12.1.3 Amkor Technology
- 12.1.3.1. Company Overview
- 12.1.3.2. Products
- 12.1.3.3. Company Financials
- 12.1.3.4. SWOT Analysis
- 12.1.4 TDK Corporation
- 12.1.4.1. Company Overview
- 12.1.4.2. Products
- 12.1.4.3. Company Financials
- 12.1.4.4. SWOT Analysis
- 12.1.5 Panasonic
- 12.1.5.1. Company Overview
- 12.1.5.2. Products
- 12.1.5.3. Company Financials
- 12.1.5.4. SWOT Analysis
- 12.1.6 Bel Fuse Inc.
- 12.1.6.1. Company Overview
- 12.1.6.2. Products
- 12.1.6.3. Company Financials
- 12.1.6.4. SWOT Analysis
- 12.1.7 Jiangsu Changjiang Electronics Technology
- 12.1.7.1. Company Overview
- 12.1.7.2. Products
- 12.1.7.3. Company Financials
- 12.1.7.4. SWOT Analysis
- 12.1.8 Texas Instruments Incorporated
- 12.1.8.1. Company Overview
- 12.1.8.2. Products
- 12.1.8.3. Company Financials
- 12.1.8.4. SWOT Analysis
- 12.1.9 ON Semiconductor
- 12.1.9.1. Company Overview
- 12.1.9.2. Products
- 12.1.9.3. Company Financials
- 12.1.9.4. SWOT Analysis
- 12.1.10 Vicor Corporation
- 12.1.10.1. Company Overview
- 12.1.10.2. Products
- 12.1.10.3. Company Financials
- 12.1.10.4. SWOT Analysis
- 12.1.1 Intel Corporation
- 12.2. Market Entropy
- 12.2.1 Company's Key Areas Served
- 12.2.2 Recent Developments
- 12.3. Company Market Share Analysis 2025
- 12.3.1 Top 5 Companies Market Share Analysis
- 12.3.2 Top 3 Companies Market Share Analysis
- 12.4. List of Potential Customers
- 13. Research Methodology
List of Figures
- Figure 1: Global Power Supply in Package and Power Supply on Chip Revenue Breakdown (billion, %) by Region 2025 & 2033
- Figure 2: Global Power Supply in Package and Power Supply on Chip Volume Breakdown (K, %) by Region 2025 & 2033
- Figure 3: North America Power Supply in Package and Power Supply on Chip Revenue (billion), by Application 2025 & 2033
- Figure 4: North America Power Supply in Package and Power Supply on Chip Volume (K), by Application 2025 & 2033
- Figure 5: North America Power Supply in Package and Power Supply on Chip Revenue Share (%), by Application 2025 & 2033
- Figure 6: North America Power Supply in Package and Power Supply on Chip Volume Share (%), by Application 2025 & 2033
- Figure 7: North America Power Supply in Package and Power Supply on Chip Revenue (billion), by Types 2025 & 2033
- Figure 8: North America Power Supply in Package and Power Supply on Chip Volume (K), by Types 2025 & 2033
- Figure 9: North America Power Supply in Package and Power Supply on Chip Revenue Share (%), by Types 2025 & 2033
- Figure 10: North America Power Supply in Package and Power Supply on Chip Volume Share (%), by Types 2025 & 2033
- Figure 11: North America Power Supply in Package and Power Supply on Chip Revenue (billion), by Country 2025 & 2033
- Figure 12: North America Power Supply in Package and Power Supply on Chip Volume (K), by Country 2025 & 2033
- Figure 13: North America Power Supply in Package and Power Supply on Chip Revenue Share (%), by Country 2025 & 2033
- Figure 14: North America Power Supply in Package and Power Supply on Chip Volume Share (%), by Country 2025 & 2033
- Figure 15: South America Power Supply in Package and Power Supply on Chip Revenue (billion), by Application 2025 & 2033
- Figure 16: South America Power Supply in Package and Power Supply on Chip Volume (K), by Application 2025 & 2033
- Figure 17: South America Power Supply in Package and Power Supply on Chip Revenue Share (%), by Application 2025 & 2033
- Figure 18: South America Power Supply in Package and Power Supply on Chip Volume Share (%), by Application 2025 & 2033
- Figure 19: South America Power Supply in Package and Power Supply on Chip Revenue (billion), by Types 2025 & 2033
- Figure 20: South America Power Supply in Package and Power Supply on Chip Volume (K), by Types 2025 & 2033
- Figure 21: South America Power Supply in Package and Power Supply on Chip Revenue Share (%), by Types 2025 & 2033
- Figure 22: South America Power Supply in Package and Power Supply on Chip Volume Share (%), by Types 2025 & 2033
- Figure 23: South America Power Supply in Package and Power Supply on Chip Revenue (billion), by Country 2025 & 2033
- Figure 24: South America Power Supply in Package and Power Supply on Chip Volume (K), by Country 2025 & 2033
- Figure 25: South America Power Supply in Package and Power Supply on Chip Revenue Share (%), by Country 2025 & 2033
- Figure 26: South America Power Supply in Package and Power Supply on Chip Volume Share (%), by Country 2025 & 2033
- Figure 27: Europe Power Supply in Package and Power Supply on Chip Revenue (billion), by Application 2025 & 2033
- Figure 28: Europe Power Supply in Package and Power Supply on Chip Volume (K), by Application 2025 & 2033
- Figure 29: Europe Power Supply in Package and Power Supply on Chip Revenue Share (%), by Application 2025 & 2033
- Figure 30: Europe Power Supply in Package and Power Supply on Chip Volume Share (%), by Application 2025 & 2033
- Figure 31: Europe Power Supply in Package and Power Supply on Chip Revenue (billion), by Types 2025 & 2033
- Figure 32: Europe Power Supply in Package and Power Supply on Chip Volume (K), by Types 2025 & 2033
- Figure 33: Europe Power Supply in Package and Power Supply on Chip Revenue Share (%), by Types 2025 & 2033
- Figure 34: Europe Power Supply in Package and Power Supply on Chip Volume Share (%), by Types 2025 & 2033
- Figure 35: Europe Power Supply in Package and Power Supply on Chip Revenue (billion), by Country 2025 & 2033
- Figure 36: Europe Power Supply in Package and Power Supply on Chip Volume (K), by Country 2025 & 2033
- Figure 37: Europe Power Supply in Package and Power Supply on Chip Revenue Share (%), by Country 2025 & 2033
- Figure 38: Europe Power Supply in Package and Power Supply on Chip Volume Share (%), by Country 2025 & 2033
- Figure 39: Middle East & Africa Power Supply in Package and Power Supply on Chip Revenue (billion), by Application 2025 & 2033
- Figure 40: Middle East & Africa Power Supply in Package and Power Supply on Chip Volume (K), by Application 2025 & 2033
- Figure 41: Middle East & Africa Power Supply in Package and Power Supply on Chip Revenue Share (%), by Application 2025 & 2033
- Figure 42: Middle East & Africa Power Supply in Package and Power Supply on Chip Volume Share (%), by Application 2025 & 2033
- Figure 43: Middle East & Africa Power Supply in Package and Power Supply on Chip Revenue (billion), by Types 2025 & 2033
- Figure 44: Middle East & Africa Power Supply in Package and Power Supply on Chip Volume (K), by Types 2025 & 2033
- Figure 45: Middle East & Africa Power Supply in Package and Power Supply on Chip Revenue Share (%), by Types 2025 & 2033
- Figure 46: Middle East & Africa Power Supply in Package and Power Supply on Chip Volume Share (%), by Types 2025 & 2033
- Figure 47: Middle East & Africa Power Supply in Package and Power Supply on Chip Revenue (billion), by Country 2025 & 2033
- Figure 48: Middle East & Africa Power Supply in Package and Power Supply on Chip Volume (K), by Country 2025 & 2033
- Figure 49: Middle East & Africa Power Supply in Package and Power Supply on Chip Revenue Share (%), by Country 2025 & 2033
- Figure 50: Middle East & Africa Power Supply in Package and Power Supply on Chip Volume Share (%), by Country 2025 & 2033
- Figure 51: Asia Pacific Power Supply in Package and Power Supply on Chip Revenue (billion), by Application 2025 & 2033
- Figure 52: Asia Pacific Power Supply in Package and Power Supply on Chip Volume (K), by Application 2025 & 2033
- Figure 53: Asia Pacific Power Supply in Package and Power Supply on Chip Revenue Share (%), by Application 2025 & 2033
- Figure 54: Asia Pacific Power Supply in Package and Power Supply on Chip Volume Share (%), by Application 2025 & 2033
- Figure 55: Asia Pacific Power Supply in Package and Power Supply on Chip Revenue (billion), by Types 2025 & 2033
- Figure 56: Asia Pacific Power Supply in Package and Power Supply on Chip Volume (K), by Types 2025 & 2033
- Figure 57: Asia Pacific Power Supply in Package and Power Supply on Chip Revenue Share (%), by Types 2025 & 2033
- Figure 58: Asia Pacific Power Supply in Package and Power Supply on Chip Volume Share (%), by Types 2025 & 2033
- Figure 59: Asia Pacific Power Supply in Package and Power Supply on Chip Revenue (billion), by Country 2025 & 2033
- Figure 60: Asia Pacific Power Supply in Package and Power Supply on Chip Volume (K), by Country 2025 & 2033
- Figure 61: Asia Pacific Power Supply in Package and Power Supply on Chip Revenue Share (%), by Country 2025 & 2033
- Figure 62: Asia Pacific Power Supply in Package and Power Supply on Chip Volume Share (%), by Country 2025 & 2033
List of Tables
- Table 1: Global Power Supply in Package and Power Supply on Chip Revenue billion Forecast, by Application 2020 & 2033
- Table 2: Global Power Supply in Package and Power Supply on Chip Volume K Forecast, by Application 2020 & 2033
- Table 3: Global Power Supply in Package and Power Supply on Chip Revenue billion Forecast, by Types 2020 & 2033
- Table 4: Global Power Supply in Package and Power Supply on Chip Volume K Forecast, by Types 2020 & 2033
- Table 5: Global Power Supply in Package and Power Supply on Chip Revenue billion Forecast, by Region 2020 & 2033
- Table 6: Global Power Supply in Package and Power Supply on Chip Volume K Forecast, by Region 2020 & 2033
- Table 7: Global Power Supply in Package and Power Supply on Chip Revenue billion Forecast, by Application 2020 & 2033
- Table 8: Global Power Supply in Package and Power Supply on Chip Volume K Forecast, by Application 2020 & 2033
- Table 9: Global Power Supply in Package and Power Supply on Chip Revenue billion Forecast, by Types 2020 & 2033
- Table 10: Global Power Supply in Package and Power Supply on Chip Volume K Forecast, by Types 2020 & 2033
- Table 11: Global Power Supply in Package and Power Supply on Chip Revenue billion Forecast, by Country 2020 & 2033
- Table 12: Global Power Supply in Package and Power Supply on Chip Volume K Forecast, by Country 2020 & 2033
- Table 13: United States Power Supply in Package and Power Supply on Chip Revenue (billion) Forecast, by Application 2020 & 2033
- Table 14: United States Power Supply in Package and Power Supply on Chip Volume (K) Forecast, by Application 2020 & 2033
- Table 15: Canada Power Supply in Package and Power Supply on Chip Revenue (billion) Forecast, by Application 2020 & 2033
- Table 16: Canada Power Supply in Package and Power Supply on Chip Volume (K) Forecast, by Application 2020 & 2033
- Table 17: Mexico Power Supply in Package and Power Supply on Chip Revenue (billion) Forecast, by Application 2020 & 2033
- Table 18: Mexico Power Supply in Package and Power Supply on Chip Volume (K) Forecast, by Application 2020 & 2033
- Table 19: Global Power Supply in Package and Power Supply on Chip Revenue billion Forecast, by Application 2020 & 2033
- Table 20: Global Power Supply in Package and Power Supply on Chip Volume K Forecast, by Application 2020 & 2033
- Table 21: Global Power Supply in Package and Power Supply on Chip Revenue billion Forecast, by Types 2020 & 2033
- Table 22: Global Power Supply in Package and Power Supply on Chip Volume K Forecast, by Types 2020 & 2033
- Table 23: Global Power Supply in Package and Power Supply on Chip Revenue billion Forecast, by Country 2020 & 2033
- Table 24: Global Power Supply in Package and Power Supply on Chip Volume K Forecast, by Country 2020 & 2033
- Table 25: Brazil Power Supply in Package and Power Supply on Chip Revenue (billion) Forecast, by Application 2020 & 2033
- Table 26: Brazil Power Supply in Package and Power Supply on Chip Volume (K) Forecast, by Application 2020 & 2033
- Table 27: Argentina Power Supply in Package and Power Supply on Chip Revenue (billion) Forecast, by Application 2020 & 2033
- Table 28: Argentina Power Supply in Package and Power Supply on Chip Volume (K) Forecast, by Application 2020 & 2033
- Table 29: Rest of South America Power Supply in Package and Power Supply on Chip Revenue (billion) Forecast, by Application 2020 & 2033
- Table 30: Rest of South America Power Supply in Package and Power Supply on Chip Volume (K) Forecast, by Application 2020 & 2033
- Table 31: Global Power Supply in Package and Power Supply on Chip Revenue billion Forecast, by Application 2020 & 2033
- Table 32: Global Power Supply in Package and Power Supply on Chip Volume K Forecast, by Application 2020 & 2033
- Table 33: Global Power Supply in Package and Power Supply on Chip Revenue billion Forecast, by Types 2020 & 2033
- Table 34: Global Power Supply in Package and Power Supply on Chip Volume K Forecast, by Types 2020 & 2033
- Table 35: Global Power Supply in Package and Power Supply on Chip Revenue billion Forecast, by Country 2020 & 2033
- Table 36: Global Power Supply in Package and Power Supply on Chip Volume K Forecast, by Country 2020 & 2033
- Table 37: United Kingdom Power Supply in Package and Power Supply on Chip Revenue (billion) Forecast, by Application 2020 & 2033
- Table 38: United Kingdom Power Supply in Package and Power Supply on Chip Volume (K) Forecast, by Application 2020 & 2033
- Table 39: Germany Power Supply in Package and Power Supply on Chip Revenue (billion) Forecast, by Application 2020 & 2033
- Table 40: Germany Power Supply in Package and Power Supply on Chip Volume (K) Forecast, by Application 2020 & 2033
- Table 41: France Power Supply in Package and Power Supply on Chip Revenue (billion) Forecast, by Application 2020 & 2033
- Table 42: France Power Supply in Package and Power Supply on Chip Volume (K) Forecast, by Application 2020 & 2033
- Table 43: Italy Power Supply in Package and Power Supply on Chip Revenue (billion) Forecast, by Application 2020 & 2033
- Table 44: Italy Power Supply in Package and Power Supply on Chip Volume (K) Forecast, by Application 2020 & 2033
- Table 45: Spain Power Supply in Package and Power Supply on Chip Revenue (billion) Forecast, by Application 2020 & 2033
- Table 46: Spain Power Supply in Package and Power Supply on Chip Volume (K) Forecast, by Application 2020 & 2033
- Table 47: Russia Power Supply in Package and Power Supply on Chip Revenue (billion) Forecast, by Application 2020 & 2033
- Table 48: Russia Power Supply in Package and Power Supply on Chip Volume (K) Forecast, by Application 2020 & 2033
- Table 49: Benelux Power Supply in Package and Power Supply on Chip Revenue (billion) Forecast, by Application 2020 & 2033
- Table 50: Benelux Power Supply in Package and Power Supply on Chip Volume (K) Forecast, by Application 2020 & 2033
- Table 51: Nordics Power Supply in Package and Power Supply on Chip Revenue (billion) Forecast, by Application 2020 & 2033
- Table 52: Nordics Power Supply in Package and Power Supply on Chip Volume (K) Forecast, by Application 2020 & 2033
- Table 53: Rest of Europe Power Supply in Package and Power Supply on Chip Revenue (billion) Forecast, by Application 2020 & 2033
- Table 54: Rest of Europe Power Supply in Package and Power Supply on Chip Volume (K) Forecast, by Application 2020 & 2033
- Table 55: Global Power Supply in Package and Power Supply on Chip Revenue billion Forecast, by Application 2020 & 2033
- Table 56: Global Power Supply in Package and Power Supply on Chip Volume K Forecast, by Application 2020 & 2033
- Table 57: Global Power Supply in Package and Power Supply on Chip Revenue billion Forecast, by Types 2020 & 2033
- Table 58: Global Power Supply in Package and Power Supply on Chip Volume K Forecast, by Types 2020 & 2033
- Table 59: Global Power Supply in Package and Power Supply on Chip Revenue billion Forecast, by Country 2020 & 2033
- Table 60: Global Power Supply in Package and Power Supply on Chip Volume K Forecast, by Country 2020 & 2033
- Table 61: Turkey Power Supply in Package and Power Supply on Chip Revenue (billion) Forecast, by Application 2020 & 2033
- Table 62: Turkey Power Supply in Package and Power Supply on Chip Volume (K) Forecast, by Application 2020 & 2033
- Table 63: Israel Power Supply in Package and Power Supply on Chip Revenue (billion) Forecast, by Application 2020 & 2033
- Table 64: Israel Power Supply in Package and Power Supply on Chip Volume (K) Forecast, by Application 2020 & 2033
- Table 65: GCC Power Supply in Package and Power Supply on Chip Revenue (billion) Forecast, by Application 2020 & 2033
- Table 66: GCC Power Supply in Package and Power Supply on Chip Volume (K) Forecast, by Application 2020 & 2033
- Table 67: North Africa Power Supply in Package and Power Supply on Chip Revenue (billion) Forecast, by Application 2020 & 2033
- Table 68: North Africa Power Supply in Package and Power Supply on Chip Volume (K) Forecast, by Application 2020 & 2033
- Table 69: South Africa Power Supply in Package and Power Supply on Chip Revenue (billion) Forecast, by Application 2020 & 2033
- Table 70: South Africa Power Supply in Package and Power Supply on Chip Volume (K) Forecast, by Application 2020 & 2033
- Table 71: Rest of Middle East & Africa Power Supply in Package and Power Supply on Chip Revenue (billion) Forecast, by Application 2020 & 2033
- Table 72: Rest of Middle East & Africa Power Supply in Package and Power Supply on Chip Volume (K) Forecast, by Application 2020 & 2033
- Table 73: Global Power Supply in Package and Power Supply on Chip Revenue billion Forecast, by Application 2020 & 2033
- Table 74: Global Power Supply in Package and Power Supply on Chip Volume K Forecast, by Application 2020 & 2033
- Table 75: Global Power Supply in Package and Power Supply on Chip Revenue billion Forecast, by Types 2020 & 2033
- Table 76: Global Power Supply in Package and Power Supply on Chip Volume K Forecast, by Types 2020 & 2033
- Table 77: Global Power Supply in Package and Power Supply on Chip Revenue billion Forecast, by Country 2020 & 2033
- Table 78: Global Power Supply in Package and Power Supply on Chip Volume K Forecast, by Country 2020 & 2033
- Table 79: China Power Supply in Package and Power Supply on Chip Revenue (billion) Forecast, by Application 2020 & 2033
- Table 80: China Power Supply in Package and Power Supply on Chip Volume (K) Forecast, by Application 2020 & 2033
- Table 81: India Power Supply in Package and Power Supply on Chip Revenue (billion) Forecast, by Application 2020 & 2033
- Table 82: India Power Supply in Package and Power Supply on Chip Volume (K) Forecast, by Application 2020 & 2033
- Table 83: Japan Power Supply in Package and Power Supply on Chip Revenue (billion) Forecast, by Application 2020 & 2033
- Table 84: Japan Power Supply in Package and Power Supply on Chip Volume (K) Forecast, by Application 2020 & 2033
- Table 85: South Korea Power Supply in Package and Power Supply on Chip Revenue (billion) Forecast, by Application 2020 & 2033
- Table 86: South Korea Power Supply in Package and Power Supply on Chip Volume (K) Forecast, by Application 2020 & 2033
- Table 87: ASEAN Power Supply in Package and Power Supply on Chip Revenue (billion) Forecast, by Application 2020 & 2033
- Table 88: ASEAN Power Supply in Package and Power Supply on Chip Volume (K) Forecast, by Application 2020 & 2033
- Table 89: Oceania Power Supply in Package and Power Supply on Chip Revenue (billion) Forecast, by Application 2020 & 2033
- Table 90: Oceania Power Supply in Package and Power Supply on Chip Volume (K) Forecast, by Application 2020 & 2033
- Table 91: Rest of Asia Pacific Power Supply in Package and Power Supply on Chip Revenue (billion) Forecast, by Application 2020 & 2033
- Table 92: Rest of Asia Pacific Power Supply in Package and Power Supply on Chip Volume (K) Forecast, by Application 2020 & 2033
Frequently Asked Questions
1. What is the projected Compound Annual Growth Rate (CAGR) of the Power Supply in Package and Power Supply on Chip?
The projected CAGR is approximately 7.86%.
2. Which companies are prominent players in the Power Supply in Package and Power Supply on Chip?
Key companies in the market include Intel Corporation, ASE Group, Amkor Technology, TDK Corporation, Panasonic, Bel Fuse Inc., Jiangsu Changjiang Electronics Technology, Texas Instruments Incorporated, ON Semiconductor, Vicor Corporation.
3. What are the main segments of the Power Supply in Package and Power Supply on Chip?
The market segments include Application, Types.
4. Can you provide details about the market size?
The market size is estimated to be USD 3.06 billion as of 2022.
5. What are some drivers contributing to market growth?
N/A
6. What are the notable trends driving market growth?
N/A
7. Are there any restraints impacting market growth?
N/A
8. Can you provide examples of recent developments in the market?
N/A
9. What pricing options are available for accessing the report?
Pricing options include single-user, multi-user, and enterprise licenses priced at USD 4350.00, USD 6525.00, and USD 8700.00 respectively.
10. Is the market size provided in terms of value or volume?
The market size is provided in terms of value, measured in billion and volume, measured in K.
11. Are there any specific market keywords associated with the report?
Yes, the market keyword associated with the report is "Power Supply in Package and Power Supply on Chip," which aids in identifying and referencing the specific market segment covered.
12. How do I determine which pricing option suits my needs best?
The pricing options vary based on user requirements and access needs. Individual users may opt for single-user licenses, while businesses requiring broader access may choose multi-user or enterprise licenses for cost-effective access to the report.
13. Are there any additional resources or data provided in the Power Supply in Package and Power Supply on Chip report?
While the report offers comprehensive insights, it's advisable to review the specific contents or supplementary materials provided to ascertain if additional resources or data are available.
14. How can I stay updated on further developments or reports in the Power Supply in Package and Power Supply on Chip?
To stay informed about further developments, trends, and reports in the Power Supply in Package and Power Supply on Chip, consider subscribing to industry newsletters, following relevant companies and organizations, or regularly checking reputable industry news sources and publications.
Methodology
Step 1 - Identification of Relevant Samples Size from Population Database


Step 2 - Approaches for Defining Global Market Size (Value, Volume* & Price*)

Note*: In applicable scenarios
Step 3 - Data Sources
Primary Research
- Web Analytics
- Survey Reports
- Research Institute
- Latest Research Reports
- Opinion Leaders
Secondary Research
- Annual Reports
- White Paper
- Latest Press Release
- Industry Association
- Paid Database
- Investor Presentations

Step 4 - Data Triangulation
Involves using different sources of information in order to increase the validity of a study
These sources are likely to be stakeholders in a program - participants, other researchers, program staff, other community members, and so on.
Then we put all data in single framework & apply various statistical tools to find out the dynamic on the market.
During the analysis stage, feedback from the stakeholder groups would be compared to determine areas of agreement as well as areas of divergence