

Key Insights
The precision farming software market is poised for substantial expansion, driven by the escalating demand for efficient and sustainable agricultural operations. With a projected compound annual growth rate (CAGR) of 13.9%, the market is expected to reach $2.7 billion by 2025. This growth is propelled by several key factors: the integration of advanced technologies such as GPS, IoT sensors, and AI-powered analytics, which are revolutionizing farm management for improved yields and resource optimization; government incentives supporting digital agriculture; and a rising farmer awareness of data-driven decision-making benefits. The market is segmented by application (crop management, financial management, farm inventory, personnel management, weather tracking, and others) and by deployment type (local/web-based and cloud-based). Cloud-based solutions are gaining significant traction due to their scalability, accessibility, and enhanced data-sharing capabilities. Leading companies including Deere & Company, Trimble Inc., and Raven Industries are actively investing in research and development and strategic alliances to solidify their market positions. Despite initial investment hurdles and varying digital literacy among farmers, the demonstrable long-term benefits in efficiency and profitability are driving sustained market growth.
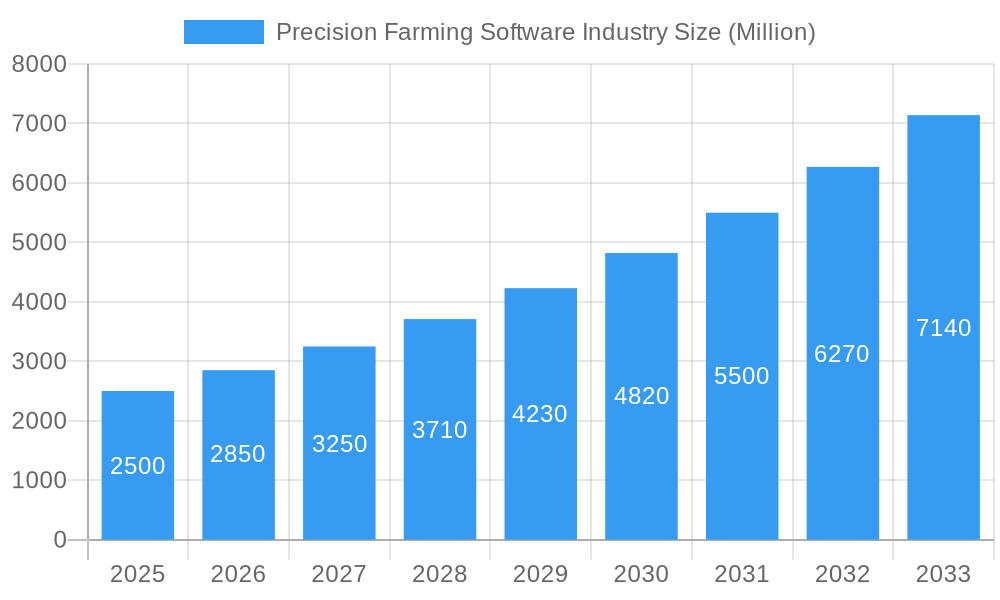
Precision Farming Software Industry Market Size (In Billion)
North America and Europe currently lead the market due to high technology adoption and mature agricultural sectors. However, the Asia-Pacific region is anticipated to experience significant growth, fueled by expanding farmlands and government initiatives promoting agricultural modernization. The competitive landscape features a blend of established enterprises and agile startups, fostering innovation and competitive pricing strategies. Precision farming software is set to become indispensable in shaping the future of agriculture, enhancing sustainability, and bolstering global food security. Future growth will likely be accelerated by advancements in AI and machine learning, further integrating data analytics to optimize diverse farm management operations.
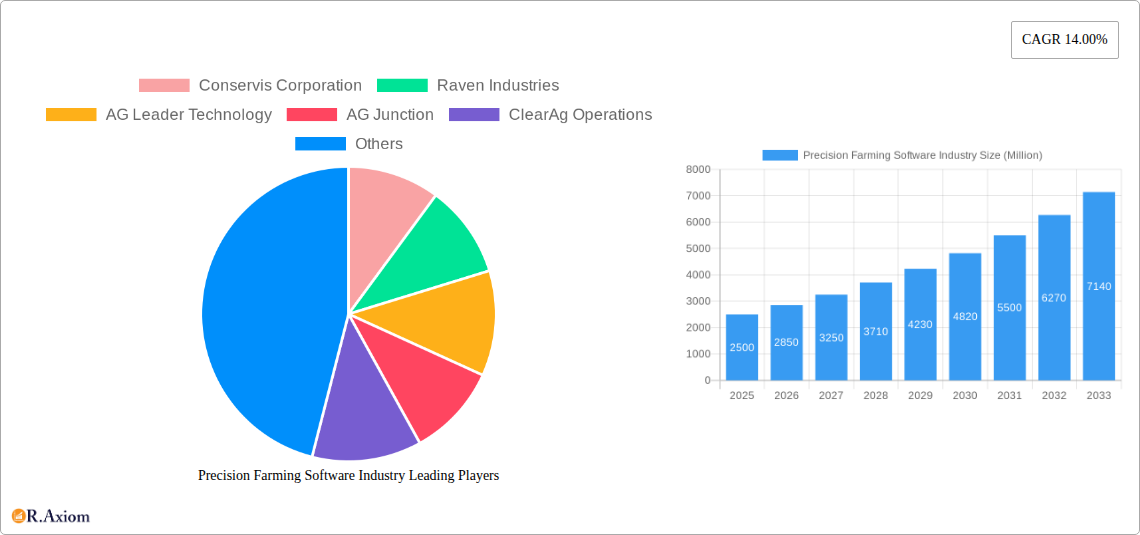
Precision Farming Software Industry Company Market Share
Precision Farming Software Market Report: 2019-2033
This comprehensive report provides a detailed analysis of the global Precision Farming Software market, offering actionable insights for industry stakeholders, investors, and businesses. The study period spans from 2019 to 2033, with 2025 serving as the base and estimated year. The forecast period covers 2025-2033, and the historical period encompasses 2019-2024. The market is segmented by application (Crop Management, Financial Management, Farm Inventory Management, Personnel Management, Weather Tracking and Forecasting, Other Applications) and type (Local/Web-based, Cloud-based). Key players analyzed include Conservis Corporation, Raven Industries, AG Leader Technology, AG Junction, ClearAg Operations, Deere & Company, Fairport Farm Software, AG DNA, Topcon Positioning Systems, Trimble Inc, Bayer CropScience AG, Agribotix, Case IH Agriculture, Mapshots Inc, IBM, and AGCO Corporation. The report projects a market value of xx Million by 2033, exhibiting a CAGR of xx% during the forecast period.
Precision Farming Software Industry Market Concentration & Innovation
The Precision Farming Software market exhibits a moderately concentrated landscape, with a few major players holding significant market share. Conservis Corporation, Deere & Company, and Trimble Inc. are among the leading companies, collectively controlling an estimated xx% of the market in 2025. However, numerous smaller players and startups are driving innovation through specialized software and niche applications. The market is characterized by intense competition, with companies focusing on developing advanced features, such as AI-powered analytics and predictive modeling, to gain a competitive edge.
- Innovation Drivers: Increased demand for data-driven decision-making, advancements in IoT and AI technologies, and government support for precision agriculture are key drivers of innovation.
- Regulatory Frameworks: Regulations related to data privacy and security, along with those promoting sustainable agriculture practices, significantly influence market dynamics.
- Product Substitutes: While fully comprehensive precision farming software packages are unique, alternative solutions like standalone sensors and basic farm management tools provide partial functionality.
- End-User Trends: Farmers are increasingly adopting cloud-based solutions for improved accessibility, data sharing, and collaboration. A growing demand for integrated platforms that handle various farm management aspects is also observed.
- M&A Activities: The past five years have seen several mergers and acquisitions in the industry, with deal values totaling approximately xx Million. These activities reflect the consolidation trend and the pursuit of technological synergies among players. Examples include (insert specific examples if available with deal values, otherwise replace with "Several acquisitions focused on expanding data analytics and AI capabilities").
Precision Farming Software Industry Industry Trends & Insights
The Precision Farming Software market is experiencing robust growth, driven by several factors. The increasing adoption of precision farming techniques by farmers worldwide is a significant driver, fueled by the need for improved efficiency, reduced costs, and enhanced sustainability. The rising availability of affordable sensors, GPS technology, and data analytics tools further supports market expansion. Technological disruptions, such as the emergence of AI-powered platforms, are revolutionizing the industry by enabling more sophisticated data analysis and predictive modeling. Consumer preferences are shifting towards cloud-based solutions offering enhanced accessibility, data storage, and collaborative features. Competitive dynamics are intensifying, with companies constantly vying for market share through product innovation, strategic partnerships, and mergers and acquisitions. Market penetration of precision farming software is expected to reach xx% by 2033, indicating significant growth potential. The global market value is expected to reach xx Million by 2033, driven by a CAGR of xx%.
Dominant Markets & Segments in Precision Farming Software Industry
The North American region currently holds the dominant position in the Precision Farming Software market, followed by Europe and Asia-Pacific. Within North America, the US leads with high adoption rates driven by factors such as:
- Key Drivers for North America Dominance:
- Advanced agricultural infrastructure
- High level of technology adoption among farmers
- Favorable government policies and support for precision agriculture
- Significant investment in agricultural research and development.
The Crop Management segment is the largest application segment, accounting for approximately xx% of the market share in 2025. This is followed by Financial Management and Farm Inventory Management. The cloud-based segment dominates the market type, reflecting the growing preference for remote accessibility and data sharing capabilities.
- Crop Management: This segment's dominance stems from the ability to optimize planting, fertilization, and pest control for improved yields and profitability.
- Cloud-Based Solutions: The cloud-based model delivers scalability, cost-effectiveness, and seamless data accessibility across multiple devices and locations.
Precision Farming Software Industry Product Developments
Recent product innovations focus on integrating AI and machine learning for advanced data analysis, predictive modeling, and automation of farming tasks. Companies are also incorporating drone technology and remote sensing for improved data acquisition and monitoring. These innovations deliver competitive advantages by enhancing accuracy, efficiency, and decision-making for farmers, leading to better crop yields and reduced operational costs. The market sees a steady shift towards integrated platforms that offer comprehensive farm management solutions, consolidating various functionalities into a single system.
Report Scope & Segmentation Analysis
The report comprehensively analyzes the Precision Farming Software market across various segments. By Application: Crop Management, representing the largest segment, is expected to grow at a CAGR of xx% during the forecast period, driven by the need for optimized yield and resource management. Financial Management, Farm Inventory Management, Personnel Management, Weather Tracking and Forecasting, and Other Applications are other key segments. By Type: The Cloud-based segment is anticipated to witness significant growth, fueled by accessibility and scalability advantages. Local or Web-based solutions represent a smaller, but still significant, segment. Each segment's growth is influenced by factors like technological advancements, regulatory changes, and farmer adoption rates, leading to a dynamic competitive landscape.
Key Drivers of Precision Farming Software Growth
Several factors propel the growth of the Precision Farming Software market. Technological advancements, particularly in AI, IoT, and data analytics, are fundamental drivers, enhancing the capabilities and efficiency of software solutions. Economic factors, including the rising cost of labor and resources, incentivize farmers to adopt cost-effective and yield-enhancing technologies. Government regulations and initiatives promoting sustainable agriculture and precision farming practices also contribute to market growth.
Challenges in the Precision Farming Software Industry Sector
The Precision Farming Software market faces challenges including high initial investment costs, requiring significant upfront expenditure for hardware and software. Data security concerns and privacy regulations necessitate robust data protection measures. The complex integration of various systems and data sources presents an ongoing challenge. Competition from established players and emerging startups creates a dynamic and demanding market environment.
Emerging Opportunities in Precision Farming Software Industry
Emerging opportunities include the integration of blockchain technology for secure data management, the expansion into new geographic markets with developing agricultural sectors, and the development of specialized solutions tailored to specific crop types and farming practices. The increasing focus on sustainable agriculture opens opportunities for software solutions that support eco-friendly practices.
Leading Players in the Precision Farming Software Industry Market
- Conservis Corporation
- Raven Industries
- AG Leader Technology
- AG Junction
- ClearAg Operations
- Deere & Company
- Fairport Farm Software
- AG DNA
- Topcon Positioning Systems
- Trimble Inc
- Bayer CropScience AG
- Agribotix
- Case IH Agriculture
- Mapshots Inc
- IBM
- AGCO Corporation
Key Developments in Precision Farming Software Industry
- 2022 Q4: Deere & Company launched a new precision farming software platform integrating AI capabilities for yield prediction.
- 2023 Q1: Trimble Inc. acquired a smaller precision farming software company specializing in drone data analysis (replace with actual example if available).
- 2024 Q2: A significant partnership was formed between Raven Industries and a leading agricultural technology provider to expand market reach (replace with actual example if available). (Add more bullet points with specific year/month and details as available)
Strategic Outlook for Precision Farming Software Market
The Precision Farming Software market is poised for continued growth, driven by the increasing adoption of digital technologies in agriculture and the demand for enhanced efficiency and sustainability. Future market potential lies in the expansion of AI-powered solutions, the integration of diverse data sources, and the development of user-friendly platforms. Opportunities exist in emerging markets and within specialized farming segments. The focus on data security, interoperability, and sustainability will be crucial for sustained success in this evolving market.
Precision Farming Software Industry Segmentation
-
1. Application
- 1.1. Crop Management
- 1.2. Financial Management
- 1.3. Farm Inventory Management
- 1.4. Personnel Management
- 1.5. Weather Tracking and Forecasting
- 1.6. Other Applications
-
2. Type
- 2.1. Local or Web-based
- 2.2. Cloud-based
-
3. Application
- 3.1. Crop Management
- 3.2. Financial Management
- 3.3. Farm Inventory Management
- 3.4. Personnel Management
- 3.5. Weather Tracking and Forecasting
- 3.6. Other Applications
-
4. Type
- 4.1. Local or Web-based
- 4.2. Cloud-based
Precision Farming Software Industry Segmentation By Geography
-
1. North America
- 1.1. United States
- 1.2. Canada
- 1.3. Mexico
- 1.4. Rest of North America
-
2. Europe
- 2.1. Germany
- 2.2. United Kingdom
- 2.3. France
- 2.4. Italy
- 2.5. Spain
- 2.6. Rest of Europe
-
3. Asia Pacific
- 3.1. China
- 3.2. Japan
- 3.3. India
- 3.4. Australia
- 3.5. Rest of Asia Pacific
-
4. South America
- 4.1. Brazil
- 4.2. Argentina
- 4.3. Rest of South America
-
5. Africa
- 5.1. South Africa
- 5.2. Rest of Africa
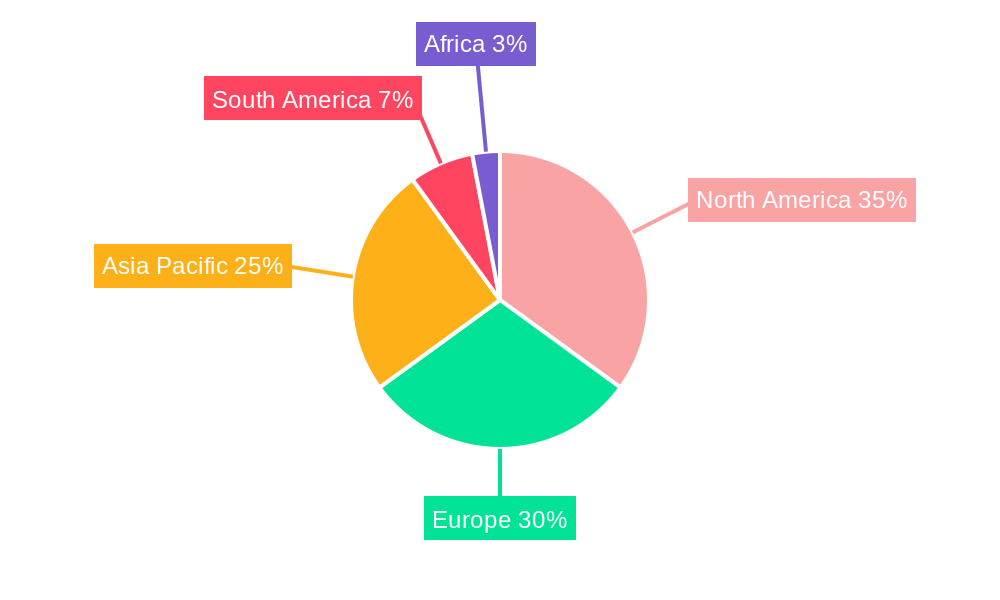
Precision Farming Software Industry Regional Market Share
Geographic Coverage of Precision Farming Software Industry
Precision Farming Software Industry REPORT HIGHLIGHTS
| Aspects | Details |
|---|---|
| Study Period | 2020-2034 |
| Base Year | 2025 |
| Estimated Year | 2026 |
| Forecast Period | 2026-2034 |
| Historical Period | 2020-2025 |
| Growth Rate | CAGR of 13.9% from 2020-2034 |
| Segmentation |
|
Table of Contents
- 1. Introduction
- 1.1. Research Scope
- 1.2. Market Segmentation
- 1.3. Research Objective
- 1.4. Definitions and Assumptions
- 2. Executive Summary
- 2.1. Market Snapshot
- 3. Market Dynamics
- 3.1. Market Drivers
- 3.2. Market Restrains
- 3.3. Market Trends
- 3.4. Market Opportunities
- 4. Market Factor Analysis
- 4.1. Porters Five Forces
- 4.1.1. Bargaining Power of Suppliers
- 4.1.2. Bargaining Power of Buyers
- 4.1.3. Threat of New Entrants
- 4.1.4. Threat of Substitutes
- 4.1.5. Competitive Rivalry
- 4.2. PESTEL analysis
- 4.3. BCG Analysis
- 4.3.1. Stars (High Growth, High Market Share)
- 4.3.2. Cash Cows (Low Growth, High Market Share)
- 4.3.3. Question Mark (High Growth, Low Market Share)
- 4.3.4. Dogs (Low Growth, Low Market Share)
- 4.4. Ansoff Matrix Analysis
- 4.5. Supply Chain Analysis
- 4.6. Regulatory Landscape
- 4.7. Current Market Potential and Opportunity Assessment (TAM–SAM–SOM Framework)
- 4.8. RAX Analyst Note
- 4.1. Porters Five Forces
- 5. Market Analysis, Insights and Forecast 2021-2033
- 5.1. Market Analysis, Insights and Forecast - by Application
- 5.1.1. Crop Management
- 5.1.2. Financial Management
- 5.1.3. Farm Inventory Management
- 5.1.4. Personnel Management
- 5.1.5. Weather Tracking and Forecasting
- 5.1.6. Other Applications
- 5.2. Market Analysis, Insights and Forecast - by Type
- 5.2.1. Local or Web-based
- 5.2.2. Cloud-based
- 5.3. Market Analysis, Insights and Forecast - by Application
- 5.3.1. Crop Management
- 5.3.2. Financial Management
- 5.3.3. Farm Inventory Management
- 5.3.4. Personnel Management
- 5.3.5. Weather Tracking and Forecasting
- 5.3.6. Other Applications
- 5.4. Market Analysis, Insights and Forecast - by Type
- 5.4.1. Local or Web-based
- 5.4.2. Cloud-based
- 5.5. Market Analysis, Insights and Forecast - by Region
- 5.5.1. North America
- 5.5.2. Europe
- 5.5.3. Asia Pacific
- 5.5.4. South America
- 5.5.5. Africa
- 5.1. Market Analysis, Insights and Forecast - by Application
- 6. Global Precision Farming Software Industry Analysis, Insights and Forecast, 2021-2033
- 6.1. Market Analysis, Insights and Forecast - by Application
- 6.1.1. Crop Management
- 6.1.2. Financial Management
- 6.1.3. Farm Inventory Management
- 6.1.4. Personnel Management
- 6.1.5. Weather Tracking and Forecasting
- 6.1.6. Other Applications
- 6.2. Market Analysis, Insights and Forecast - by Type
- 6.2.1. Local or Web-based
- 6.2.2. Cloud-based
- 6.3. Market Analysis, Insights and Forecast - by Application
- 6.3.1. Crop Management
- 6.3.2. Financial Management
- 6.3.3. Farm Inventory Management
- 6.3.4. Personnel Management
- 6.3.5. Weather Tracking and Forecasting
- 6.3.6. Other Applications
- 6.4. Market Analysis, Insights and Forecast - by Type
- 6.4.1. Local or Web-based
- 6.4.2. Cloud-based
- 6.1. Market Analysis, Insights and Forecast - by Application
- 7. North America Precision Farming Software Industry Analysis, Insights and Forecast, 2020-2032
- 7.1. Market Analysis, Insights and Forecast - by Application
- 7.1.1. Crop Management
- 7.1.2. Financial Management
- 7.1.3. Farm Inventory Management
- 7.1.4. Personnel Management
- 7.1.5. Weather Tracking and Forecasting
- 7.1.6. Other Applications
- 7.2. Market Analysis, Insights and Forecast - by Type
- 7.2.1. Local or Web-based
- 7.2.2. Cloud-based
- 7.3. Market Analysis, Insights and Forecast - by Application
- 7.3.1. Crop Management
- 7.3.2. Financial Management
- 7.3.3. Farm Inventory Management
- 7.3.4. Personnel Management
- 7.3.5. Weather Tracking and Forecasting
- 7.3.6. Other Applications
- 7.4. Market Analysis, Insights and Forecast - by Type
- 7.4.1. Local or Web-based
- 7.4.2. Cloud-based
- 7.1. Market Analysis, Insights and Forecast - by Application
- 8. Europe Precision Farming Software Industry Analysis, Insights and Forecast, 2020-2032
- 8.1. Market Analysis, Insights and Forecast - by Application
- 8.1.1. Crop Management
- 8.1.2. Financial Management
- 8.1.3. Farm Inventory Management
- 8.1.4. Personnel Management
- 8.1.5. Weather Tracking and Forecasting
- 8.1.6. Other Applications
- 8.2. Market Analysis, Insights and Forecast - by Type
- 8.2.1. Local or Web-based
- 8.2.2. Cloud-based
- 8.3. Market Analysis, Insights and Forecast - by Application
- 8.3.1. Crop Management
- 8.3.2. Financial Management
- 8.3.3. Farm Inventory Management
- 8.3.4. Personnel Management
- 8.3.5. Weather Tracking and Forecasting
- 8.3.6. Other Applications
- 8.4. Market Analysis, Insights and Forecast - by Type
- 8.4.1. Local or Web-based
- 8.4.2. Cloud-based
- 8.1. Market Analysis, Insights and Forecast - by Application
- 9. Asia Pacific Precision Farming Software Industry Analysis, Insights and Forecast, 2020-2032
- 9.1. Market Analysis, Insights and Forecast - by Application
- 9.1.1. Crop Management
- 9.1.2. Financial Management
- 9.1.3. Farm Inventory Management
- 9.1.4. Personnel Management
- 9.1.5. Weather Tracking and Forecasting
- 9.1.6. Other Applications
- 9.2. Market Analysis, Insights and Forecast - by Type
- 9.2.1. Local or Web-based
- 9.2.2. Cloud-based
- 9.3. Market Analysis, Insights and Forecast - by Application
- 9.3.1. Crop Management
- 9.3.2. Financial Management
- 9.3.3. Farm Inventory Management
- 9.3.4. Personnel Management
- 9.3.5. Weather Tracking and Forecasting
- 9.3.6. Other Applications
- 9.4. Market Analysis, Insights and Forecast - by Type
- 9.4.1. Local or Web-based
- 9.4.2. Cloud-based
- 9.1. Market Analysis, Insights and Forecast - by Application
- 10. South America Precision Farming Software Industry Analysis, Insights and Forecast, 2020-2032
- 10.1. Market Analysis, Insights and Forecast - by Application
- 10.1.1. Crop Management
- 10.1.2. Financial Management
- 10.1.3. Farm Inventory Management
- 10.1.4. Personnel Management
- 10.1.5. Weather Tracking and Forecasting
- 10.1.6. Other Applications
- 10.2. Market Analysis, Insights and Forecast - by Type
- 10.2.1. Local or Web-based
- 10.2.2. Cloud-based
- 10.3. Market Analysis, Insights and Forecast - by Application
- 10.3.1. Crop Management
- 10.3.2. Financial Management
- 10.3.3. Farm Inventory Management
- 10.3.4. Personnel Management
- 10.3.5. Weather Tracking and Forecasting
- 10.3.6. Other Applications
- 10.4. Market Analysis, Insights and Forecast - by Type
- 10.4.1. Local or Web-based
- 10.4.2. Cloud-based
- 10.1. Market Analysis, Insights and Forecast - by Application
- 11. Africa Precision Farming Software Industry Analysis, Insights and Forecast, 2020-2032
- 11.1. Market Analysis, Insights and Forecast - by Application
- 11.1.1. Crop Management
- 11.1.2. Financial Management
- 11.1.3. Farm Inventory Management
- 11.1.4. Personnel Management
- 11.1.5. Weather Tracking and Forecasting
- 11.1.6. Other Applications
- 11.2. Market Analysis, Insights and Forecast - by Type
- 11.2.1. Local or Web-based
- 11.2.2. Cloud-based
- 11.3. Market Analysis, Insights and Forecast - by Application
- 11.3.1. Crop Management
- 11.3.2. Financial Management
- 11.3.3. Farm Inventory Management
- 11.3.4. Personnel Management
- 11.3.5. Weather Tracking and Forecasting
- 11.3.6. Other Applications
- 11.4. Market Analysis, Insights and Forecast - by Type
- 11.4.1. Local or Web-based
- 11.4.2. Cloud-based
- 11.1. Market Analysis, Insights and Forecast - by Application
- 12. Competitive Analysis
- 12.1. Company Profiles
- 12.1.1 Conservis Corporation
- 12.1.1.1. Company Overview
- 12.1.1.2. Products
- 12.1.1.3. Company Financials
- 12.1.1.4. SWOT Analysis
- 12.1.2 Raven Industries
- 12.1.2.1. Company Overview
- 12.1.2.2. Products
- 12.1.2.3. Company Financials
- 12.1.2.4. SWOT Analysis
- 12.1.3 AG Leader Technology
- 12.1.3.1. Company Overview
- 12.1.3.2. Products
- 12.1.3.3. Company Financials
- 12.1.3.4. SWOT Analysis
- 12.1.4 AG Junction
- 12.1.4.1. Company Overview
- 12.1.4.2. Products
- 12.1.4.3. Company Financials
- 12.1.4.4. SWOT Analysis
- 12.1.5 ClearAg Operations
- 12.1.5.1. Company Overview
- 12.1.5.2. Products
- 12.1.5.3. Company Financials
- 12.1.5.4. SWOT Analysis
- 12.1.6 Deere & Company
- 12.1.6.1. Company Overview
- 12.1.6.2. Products
- 12.1.6.3. Company Financials
- 12.1.6.4. SWOT Analysis
- 12.1.7 Fairport Farm Software
- 12.1.7.1. Company Overview
- 12.1.7.2. Products
- 12.1.7.3. Company Financials
- 12.1.7.4. SWOT Analysis
- 12.1.8 AG DNA
- 12.1.8.1. Company Overview
- 12.1.8.2. Products
- 12.1.8.3. Company Financials
- 12.1.8.4. SWOT Analysis
- 12.1.9 Topcon Positioning Systems
- 12.1.9.1. Company Overview
- 12.1.9.2. Products
- 12.1.9.3. Company Financials
- 12.1.9.4. SWOT Analysis
- 12.1.10 Trimble Inc
- 12.1.10.1. Company Overview
- 12.1.10.2. Products
- 12.1.10.3. Company Financials
- 12.1.10.4. SWOT Analysis
- 12.1.11 Bayer CropScience AG
- 12.1.11.1. Company Overview
- 12.1.11.2. Products
- 12.1.11.3. Company Financials
- 12.1.11.4. SWOT Analysis
- 12.1.12 Agribotix
- 12.1.12.1. Company Overview
- 12.1.12.2. Products
- 12.1.12.3. Company Financials
- 12.1.12.4. SWOT Analysis
- 12.1.13 Case IH Agriculture
- 12.1.13.1. Company Overview
- 12.1.13.2. Products
- 12.1.13.3. Company Financials
- 12.1.13.4. SWOT Analysis
- 12.1.14 Mapshots Inc
- 12.1.14.1. Company Overview
- 12.1.14.2. Products
- 12.1.14.3. Company Financials
- 12.1.14.4. SWOT Analysis
- 12.1.15 IBM
- 12.1.15.1. Company Overview
- 12.1.15.2. Products
- 12.1.15.3. Company Financials
- 12.1.15.4. SWOT Analysis
- 12.1.16 AGCO Corporation
- 12.1.16.1. Company Overview
- 12.1.16.2. Products
- 12.1.16.3. Company Financials
- 12.1.16.4. SWOT Analysis
- 12.1.1 Conservis Corporation
- 12.2. Market Entropy
- 12.2.1 Company's Key Areas Served
- 12.2.2 Recent Developments
- 12.3. Company Market Share Analysis 2025
- 12.3.1 Top 5 Companies Market Share Analysis
- 12.3.2 Top 3 Companies Market Share Analysis
- 12.4. List of Potential Customers
- 13. Research Methodology
List of Figures
- Figure 1: Global Precision Farming Software Industry Revenue Breakdown (billion, %) by Region 2025 & 2033
- Figure 2: North America Precision Farming Software Industry Revenue (billion), by Application 2025 & 2033
- Figure 3: North America Precision Farming Software Industry Revenue Share (%), by Application 2025 & 2033
- Figure 4: North America Precision Farming Software Industry Revenue (billion), by Type 2025 & 2033
- Figure 5: North America Precision Farming Software Industry Revenue Share (%), by Type 2025 & 2033
- Figure 6: North America Precision Farming Software Industry Revenue (billion), by Application 2025 & 2033
- Figure 7: North America Precision Farming Software Industry Revenue Share (%), by Application 2025 & 2033
- Figure 8: North America Precision Farming Software Industry Revenue (billion), by Type 2025 & 2033
- Figure 9: North America Precision Farming Software Industry Revenue Share (%), by Type 2025 & 2033
- Figure 10: North America Precision Farming Software Industry Revenue (billion), by Country 2025 & 2033
- Figure 11: North America Precision Farming Software Industry Revenue Share (%), by Country 2025 & 2033
- Figure 12: Europe Precision Farming Software Industry Revenue (billion), by Application 2025 & 2033
- Figure 13: Europe Precision Farming Software Industry Revenue Share (%), by Application 2025 & 2033
- Figure 14: Europe Precision Farming Software Industry Revenue (billion), by Type 2025 & 2033
- Figure 15: Europe Precision Farming Software Industry Revenue Share (%), by Type 2025 & 2033
- Figure 16: Europe Precision Farming Software Industry Revenue (billion), by Application 2025 & 2033
- Figure 17: Europe Precision Farming Software Industry Revenue Share (%), by Application 2025 & 2033
- Figure 18: Europe Precision Farming Software Industry Revenue (billion), by Type 2025 & 2033
- Figure 19: Europe Precision Farming Software Industry Revenue Share (%), by Type 2025 & 2033
- Figure 20: Europe Precision Farming Software Industry Revenue (billion), by Country 2025 & 2033
- Figure 21: Europe Precision Farming Software Industry Revenue Share (%), by Country 2025 & 2033
- Figure 22: Asia Pacific Precision Farming Software Industry Revenue (billion), by Application 2025 & 2033
- Figure 23: Asia Pacific Precision Farming Software Industry Revenue Share (%), by Application 2025 & 2033
- Figure 24: Asia Pacific Precision Farming Software Industry Revenue (billion), by Type 2025 & 2033
- Figure 25: Asia Pacific Precision Farming Software Industry Revenue Share (%), by Type 2025 & 2033
- Figure 26: Asia Pacific Precision Farming Software Industry Revenue (billion), by Application 2025 & 2033
- Figure 27: Asia Pacific Precision Farming Software Industry Revenue Share (%), by Application 2025 & 2033
- Figure 28: Asia Pacific Precision Farming Software Industry Revenue (billion), by Type 2025 & 2033
- Figure 29: Asia Pacific Precision Farming Software Industry Revenue Share (%), by Type 2025 & 2033
- Figure 30: Asia Pacific Precision Farming Software Industry Revenue (billion), by Country 2025 & 2033
- Figure 31: Asia Pacific Precision Farming Software Industry Revenue Share (%), by Country 2025 & 2033
- Figure 32: South America Precision Farming Software Industry Revenue (billion), by Application 2025 & 2033
- Figure 33: South America Precision Farming Software Industry Revenue Share (%), by Application 2025 & 2033
- Figure 34: South America Precision Farming Software Industry Revenue (billion), by Type 2025 & 2033
- Figure 35: South America Precision Farming Software Industry Revenue Share (%), by Type 2025 & 2033
- Figure 36: South America Precision Farming Software Industry Revenue (billion), by Application 2025 & 2033
- Figure 37: South America Precision Farming Software Industry Revenue Share (%), by Application 2025 & 2033
- Figure 38: South America Precision Farming Software Industry Revenue (billion), by Type 2025 & 2033
- Figure 39: South America Precision Farming Software Industry Revenue Share (%), by Type 2025 & 2033
- Figure 40: South America Precision Farming Software Industry Revenue (billion), by Country 2025 & 2033
- Figure 41: South America Precision Farming Software Industry Revenue Share (%), by Country 2025 & 2033
- Figure 42: Africa Precision Farming Software Industry Revenue (billion), by Application 2025 & 2033
- Figure 43: Africa Precision Farming Software Industry Revenue Share (%), by Application 2025 & 2033
- Figure 44: Africa Precision Farming Software Industry Revenue (billion), by Type 2025 & 2033
- Figure 45: Africa Precision Farming Software Industry Revenue Share (%), by Type 2025 & 2033
- Figure 46: Africa Precision Farming Software Industry Revenue (billion), by Application 2025 & 2033
- Figure 47: Africa Precision Farming Software Industry Revenue Share (%), by Application 2025 & 2033
- Figure 48: Africa Precision Farming Software Industry Revenue (billion), by Type 2025 & 2033
- Figure 49: Africa Precision Farming Software Industry Revenue Share (%), by Type 2025 & 2033
- Figure 50: Africa Precision Farming Software Industry Revenue (billion), by Country 2025 & 2033
- Figure 51: Africa Precision Farming Software Industry Revenue Share (%), by Country 2025 & 2033
List of Tables
- Table 1: Global Precision Farming Software Industry Revenue billion Forecast, by Application 2020 & 2033
- Table 2: Global Precision Farming Software Industry Revenue billion Forecast, by Type 2020 & 2033
- Table 3: Global Precision Farming Software Industry Revenue billion Forecast, by Application 2020 & 2033
- Table 4: Global Precision Farming Software Industry Revenue billion Forecast, by Type 2020 & 2033
- Table 5: Global Precision Farming Software Industry Revenue billion Forecast, by Region 2020 & 2033
- Table 6: Global Precision Farming Software Industry Revenue billion Forecast, by Application 2020 & 2033
- Table 7: Global Precision Farming Software Industry Revenue billion Forecast, by Type 2020 & 2033
- Table 8: Global Precision Farming Software Industry Revenue billion Forecast, by Application 2020 & 2033
- Table 9: Global Precision Farming Software Industry Revenue billion Forecast, by Type 2020 & 2033
- Table 10: Global Precision Farming Software Industry Revenue billion Forecast, by Country 2020 & 2033
- Table 11: United States Precision Farming Software Industry Revenue (billion) Forecast, by Application 2020 & 2033
- Table 12: Canada Precision Farming Software Industry Revenue (billion) Forecast, by Application 2020 & 2033
- Table 13: Mexico Precision Farming Software Industry Revenue (billion) Forecast, by Application 2020 & 2033
- Table 14: Rest of North America Precision Farming Software Industry Revenue (billion) Forecast, by Application 2020 & 2033
- Table 15: Global Precision Farming Software Industry Revenue billion Forecast, by Application 2020 & 2033
- Table 16: Global Precision Farming Software Industry Revenue billion Forecast, by Type 2020 & 2033
- Table 17: Global Precision Farming Software Industry Revenue billion Forecast, by Application 2020 & 2033
- Table 18: Global Precision Farming Software Industry Revenue billion Forecast, by Type 2020 & 2033
- Table 19: Global Precision Farming Software Industry Revenue billion Forecast, by Country 2020 & 2033
- Table 20: Germany Precision Farming Software Industry Revenue (billion) Forecast, by Application 2020 & 2033
- Table 21: United Kingdom Precision Farming Software Industry Revenue (billion) Forecast, by Application 2020 & 2033
- Table 22: France Precision Farming Software Industry Revenue (billion) Forecast, by Application 2020 & 2033
- Table 23: Italy Precision Farming Software Industry Revenue (billion) Forecast, by Application 2020 & 2033
- Table 24: Spain Precision Farming Software Industry Revenue (billion) Forecast, by Application 2020 & 2033
- Table 25: Rest of Europe Precision Farming Software Industry Revenue (billion) Forecast, by Application 2020 & 2033
- Table 26: Global Precision Farming Software Industry Revenue billion Forecast, by Application 2020 & 2033
- Table 27: Global Precision Farming Software Industry Revenue billion Forecast, by Type 2020 & 2033
- Table 28: Global Precision Farming Software Industry Revenue billion Forecast, by Application 2020 & 2033
- Table 29: Global Precision Farming Software Industry Revenue billion Forecast, by Type 2020 & 2033
- Table 30: Global Precision Farming Software Industry Revenue billion Forecast, by Country 2020 & 2033
- Table 31: China Precision Farming Software Industry Revenue (billion) Forecast, by Application 2020 & 2033
- Table 32: Japan Precision Farming Software Industry Revenue (billion) Forecast, by Application 2020 & 2033
- Table 33: India Precision Farming Software Industry Revenue (billion) Forecast, by Application 2020 & 2033
- Table 34: Australia Precision Farming Software Industry Revenue (billion) Forecast, by Application 2020 & 2033
- Table 35: Rest of Asia Pacific Precision Farming Software Industry Revenue (billion) Forecast, by Application 2020 & 2033
- Table 36: Global Precision Farming Software Industry Revenue billion Forecast, by Application 2020 & 2033
- Table 37: Global Precision Farming Software Industry Revenue billion Forecast, by Type 2020 & 2033
- Table 38: Global Precision Farming Software Industry Revenue billion Forecast, by Application 2020 & 2033
- Table 39: Global Precision Farming Software Industry Revenue billion Forecast, by Type 2020 & 2033
- Table 40: Global Precision Farming Software Industry Revenue billion Forecast, by Country 2020 & 2033
- Table 41: Brazil Precision Farming Software Industry Revenue (billion) Forecast, by Application 2020 & 2033
- Table 42: Argentina Precision Farming Software Industry Revenue (billion) Forecast, by Application 2020 & 2033
- Table 43: Rest of South America Precision Farming Software Industry Revenue (billion) Forecast, by Application 2020 & 2033
- Table 44: Global Precision Farming Software Industry Revenue billion Forecast, by Application 2020 & 2033
- Table 45: Global Precision Farming Software Industry Revenue billion Forecast, by Type 2020 & 2033
- Table 46: Global Precision Farming Software Industry Revenue billion Forecast, by Application 2020 & 2033
- Table 47: Global Precision Farming Software Industry Revenue billion Forecast, by Type 2020 & 2033
- Table 48: Global Precision Farming Software Industry Revenue billion Forecast, by Country 2020 & 2033
- Table 49: South Africa Precision Farming Software Industry Revenue (billion) Forecast, by Application 2020 & 2033
- Table 50: Rest of Africa Precision Farming Software Industry Revenue (billion) Forecast, by Application 2020 & 2033
Frequently Asked Questions
1. What is the projected Compound Annual Growth Rate (CAGR) of the Precision Farming Software Industry?
The projected CAGR is approximately 13.9%.
2. Which companies are prominent players in the Precision Farming Software Industry?
Key companies in the market include Conservis Corporation, Raven Industries, AG Leader Technology, AG Junction, ClearAg Operations, Deere & Company, Fairport Farm Software, AG DNA, Topcon Positioning Systems, Trimble Inc, Bayer CropScience AG, Agribotix, Case IH Agriculture, Mapshots Inc, IBM, AGCO Corporation.
3. What are the main segments of the Precision Farming Software Industry?
The market segments include Application, Type, Application, Type.
4. Can you provide details about the market size?
The market size is estimated to be USD 2.7 billion as of 2022.
5. What are some drivers contributing to market growth?
Increasing Demand for Tomato; Adoption of Greenhouse Technology in Tomato Cultivation; Government support.
6. What are the notable trends driving market growth?
Farm Labor Shortage and Rise in Average Farm Size.
7. Are there any restraints impacting market growth?
Increasing Loses due to Physiological Disorder. Pest and Disease; Unfavourable Climatic Condition.
8. Can you provide examples of recent developments in the market?
N/A
9. What pricing options are available for accessing the report?
Pricing options include single-user, multi-user, and enterprise licenses priced at USD 4750, USD 5250, and USD 8750 respectively.
10. Is the market size provided in terms of value or volume?
The market size is provided in terms of value, measured in billion.
11. Are there any specific market keywords associated with the report?
Yes, the market keyword associated with the report is "Precision Farming Software Industry," which aids in identifying and referencing the specific market segment covered.
12. How do I determine which pricing option suits my needs best?
The pricing options vary based on user requirements and access needs. Individual users may opt for single-user licenses, while businesses requiring broader access may choose multi-user or enterprise licenses for cost-effective access to the report.
13. Are there any additional resources or data provided in the Precision Farming Software Industry report?
While the report offers comprehensive insights, it's advisable to review the specific contents or supplementary materials provided to ascertain if additional resources or data are available.
14. How can I stay updated on further developments or reports in the Precision Farming Software Industry?
To stay informed about further developments, trends, and reports in the Precision Farming Software Industry, consider subscribing to industry newsletters, following relevant companies and organizations, or regularly checking reputable industry news sources and publications.
Methodology
Step 1 - Identification of Relevant Samples Size from Population Database


Step 2 - Approaches for Defining Global Market Size (Value, Volume* & Price*)

Note*: In applicable scenarios
Step 3 - Data Sources
Primary Research
- Web Analytics
- Survey Reports
- Research Institute
- Latest Research Reports
- Opinion Leaders
Secondary Research
- Annual Reports
- White Paper
- Latest Press Release
- Industry Association
- Paid Database
- Investor Presentations

Step 4 - Data Triangulation
Involves using different sources of information in order to increase the validity of a study
These sources are likely to be stakeholders in a program - participants, other researchers, program staff, other community members, and so on.
Then we put all data in single framework & apply various statistical tools to find out the dynamic on the market.
During the analysis stage, feedback from the stakeholder groups would be compared to determine areas of agreement as well as areas of divergence