

Key Insights
The global prepreg market, estimated at $13.2 billion in 2024, is poised for significant expansion, projecting a compound annual growth rate (CAGR) of 6.92% from 2024 to 2033. This robust growth is underpinned by increasing demand from key sectors. The aerospace and defense industry's need for advanced, lightweight, high-strength composite materials is a primary driver. Furthermore, the automotive sector's focus on fuel efficiency and enhanced safety is accelerating the adoption of prepregs in components like body panels and structural elements. The renewable energy sector, especially wind turbine manufacturing, presents a substantial opportunity as prepregs are vital for producing larger, more efficient turbine blades. Continuous technological innovation in resin and fiber formulations, yielding superior strength-to-weight ratios and enhanced durability, also fuels market expansion. Despite potential challenges from raw material cost fluctuations and supply chain volatility, the market outlook remains strongly positive.
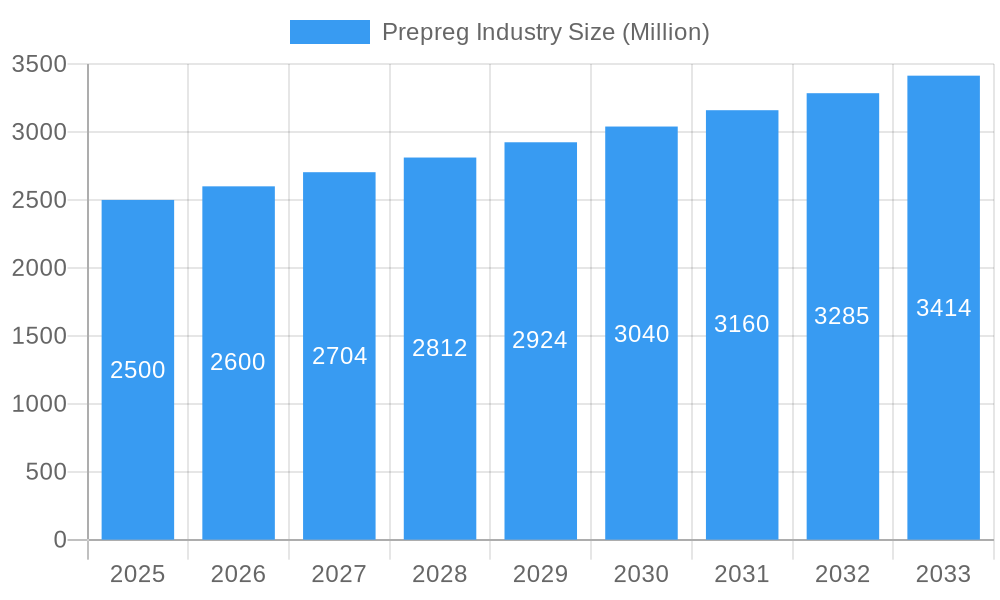
Prepreg Industry Market Size (In Billion)
Market segmentation highlights diverse growth patterns across resin and fiber types, and end-use applications. Thermoset resins currently lead, but thermoplastic resins are anticipated to grow at a faster pace, driven by their recyclability and specialized performance benefits. Among fiber types, carbon fiber prepregs, despite a higher cost, are projected to outpace glass and aramid fiber prepregs due to their exceptional strength and stiffness. Geographically, the Asia-Pacific region, led by China and India, is expected to dominate market growth, supported by rapid industrialization and infrastructure development. North America and Europe remain crucial markets, supported by mature aerospace and automotive industries. The competitive landscape features a mix of large-scale international players and niche manufacturers, indicating a dynamic market ripe for innovation and strategic consolidation.
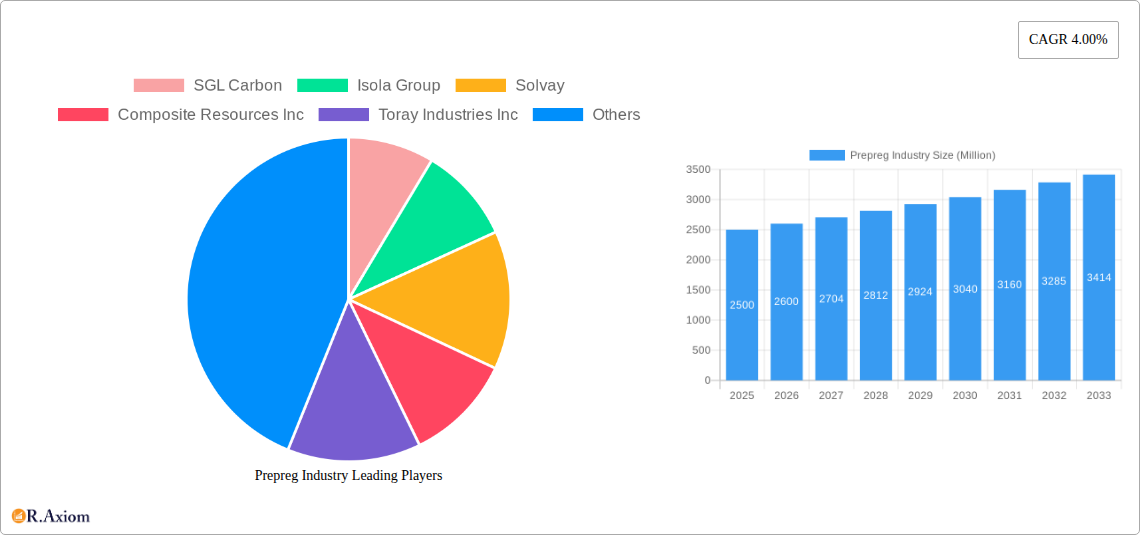
Prepreg Industry Company Market Share
Prepreg Industry Market Report: 2019-2033
This comprehensive report provides an in-depth analysis of the global prepreg market, offering valuable insights for industry stakeholders, investors, and strategic decision-makers. The study covers the period from 2019 to 2033, with 2025 serving as the base and estimated year. The report meticulously analyzes market dynamics, segmentation, leading players, and future growth prospects, presenting a detailed forecast for 2025-2033. The market is valued at xx Million in 2025 and is projected to reach xx Million by 2033, exhibiting a CAGR of xx% during the forecast period.
Prepreg Industry Market Concentration & Innovation
The prepreg market exhibits a moderately concentrated landscape, with several major players holding significant market share. Key players like SGL Carbon, Isola Group, Solvay, Toray Industries Inc, and Hexcel Corporation collectively account for approximately xx% of the global market share in 2025. However, the presence of numerous smaller, specialized players fosters competition and innovation.
Market innovation is driven by advancements in resin and fiber technologies, particularly the development of high-performance materials for aerospace and automotive applications. Stringent regulatory frameworks regarding environmental sustainability and safety are pushing companies to develop eco-friendly prepreg solutions. The emergence of alternative materials presents both challenges and opportunities; however, prepreg's superior properties in strength, lightweight, and design flexibility continue to maintain its competitive edge.
M&A activities have played a crucial role in shaping the market landscape, with several significant deals exceeding xx Million in value during the historical period (2019-2024). These acquisitions have primarily focused on expanding product portfolios, geographical reach, and technological capabilities. Further consolidation is expected during the forecast period. End-user trends, particularly the increasing adoption of composites in high-growth sectors like wind energy and electric vehicles, are major growth drivers.
- Market Concentration: xx% controlled by top 5 players in 2025.
- Innovation Drivers: Advanced materials, sustainability regulations, alternative material competition.
- M&A Activity: Significant deals exceeding xx Million during 2019-2024.
- End-User Trends: Growth in wind energy, electric vehicles, and aerospace driving demand.
Prepreg Industry Industry Trends & Insights
The prepreg market is experiencing robust growth, primarily fueled by the increasing demand for lightweight and high-strength materials across various end-user industries. The automotive sector, driven by fuel efficiency regulations and the rise of electric vehicles, is a major contributor to market expansion. The aerospace and defense industry's continuous pursuit of improved aircraft performance further boosts demand. Technological disruptions such as the development of advanced fiber types (e.g., carbon nanotubes) and high-performance resins are expanding application possibilities and enhancing prepreg properties.
Consumer preferences for sustainable and environmentally friendly products are influencing the development of bio-based resins and recycled fiber-reinforced composites. Competitive dynamics are characterized by intense rivalry among established players and the emergence of new entrants specializing in niche applications. This leads to continuous innovation and improvements in material properties, processing techniques, and cost-effectiveness. The market exhibits a strong growth trajectory, with a projected CAGR of xx% from 2025 to 2033. Market penetration in specific end-user segments, such as wind energy, is expected to increase significantly due to government support and the urgent need for renewable energy sources.
Dominant Markets & Segments in Prepreg Industry
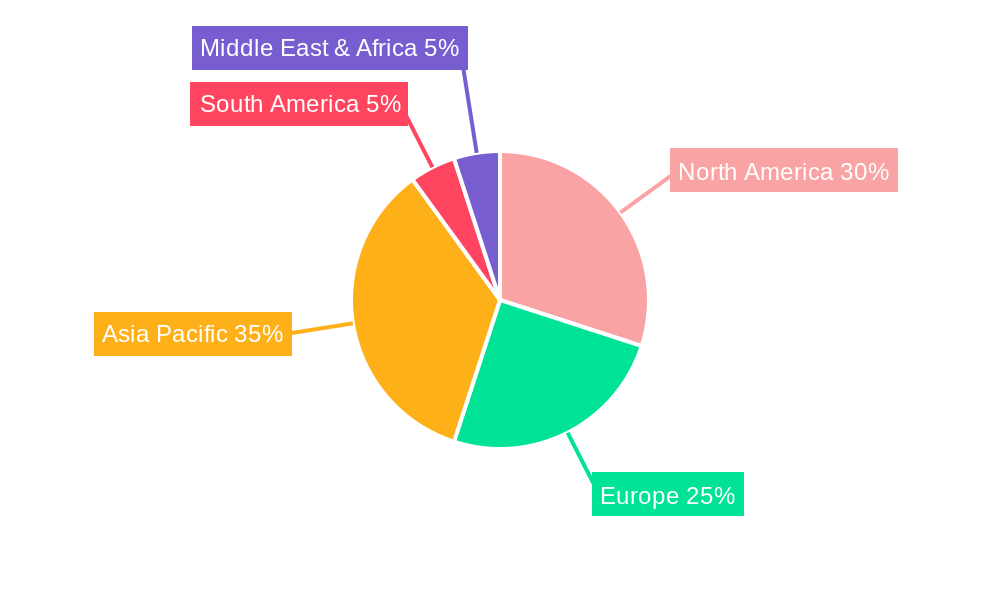
The North American region currently holds the largest market share in the prepreg industry, driven by robust aerospace and automotive sectors. However, Asia-Pacific is projected to experience the fastest growth during the forecast period, propelled by rapid industrialization and significant investments in infrastructure development, particularly in countries like China and India.
- Leading Region: North America (2025)
- Fastest-Growing Region: Asia-Pacific (2025-2033)
- Dominant Resin Type: Thermoset (higher market share due to established applications and mature technology)
- Dominant Fiber Type: Carbon Fiber (superior properties for high-performance applications)
- Dominant End-User Industry: Aerospace & Defense (high demand for lightweight and high-strength materials)
Key Drivers for Dominant Segments:
- Aerospace & Defense: Stringent lightweighting requirements, high performance needs.
- Automotive: Fuel efficiency regulations, electric vehicle adoption.
- Wind Energy: Growth in renewable energy infrastructure development.
- Carbon Fiber: Superior strength-to-weight ratio, high stiffness.
- Thermoset Resins: Maturity of technology, cost-effectiveness for large-scale applications.
Prepreg Industry Product Developments
Recent product innovations focus on developing prepregs with enhanced mechanical properties, improved processability, and reduced environmental impact. This includes the introduction of high-temperature resistant prepregs, lightweight prepregs with superior impact resistance, and prepregs incorporating recycled materials. These advancements cater to specific end-user needs, offering competitive advantages in terms of performance, cost, and sustainability. Technological trends are geared toward creating tailored prepreg solutions for niche applications, pushing the boundaries of composite material performance.
Report Scope & Segmentation Analysis
This report segments the prepreg market based on resin type (thermoset, thermoplastic), fiber type (carbon, glass, aramid), and end-user industry (aerospace & defense, automotive, electrical & electronics, wind turbine, leisure, others). Each segment's market size, growth projections, and competitive landscape are analyzed in detail. The thermoset resin segment currently holds a larger market share compared to thermoplastic, driven by its widespread use in existing applications. Carbon fiber dominates the fiber type segment due to its superior properties. Aerospace and defense remain a key end-user industry, showcasing strong growth potential.
Key Drivers of Prepreg Industry Growth
The prepreg market's growth is propelled by several factors: the increasing demand for lightweight and high-strength materials in various industries, technological advancements leading to enhanced material properties, supportive government policies promoting renewable energy and sustainable manufacturing, and rising investments in infrastructure development globally. These factors collectively contribute to the substantial expansion of the prepreg market.
Challenges in the Prepreg Industry Sector
The prepreg industry faces challenges including the volatility of raw material prices, the complexity of manufacturing processes, and intense competition among numerous players. Stringent environmental regulations and the need for sustainable manufacturing practices add to operational costs. Supply chain disruptions can significantly impact production and availability, affecting market stability.
Emerging Opportunities in Prepreg Industry
Emerging opportunities lie in developing bio-based resins, expanding into new applications (e.g., 3D printing), and focusing on customized prepreg solutions for specific end-user needs. The growing demand for sustainable and eco-friendly materials presents a significant opportunity for innovation and market penetration. Further market expansion is expected in developing economies with expanding industrial sectors.
Leading Players in the Prepreg Industry Market
- SGL Carbon
- Isola Group
- Solvay
- Composite Resources Inc
- Toray Industries Inc
- Sunrez Corporation
- Ventec International Group
- Axiom Materials
- Yokohama Aerospace America Inc
- Renegade Materials Corporation
- Park Eletrochemical Corp
- Mitsubishi Chemical Carbon Fiber and Composites Inc
- Hexcel Corporation
- Koninklijke Ten Cate BV
- Gurit
- TEIJIN LIMITED
- Zoltek
Key Developments in Prepreg Industry Industry
- 2022 Q4: Hexcel Corporation announces a significant investment in expanding its carbon fiber production capacity.
- 2023 Q1: Toray Industries Inc. launches a new high-performance prepreg for aerospace applications.
- 2023 Q2: A major merger between two prepreg manufacturers is announced, consolidating market share.
- (Add further developments with specific dates as available)
Strategic Outlook for Prepreg Industry Market
The prepreg market presents a promising future, driven by continued innovation, expanding applications, and the growth of key end-user industries. Focus on sustainable and high-performance materials will be crucial for success. The market is poised for significant expansion, with growth catalysts including technological advancements, government support for renewable energy, and increasing demand for lightweight and durable composite materials across various sectors.
Prepreg Industry Segmentation
-
1. Resin Type
- 1.1. Thermoset
- 1.2. Thermoplastic
-
2. Fiber Type
- 2.1. Carbon
- 2.2. Glass
- 2.3. Aramid
-
3. End-user Industry
- 3.1. Aerospace and Defense
- 3.2. Automotive
- 3.3. Electrical and Electronics
- 3.4. Wind Turbine
- 3.5. Leisure
- 3.6. Other End-user Industries
Prepreg Industry Segmentation By Geography
-
1. Asia Pacific
- 1.1. China
- 1.2. India
- 1.3. Japan
- 1.4. South Korea
- 1.5. Rest of Asia Pacific
-
2. North America
- 2.1. United States
- 2.2. Canada
- 2.3. Mexico
-
3. Europe
- 3.1. Germany
- 3.2. United Kingdom
- 3.3. Italy
- 3.4. France
- 3.5. Rest of Europe
-
4. South America
- 4.1. Brazil
- 4.2. Argentina
- 4.3. Rest of South America
- 5. Middle East
-
6. Saudi Arabia
- 6.1. South Africa
- 6.2. Rest of Middle East
Prepreg Industry Regional Market Share
Geographic Coverage of Prepreg Industry
Prepreg Industry REPORT HIGHLIGHTS
| Aspects | Details |
|---|---|
| Study Period | 2020-2034 |
| Base Year | 2025 |
| Estimated Year | 2026 |
| Forecast Period | 2026-2034 |
| Historical Period | 2020-2025 |
| Growth Rate | CAGR of 6.92% from 2020-2034 |
| Segmentation |
|
Table of Contents
- 1. Introduction
- 1.1. Research Scope
- 1.2. Market Segmentation
- 1.3. Research Objective
- 1.4. Definitions and Assumptions
- 2. Executive Summary
- 2.1. Market Snapshot
- 3. Market Dynamics
- 3.1. Market Drivers
- 3.2. Market Restrains
- 3.3. Market Trends
- 3.4. Market Opportunities
- 4. Market Factor Analysis
- 4.1. Porters Five Forces
- 4.1.1. Bargaining Power of Suppliers
- 4.1.2. Bargaining Power of Buyers
- 4.1.3. Threat of New Entrants
- 4.1.4. Threat of Substitutes
- 4.1.5. Competitive Rivalry
- 4.2. PESTEL analysis
- 4.3. BCG Analysis
- 4.3.1. Stars (High Growth, High Market Share)
- 4.3.2. Cash Cows (Low Growth, High Market Share)
- 4.3.3. Question Mark (High Growth, Low Market Share)
- 4.3.4. Dogs (Low Growth, Low Market Share)
- 4.4. Ansoff Matrix Analysis
- 4.5. Supply Chain Analysis
- 4.6. Regulatory Landscape
- 4.7. Current Market Potential and Opportunity Assessment (TAM–SAM–SOM Framework)
- 4.8. RAX Analyst Note
- 4.1. Porters Five Forces
- 5. Market Analysis, Insights and Forecast 2021-2033
- 5.1. Market Analysis, Insights and Forecast - by Resin Type
- 5.1.1. Thermoset
- 5.1.2. Thermoplastic
- 5.2. Market Analysis, Insights and Forecast - by Fiber Type
- 5.2.1. Carbon
- 5.2.2. Glass
- 5.2.3. Aramid
- 5.3. Market Analysis, Insights and Forecast - by End-user Industry
- 5.3.1. Aerospace and Defense
- 5.3.2. Automotive
- 5.3.3. Electrical and Electronics
- 5.3.4. Wind Turbine
- 5.3.5. Leisure
- 5.3.6. Other End-user Industries
- 5.4. Market Analysis, Insights and Forecast - by Region
- 5.4.1. Asia Pacific
- 5.4.2. North America
- 5.4.3. Europe
- 5.4.4. South America
- 5.4.5. Middle East
- 5.4.6. Saudi Arabia
- 5.1. Market Analysis, Insights and Forecast - by Resin Type
- 6. Global Prepreg Industry Analysis, Insights and Forecast, 2021-2033
- 6.1. Market Analysis, Insights and Forecast - by Resin Type
- 6.1.1. Thermoset
- 6.1.2. Thermoplastic
- 6.2. Market Analysis, Insights and Forecast - by Fiber Type
- 6.2.1. Carbon
- 6.2.2. Glass
- 6.2.3. Aramid
- 6.3. Market Analysis, Insights and Forecast - by End-user Industry
- 6.3.1. Aerospace and Defense
- 6.3.2. Automotive
- 6.3.3. Electrical and Electronics
- 6.3.4. Wind Turbine
- 6.3.5. Leisure
- 6.3.6. Other End-user Industries
- 6.1. Market Analysis, Insights and Forecast - by Resin Type
- 7. Asia Pacific Prepreg Industry Analysis, Insights and Forecast, 2020-2032
- 7.1. Market Analysis, Insights and Forecast - by Resin Type
- 7.1.1. Thermoset
- 7.1.2. Thermoplastic
- 7.2. Market Analysis, Insights and Forecast - by Fiber Type
- 7.2.1. Carbon
- 7.2.2. Glass
- 7.2.3. Aramid
- 7.3. Market Analysis, Insights and Forecast - by End-user Industry
- 7.3.1. Aerospace and Defense
- 7.3.2. Automotive
- 7.3.3. Electrical and Electronics
- 7.3.4. Wind Turbine
- 7.3.5. Leisure
- 7.3.6. Other End-user Industries
- 7.1. Market Analysis, Insights and Forecast - by Resin Type
- 8. North America Prepreg Industry Analysis, Insights and Forecast, 2020-2032
- 8.1. Market Analysis, Insights and Forecast - by Resin Type
- 8.1.1. Thermoset
- 8.1.2. Thermoplastic
- 8.2. Market Analysis, Insights and Forecast - by Fiber Type
- 8.2.1. Carbon
- 8.2.2. Glass
- 8.2.3. Aramid
- 8.3. Market Analysis, Insights and Forecast - by End-user Industry
- 8.3.1. Aerospace and Defense
- 8.3.2. Automotive
- 8.3.3. Electrical and Electronics
- 8.3.4. Wind Turbine
- 8.3.5. Leisure
- 8.3.6. Other End-user Industries
- 8.1. Market Analysis, Insights and Forecast - by Resin Type
- 9. Europe Prepreg Industry Analysis, Insights and Forecast, 2020-2032
- 9.1. Market Analysis, Insights and Forecast - by Resin Type
- 9.1.1. Thermoset
- 9.1.2. Thermoplastic
- 9.2. Market Analysis, Insights and Forecast - by Fiber Type
- 9.2.1. Carbon
- 9.2.2. Glass
- 9.2.3. Aramid
- 9.3. Market Analysis, Insights and Forecast - by End-user Industry
- 9.3.1. Aerospace and Defense
- 9.3.2. Automotive
- 9.3.3. Electrical and Electronics
- 9.3.4. Wind Turbine
- 9.3.5. Leisure
- 9.3.6. Other End-user Industries
- 9.1. Market Analysis, Insights and Forecast - by Resin Type
- 10. South America Prepreg Industry Analysis, Insights and Forecast, 2020-2032
- 10.1. Market Analysis, Insights and Forecast - by Resin Type
- 10.1.1. Thermoset
- 10.1.2. Thermoplastic
- 10.2. Market Analysis, Insights and Forecast - by Fiber Type
- 10.2.1. Carbon
- 10.2.2. Glass
- 10.2.3. Aramid
- 10.3. Market Analysis, Insights and Forecast - by End-user Industry
- 10.3.1. Aerospace and Defense
- 10.3.2. Automotive
- 10.3.3. Electrical and Electronics
- 10.3.4. Wind Turbine
- 10.3.5. Leisure
- 10.3.6. Other End-user Industries
- 10.1. Market Analysis, Insights and Forecast - by Resin Type
- 11. Middle East Prepreg Industry Analysis, Insights and Forecast, 2020-2032
- 11.1. Market Analysis, Insights and Forecast - by Resin Type
- 11.1.1. Thermoset
- 11.1.2. Thermoplastic
- 11.2. Market Analysis, Insights and Forecast - by Fiber Type
- 11.2.1. Carbon
- 11.2.2. Glass
- 11.2.3. Aramid
- 11.3. Market Analysis, Insights and Forecast - by End-user Industry
- 11.3.1. Aerospace and Defense
- 11.3.2. Automotive
- 11.3.3. Electrical and Electronics
- 11.3.4. Wind Turbine
- 11.3.5. Leisure
- 11.3.6. Other End-user Industries
- 11.1. Market Analysis, Insights and Forecast - by Resin Type
- 12. Saudi Arabia Prepreg Industry Analysis, Insights and Forecast, 2020-2032
- 12.1. Market Analysis, Insights and Forecast - by Resin Type
- 12.1.1. Thermoset
- 12.1.2. Thermoplastic
- 12.2. Market Analysis, Insights and Forecast - by Fiber Type
- 12.2.1. Carbon
- 12.2.2. Glass
- 12.2.3. Aramid
- 12.3. Market Analysis, Insights and Forecast - by End-user Industry
- 12.3.1. Aerospace and Defense
- 12.3.2. Automotive
- 12.3.3. Electrical and Electronics
- 12.3.4. Wind Turbine
- 12.3.5. Leisure
- 12.3.6. Other End-user Industries
- 12.1. Market Analysis, Insights and Forecast - by Resin Type
- 13. Competitive Analysis
- 13.1. Company Profiles
- 13.1.1 SGL Carbon
- 13.1.1.1. Company Overview
- 13.1.1.2. Products
- 13.1.1.3. Company Financials
- 13.1.1.4. SWOT Analysis
- 13.1.2 Isola Group
- 13.1.2.1. Company Overview
- 13.1.2.2. Products
- 13.1.2.3. Company Financials
- 13.1.2.4. SWOT Analysis
- 13.1.3 Solvay
- 13.1.3.1. Company Overview
- 13.1.3.2. Products
- 13.1.3.3. Company Financials
- 13.1.3.4. SWOT Analysis
- 13.1.4 Composite Resources Inc
- 13.1.4.1. Company Overview
- 13.1.4.2. Products
- 13.1.4.3. Company Financials
- 13.1.4.4. SWOT Analysis
- 13.1.5 Toray Industries Inc
- 13.1.5.1. Company Overview
- 13.1.5.2. Products
- 13.1.5.3. Company Financials
- 13.1.5.4. SWOT Analysis
- 13.1.6 Sunrez Corporation
- 13.1.6.1. Company Overview
- 13.1.6.2. Products
- 13.1.6.3. Company Financials
- 13.1.6.4. SWOT Analysis
- 13.1.7 Ventec International Group
- 13.1.7.1. Company Overview
- 13.1.7.2. Products
- 13.1.7.3. Company Financials
- 13.1.7.4. SWOT Analysis
- 13.1.8 Axiom Materials
- 13.1.8.1. Company Overview
- 13.1.8.2. Products
- 13.1.8.3. Company Financials
- 13.1.8.4. SWOT Analysis
- 13.1.9 Yokohama Aerospace America Inc
- 13.1.9.1. Company Overview
- 13.1.9.2. Products
- 13.1.9.3. Company Financials
- 13.1.9.4. SWOT Analysis
- 13.1.10 Renegade Materials Corporation
- 13.1.10.1. Company Overview
- 13.1.10.2. Products
- 13.1.10.3. Company Financials
- 13.1.10.4. SWOT Analysis
- 13.1.11 Park Eletrochemical Corp
- 13.1.11.1. Company Overview
- 13.1.11.2. Products
- 13.1.11.3. Company Financials
- 13.1.11.4. SWOT Analysis
- 13.1.12 Mitsubishi Chemical Carbon Fiber and Composites Inc
- 13.1.12.1. Company Overview
- 13.1.12.2. Products
- 13.1.12.3. Company Financials
- 13.1.12.4. SWOT Analysis
- 13.1.13 Hexcel Corporation
- 13.1.13.1. Company Overview
- 13.1.13.2. Products
- 13.1.13.3. Company Financials
- 13.1.13.4. SWOT Analysis
- 13.1.14 Koninklijke Ten Cate BV
- 13.1.14.1. Company Overview
- 13.1.14.2. Products
- 13.1.14.3. Company Financials
- 13.1.14.4. SWOT Analysis
- 13.1.15 Gurit
- 13.1.15.1. Company Overview
- 13.1.15.2. Products
- 13.1.15.3. Company Financials
- 13.1.15.4. SWOT Analysis
- 13.1.16 TEIJIN LIMITED
- 13.1.16.1. Company Overview
- 13.1.16.2. Products
- 13.1.16.3. Company Financials
- 13.1.16.4. SWOT Analysis
- 13.1.17 Zoltek*List Not Exhaustive
- 13.1.17.1. Company Overview
- 13.1.17.2. Products
- 13.1.17.3. Company Financials
- 13.1.17.4. SWOT Analysis
- 13.1.1 SGL Carbon
- 13.2. Market Entropy
- 13.2.1 Company's Key Areas Served
- 13.2.2 Recent Developments
- 13.3. Company Market Share Analysis 2025
- 13.3.1 Top 5 Companies Market Share Analysis
- 13.3.2 Top 3 Companies Market Share Analysis
- 13.4. List of Potential Customers
- 14. Research Methodology
List of Figures
- Figure 1: Global Prepreg Industry Revenue Breakdown (billion, %) by Region 2025 & 2033
- Figure 2: Global Prepreg Industry Volume Breakdown (K Tons, %) by Region 2025 & 2033
- Figure 3: Asia Pacific Prepreg Industry Revenue (billion), by Resin Type 2025 & 2033
- Figure 4: Asia Pacific Prepreg Industry Volume (K Tons), by Resin Type 2025 & 2033
- Figure 5: Asia Pacific Prepreg Industry Revenue Share (%), by Resin Type 2025 & 2033
- Figure 6: Asia Pacific Prepreg Industry Volume Share (%), by Resin Type 2025 & 2033
- Figure 7: Asia Pacific Prepreg Industry Revenue (billion), by Fiber Type 2025 & 2033
- Figure 8: Asia Pacific Prepreg Industry Volume (K Tons), by Fiber Type 2025 & 2033
- Figure 9: Asia Pacific Prepreg Industry Revenue Share (%), by Fiber Type 2025 & 2033
- Figure 10: Asia Pacific Prepreg Industry Volume Share (%), by Fiber Type 2025 & 2033
- Figure 11: Asia Pacific Prepreg Industry Revenue (billion), by End-user Industry 2025 & 2033
- Figure 12: Asia Pacific Prepreg Industry Volume (K Tons), by End-user Industry 2025 & 2033
- Figure 13: Asia Pacific Prepreg Industry Revenue Share (%), by End-user Industry 2025 & 2033
- Figure 14: Asia Pacific Prepreg Industry Volume Share (%), by End-user Industry 2025 & 2033
- Figure 15: Asia Pacific Prepreg Industry Revenue (billion), by Country 2025 & 2033
- Figure 16: Asia Pacific Prepreg Industry Volume (K Tons), by Country 2025 & 2033
- Figure 17: Asia Pacific Prepreg Industry Revenue Share (%), by Country 2025 & 2033
- Figure 18: Asia Pacific Prepreg Industry Volume Share (%), by Country 2025 & 2033
- Figure 19: North America Prepreg Industry Revenue (billion), by Resin Type 2025 & 2033
- Figure 20: North America Prepreg Industry Volume (K Tons), by Resin Type 2025 & 2033
- Figure 21: North America Prepreg Industry Revenue Share (%), by Resin Type 2025 & 2033
- Figure 22: North America Prepreg Industry Volume Share (%), by Resin Type 2025 & 2033
- Figure 23: North America Prepreg Industry Revenue (billion), by Fiber Type 2025 & 2033
- Figure 24: North America Prepreg Industry Volume (K Tons), by Fiber Type 2025 & 2033
- Figure 25: North America Prepreg Industry Revenue Share (%), by Fiber Type 2025 & 2033
- Figure 26: North America Prepreg Industry Volume Share (%), by Fiber Type 2025 & 2033
- Figure 27: North America Prepreg Industry Revenue (billion), by End-user Industry 2025 & 2033
- Figure 28: North America Prepreg Industry Volume (K Tons), by End-user Industry 2025 & 2033
- Figure 29: North America Prepreg Industry Revenue Share (%), by End-user Industry 2025 & 2033
- Figure 30: North America Prepreg Industry Volume Share (%), by End-user Industry 2025 & 2033
- Figure 31: North America Prepreg Industry Revenue (billion), by Country 2025 & 2033
- Figure 32: North America Prepreg Industry Volume (K Tons), by Country 2025 & 2033
- Figure 33: North America Prepreg Industry Revenue Share (%), by Country 2025 & 2033
- Figure 34: North America Prepreg Industry Volume Share (%), by Country 2025 & 2033
- Figure 35: Europe Prepreg Industry Revenue (billion), by Resin Type 2025 & 2033
- Figure 36: Europe Prepreg Industry Volume (K Tons), by Resin Type 2025 & 2033
- Figure 37: Europe Prepreg Industry Revenue Share (%), by Resin Type 2025 & 2033
- Figure 38: Europe Prepreg Industry Volume Share (%), by Resin Type 2025 & 2033
- Figure 39: Europe Prepreg Industry Revenue (billion), by Fiber Type 2025 & 2033
- Figure 40: Europe Prepreg Industry Volume (K Tons), by Fiber Type 2025 & 2033
- Figure 41: Europe Prepreg Industry Revenue Share (%), by Fiber Type 2025 & 2033
- Figure 42: Europe Prepreg Industry Volume Share (%), by Fiber Type 2025 & 2033
- Figure 43: Europe Prepreg Industry Revenue (billion), by End-user Industry 2025 & 2033
- Figure 44: Europe Prepreg Industry Volume (K Tons), by End-user Industry 2025 & 2033
- Figure 45: Europe Prepreg Industry Revenue Share (%), by End-user Industry 2025 & 2033
- Figure 46: Europe Prepreg Industry Volume Share (%), by End-user Industry 2025 & 2033
- Figure 47: Europe Prepreg Industry Revenue (billion), by Country 2025 & 2033
- Figure 48: Europe Prepreg Industry Volume (K Tons), by Country 2025 & 2033
- Figure 49: Europe Prepreg Industry Revenue Share (%), by Country 2025 & 2033
- Figure 50: Europe Prepreg Industry Volume Share (%), by Country 2025 & 2033
- Figure 51: South America Prepreg Industry Revenue (billion), by Resin Type 2025 & 2033
- Figure 52: South America Prepreg Industry Volume (K Tons), by Resin Type 2025 & 2033
- Figure 53: South America Prepreg Industry Revenue Share (%), by Resin Type 2025 & 2033
- Figure 54: South America Prepreg Industry Volume Share (%), by Resin Type 2025 & 2033
- Figure 55: South America Prepreg Industry Revenue (billion), by Fiber Type 2025 & 2033
- Figure 56: South America Prepreg Industry Volume (K Tons), by Fiber Type 2025 & 2033
- Figure 57: South America Prepreg Industry Revenue Share (%), by Fiber Type 2025 & 2033
- Figure 58: South America Prepreg Industry Volume Share (%), by Fiber Type 2025 & 2033
- Figure 59: South America Prepreg Industry Revenue (billion), by End-user Industry 2025 & 2033
- Figure 60: South America Prepreg Industry Volume (K Tons), by End-user Industry 2025 & 2033
- Figure 61: South America Prepreg Industry Revenue Share (%), by End-user Industry 2025 & 2033
- Figure 62: South America Prepreg Industry Volume Share (%), by End-user Industry 2025 & 2033
- Figure 63: South America Prepreg Industry Revenue (billion), by Country 2025 & 2033
- Figure 64: South America Prepreg Industry Volume (K Tons), by Country 2025 & 2033
- Figure 65: South America Prepreg Industry Revenue Share (%), by Country 2025 & 2033
- Figure 66: South America Prepreg Industry Volume Share (%), by Country 2025 & 2033
- Figure 67: Middle East Prepreg Industry Revenue (billion), by Resin Type 2025 & 2033
- Figure 68: Middle East Prepreg Industry Volume (K Tons), by Resin Type 2025 & 2033
- Figure 69: Middle East Prepreg Industry Revenue Share (%), by Resin Type 2025 & 2033
- Figure 70: Middle East Prepreg Industry Volume Share (%), by Resin Type 2025 & 2033
- Figure 71: Middle East Prepreg Industry Revenue (billion), by Fiber Type 2025 & 2033
- Figure 72: Middle East Prepreg Industry Volume (K Tons), by Fiber Type 2025 & 2033
- Figure 73: Middle East Prepreg Industry Revenue Share (%), by Fiber Type 2025 & 2033
- Figure 74: Middle East Prepreg Industry Volume Share (%), by Fiber Type 2025 & 2033
- Figure 75: Middle East Prepreg Industry Revenue (billion), by End-user Industry 2025 & 2033
- Figure 76: Middle East Prepreg Industry Volume (K Tons), by End-user Industry 2025 & 2033
- Figure 77: Middle East Prepreg Industry Revenue Share (%), by End-user Industry 2025 & 2033
- Figure 78: Middle East Prepreg Industry Volume Share (%), by End-user Industry 2025 & 2033
- Figure 79: Middle East Prepreg Industry Revenue (billion), by Country 2025 & 2033
- Figure 80: Middle East Prepreg Industry Volume (K Tons), by Country 2025 & 2033
- Figure 81: Middle East Prepreg Industry Revenue Share (%), by Country 2025 & 2033
- Figure 82: Middle East Prepreg Industry Volume Share (%), by Country 2025 & 2033
- Figure 83: Saudi Arabia Prepreg Industry Revenue (billion), by Resin Type 2025 & 2033
- Figure 84: Saudi Arabia Prepreg Industry Volume (K Tons), by Resin Type 2025 & 2033
- Figure 85: Saudi Arabia Prepreg Industry Revenue Share (%), by Resin Type 2025 & 2033
- Figure 86: Saudi Arabia Prepreg Industry Volume Share (%), by Resin Type 2025 & 2033
- Figure 87: Saudi Arabia Prepreg Industry Revenue (billion), by Fiber Type 2025 & 2033
- Figure 88: Saudi Arabia Prepreg Industry Volume (K Tons), by Fiber Type 2025 & 2033
- Figure 89: Saudi Arabia Prepreg Industry Revenue Share (%), by Fiber Type 2025 & 2033
- Figure 90: Saudi Arabia Prepreg Industry Volume Share (%), by Fiber Type 2025 & 2033
- Figure 91: Saudi Arabia Prepreg Industry Revenue (billion), by End-user Industry 2025 & 2033
- Figure 92: Saudi Arabia Prepreg Industry Volume (K Tons), by End-user Industry 2025 & 2033
- Figure 93: Saudi Arabia Prepreg Industry Revenue Share (%), by End-user Industry 2025 & 2033
- Figure 94: Saudi Arabia Prepreg Industry Volume Share (%), by End-user Industry 2025 & 2033
- Figure 95: Saudi Arabia Prepreg Industry Revenue (billion), by Country 2025 & 2033
- Figure 96: Saudi Arabia Prepreg Industry Volume (K Tons), by Country 2025 & 2033
- Figure 97: Saudi Arabia Prepreg Industry Revenue Share (%), by Country 2025 & 2033
- Figure 98: Saudi Arabia Prepreg Industry Volume Share (%), by Country 2025 & 2033
List of Tables
- Table 1: Global Prepreg Industry Revenue billion Forecast, by Resin Type 2020 & 2033
- Table 2: Global Prepreg Industry Volume K Tons Forecast, by Resin Type 2020 & 2033
- Table 3: Global Prepreg Industry Revenue billion Forecast, by Fiber Type 2020 & 2033
- Table 4: Global Prepreg Industry Volume K Tons Forecast, by Fiber Type 2020 & 2033
- Table 5: Global Prepreg Industry Revenue billion Forecast, by End-user Industry 2020 & 2033
- Table 6: Global Prepreg Industry Volume K Tons Forecast, by End-user Industry 2020 & 2033
- Table 7: Global Prepreg Industry Revenue billion Forecast, by Region 2020 & 2033
- Table 8: Global Prepreg Industry Volume K Tons Forecast, by Region 2020 & 2033
- Table 9: Global Prepreg Industry Revenue billion Forecast, by Resin Type 2020 & 2033
- Table 10: Global Prepreg Industry Volume K Tons Forecast, by Resin Type 2020 & 2033
- Table 11: Global Prepreg Industry Revenue billion Forecast, by Fiber Type 2020 & 2033
- Table 12: Global Prepreg Industry Volume K Tons Forecast, by Fiber Type 2020 & 2033
- Table 13: Global Prepreg Industry Revenue billion Forecast, by End-user Industry 2020 & 2033
- Table 14: Global Prepreg Industry Volume K Tons Forecast, by End-user Industry 2020 & 2033
- Table 15: Global Prepreg Industry Revenue billion Forecast, by Country 2020 & 2033
- Table 16: Global Prepreg Industry Volume K Tons Forecast, by Country 2020 & 2033
- Table 17: China Prepreg Industry Revenue (billion) Forecast, by Application 2020 & 2033
- Table 18: China Prepreg Industry Volume (K Tons) Forecast, by Application 2020 & 2033
- Table 19: India Prepreg Industry Revenue (billion) Forecast, by Application 2020 & 2033
- Table 20: India Prepreg Industry Volume (K Tons) Forecast, by Application 2020 & 2033
- Table 21: Japan Prepreg Industry Revenue (billion) Forecast, by Application 2020 & 2033
- Table 22: Japan Prepreg Industry Volume (K Tons) Forecast, by Application 2020 & 2033
- Table 23: South Korea Prepreg Industry Revenue (billion) Forecast, by Application 2020 & 2033
- Table 24: South Korea Prepreg Industry Volume (K Tons) Forecast, by Application 2020 & 2033
- Table 25: Rest of Asia Pacific Prepreg Industry Revenue (billion) Forecast, by Application 2020 & 2033
- Table 26: Rest of Asia Pacific Prepreg Industry Volume (K Tons) Forecast, by Application 2020 & 2033
- Table 27: Global Prepreg Industry Revenue billion Forecast, by Resin Type 2020 & 2033
- Table 28: Global Prepreg Industry Volume K Tons Forecast, by Resin Type 2020 & 2033
- Table 29: Global Prepreg Industry Revenue billion Forecast, by Fiber Type 2020 & 2033
- Table 30: Global Prepreg Industry Volume K Tons Forecast, by Fiber Type 2020 & 2033
- Table 31: Global Prepreg Industry Revenue billion Forecast, by End-user Industry 2020 & 2033
- Table 32: Global Prepreg Industry Volume K Tons Forecast, by End-user Industry 2020 & 2033
- Table 33: Global Prepreg Industry Revenue billion Forecast, by Country 2020 & 2033
- Table 34: Global Prepreg Industry Volume K Tons Forecast, by Country 2020 & 2033
- Table 35: United States Prepreg Industry Revenue (billion) Forecast, by Application 2020 & 2033
- Table 36: United States Prepreg Industry Volume (K Tons) Forecast, by Application 2020 & 2033
- Table 37: Canada Prepreg Industry Revenue (billion) Forecast, by Application 2020 & 2033
- Table 38: Canada Prepreg Industry Volume (K Tons) Forecast, by Application 2020 & 2033
- Table 39: Mexico Prepreg Industry Revenue (billion) Forecast, by Application 2020 & 2033
- Table 40: Mexico Prepreg Industry Volume (K Tons) Forecast, by Application 2020 & 2033
- Table 41: Global Prepreg Industry Revenue billion Forecast, by Resin Type 2020 & 2033
- Table 42: Global Prepreg Industry Volume K Tons Forecast, by Resin Type 2020 & 2033
- Table 43: Global Prepreg Industry Revenue billion Forecast, by Fiber Type 2020 & 2033
- Table 44: Global Prepreg Industry Volume K Tons Forecast, by Fiber Type 2020 & 2033
- Table 45: Global Prepreg Industry Revenue billion Forecast, by End-user Industry 2020 & 2033
- Table 46: Global Prepreg Industry Volume K Tons Forecast, by End-user Industry 2020 & 2033
- Table 47: Global Prepreg Industry Revenue billion Forecast, by Country 2020 & 2033
- Table 48: Global Prepreg Industry Volume K Tons Forecast, by Country 2020 & 2033
- Table 49: Germany Prepreg Industry Revenue (billion) Forecast, by Application 2020 & 2033
- Table 50: Germany Prepreg Industry Volume (K Tons) Forecast, by Application 2020 & 2033
- Table 51: United Kingdom Prepreg Industry Revenue (billion) Forecast, by Application 2020 & 2033
- Table 52: United Kingdom Prepreg Industry Volume (K Tons) Forecast, by Application 2020 & 2033
- Table 53: Italy Prepreg Industry Revenue (billion) Forecast, by Application 2020 & 2033
- Table 54: Italy Prepreg Industry Volume (K Tons) Forecast, by Application 2020 & 2033
- Table 55: France Prepreg Industry Revenue (billion) Forecast, by Application 2020 & 2033
- Table 56: France Prepreg Industry Volume (K Tons) Forecast, by Application 2020 & 2033
- Table 57: Rest of Europe Prepreg Industry Revenue (billion) Forecast, by Application 2020 & 2033
- Table 58: Rest of Europe Prepreg Industry Volume (K Tons) Forecast, by Application 2020 & 2033
- Table 59: Global Prepreg Industry Revenue billion Forecast, by Resin Type 2020 & 2033
- Table 60: Global Prepreg Industry Volume K Tons Forecast, by Resin Type 2020 & 2033
- Table 61: Global Prepreg Industry Revenue billion Forecast, by Fiber Type 2020 & 2033
- Table 62: Global Prepreg Industry Volume K Tons Forecast, by Fiber Type 2020 & 2033
- Table 63: Global Prepreg Industry Revenue billion Forecast, by End-user Industry 2020 & 2033
- Table 64: Global Prepreg Industry Volume K Tons Forecast, by End-user Industry 2020 & 2033
- Table 65: Global Prepreg Industry Revenue billion Forecast, by Country 2020 & 2033
- Table 66: Global Prepreg Industry Volume K Tons Forecast, by Country 2020 & 2033
- Table 67: Brazil Prepreg Industry Revenue (billion) Forecast, by Application 2020 & 2033
- Table 68: Brazil Prepreg Industry Volume (K Tons) Forecast, by Application 2020 & 2033
- Table 69: Argentina Prepreg Industry Revenue (billion) Forecast, by Application 2020 & 2033
- Table 70: Argentina Prepreg Industry Volume (K Tons) Forecast, by Application 2020 & 2033
- Table 71: Rest of South America Prepreg Industry Revenue (billion) Forecast, by Application 2020 & 2033
- Table 72: Rest of South America Prepreg Industry Volume (K Tons) Forecast, by Application 2020 & 2033
- Table 73: Global Prepreg Industry Revenue billion Forecast, by Resin Type 2020 & 2033
- Table 74: Global Prepreg Industry Volume K Tons Forecast, by Resin Type 2020 & 2033
- Table 75: Global Prepreg Industry Revenue billion Forecast, by Fiber Type 2020 & 2033
- Table 76: Global Prepreg Industry Volume K Tons Forecast, by Fiber Type 2020 & 2033
- Table 77: Global Prepreg Industry Revenue billion Forecast, by End-user Industry 2020 & 2033
- Table 78: Global Prepreg Industry Volume K Tons Forecast, by End-user Industry 2020 & 2033
- Table 79: Global Prepreg Industry Revenue billion Forecast, by Country 2020 & 2033
- Table 80: Global Prepreg Industry Volume K Tons Forecast, by Country 2020 & 2033
- Table 81: Global Prepreg Industry Revenue billion Forecast, by Resin Type 2020 & 2033
- Table 82: Global Prepreg Industry Volume K Tons Forecast, by Resin Type 2020 & 2033
- Table 83: Global Prepreg Industry Revenue billion Forecast, by Fiber Type 2020 & 2033
- Table 84: Global Prepreg Industry Volume K Tons Forecast, by Fiber Type 2020 & 2033
- Table 85: Global Prepreg Industry Revenue billion Forecast, by End-user Industry 2020 & 2033
- Table 86: Global Prepreg Industry Volume K Tons Forecast, by End-user Industry 2020 & 2033
- Table 87: Global Prepreg Industry Revenue billion Forecast, by Country 2020 & 2033
- Table 88: Global Prepreg Industry Volume K Tons Forecast, by Country 2020 & 2033
- Table 89: South Africa Prepreg Industry Revenue (billion) Forecast, by Application 2020 & 2033
- Table 90: South Africa Prepreg Industry Volume (K Tons) Forecast, by Application 2020 & 2033
- Table 91: Rest of Middle East Prepreg Industry Revenue (billion) Forecast, by Application 2020 & 2033
- Table 92: Rest of Middle East Prepreg Industry Volume (K Tons) Forecast, by Application 2020 & 2033
Frequently Asked Questions
1. What is the projected Compound Annual Growth Rate (CAGR) of the Prepreg Industry?
The projected CAGR is approximately 6.92%.
2. Which companies are prominent players in the Prepreg Industry?
Key companies in the market include SGL Carbon, Isola Group, Solvay, Composite Resources Inc, Toray Industries Inc, Sunrez Corporation, Ventec International Group, Axiom Materials, Yokohama Aerospace America Inc, Renegade Materials Corporation, Park Eletrochemical Corp, Mitsubishi Chemical Carbon Fiber and Composites Inc, Hexcel Corporation, Koninklijke Ten Cate BV, Gurit, TEIJIN LIMITED, Zoltek*List Not Exhaustive.
3. What are the main segments of the Prepreg Industry?
The market segments include Resin Type, Fiber Type, End-user Industry.
4. Can you provide details about the market size?
The market size is estimated to be USD 13.2 billion as of 2022.
5. What are some drivers contributing to market growth?
Growing Demand from the Aerospace and Defense Sector; Growing Demand from the Wind Sector; Increased Adoption of Carbon Prepreg.
6. What are the notable trends driving market growth?
Aerospace and Defense Industry to Drive the Market.
7. Are there any restraints impacting market growth?
Autoclave and Maintenance Constraints.
8. Can you provide examples of recent developments in the market?
N/A
9. What pricing options are available for accessing the report?
Pricing options include single-user, multi-user, and enterprise licenses priced at USD 4750, USD 5250, and USD 8750 respectively.
10. Is the market size provided in terms of value or volume?
The market size is provided in terms of value, measured in billion and volume, measured in K Tons.
11. Are there any specific market keywords associated with the report?
Yes, the market keyword associated with the report is "Prepreg Industry," which aids in identifying and referencing the specific market segment covered.
12. How do I determine which pricing option suits my needs best?
The pricing options vary based on user requirements and access needs. Individual users may opt for single-user licenses, while businesses requiring broader access may choose multi-user or enterprise licenses for cost-effective access to the report.
13. Are there any additional resources or data provided in the Prepreg Industry report?
While the report offers comprehensive insights, it's advisable to review the specific contents or supplementary materials provided to ascertain if additional resources or data are available.
14. How can I stay updated on further developments or reports in the Prepreg Industry?
To stay informed about further developments, trends, and reports in the Prepreg Industry, consider subscribing to industry newsletters, following relevant companies and organizations, or regularly checking reputable industry news sources and publications.
Methodology
Step 1 - Identification of Relevant Samples Size from Population Database


Step 2 - Approaches for Defining Global Market Size (Value, Volume* & Price*)

Note*: In applicable scenarios
Step 3 - Data Sources
Primary Research
- Web Analytics
- Survey Reports
- Research Institute
- Latest Research Reports
- Opinion Leaders
Secondary Research
- Annual Reports
- White Paper
- Latest Press Release
- Industry Association
- Paid Database
- Investor Presentations

Step 4 - Data Triangulation
Involves using different sources of information in order to increase the validity of a study
These sources are likely to be stakeholders in a program - participants, other researchers, program staff, other community members, and so on.
Then we put all data in single framework & apply various statistical tools to find out the dynamic on the market.
During the analysis stage, feedback from the stakeholder groups would be compared to determine areas of agreement as well as areas of divergence