

Key Insights
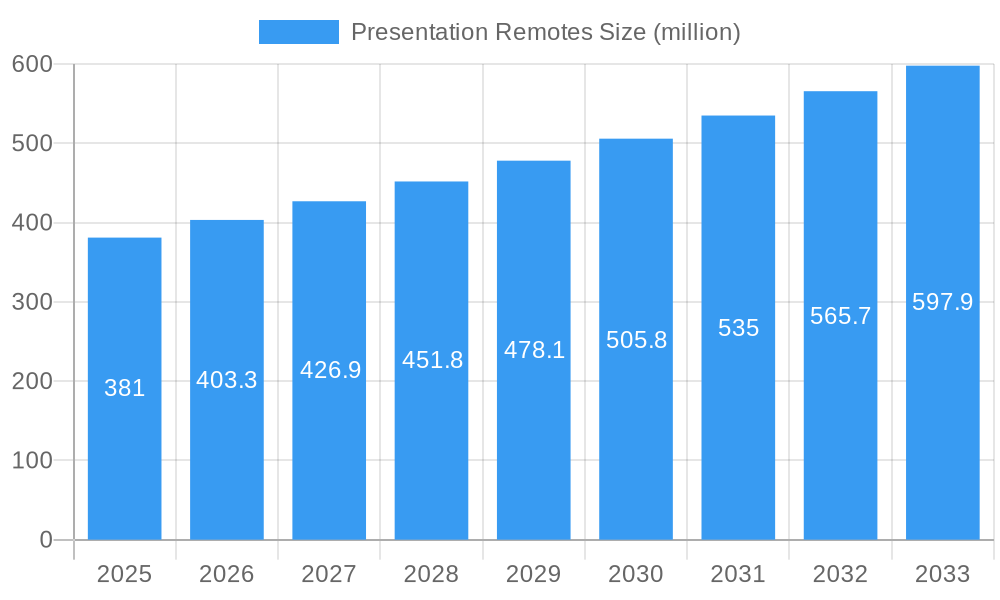
The presentation remote market, currently valued at $381 million in 2025, is projected to experience robust growth, driven by the increasing adoption of digital presentations across various sectors. The 5.6% Compound Annual Growth Rate (CAGR) indicates a steady expansion over the forecast period (2025-2033). Key drivers include the rising demand for enhanced user experience in presentations, the integration of advanced features such as laser pointers, page-turners, and even wireless connectivity with smartphones and tablets. The trend towards hybrid and remote work models further fuels this demand, as professionals seek seamless tools for engaging audiences regardless of location. While potential restraints like the increasing affordability and functionality of built-in presentation controls on laptops and tablets might exist, the convenience and professional image offered by dedicated presentation remotes are anticipated to offset this to a certain extent. The market is segmented by type (e.g., laser pointers, clickers, multifunctional remotes), connectivity (wireless, wired), and application (corporate, education, etc.), with key players like Logitech, Kensington, and Targus competing based on features, price, and brand reputation. This competitive landscape is further shaped by emerging players from regions like Asia, driving innovation and cost-optimization within the market.
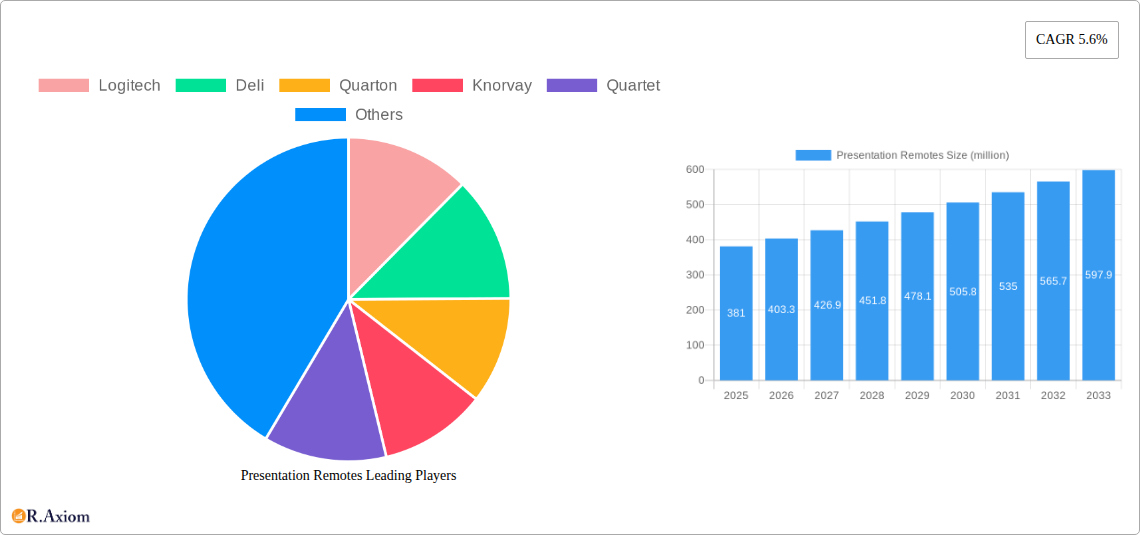
Presentation Remotes Market Size (In Million)
The market's growth trajectory is expected to be consistent, influenced by technological advancements and increased adoption in developing economies. While precise regional breakdowns are absent, a reasonable assumption would see North America and Europe holding significant market shares, followed by Asia-Pacific and other regions. This is due to higher technology adoption rates and a greater concentration of businesses in these mature markets. However, rapidly growing economies in Asia are poised to significantly increase their market share in the coming years, presenting lucrative opportunities for both established and new entrants. The continued focus on enhancing presentation effectiveness through interactive features and seamless integration with various devices is likely to propel market growth throughout the forecast period, creating a dynamic and competitive space for innovation.
Presentation Remotes Company Market Share
Presentation Remotes Market Report: 2019-2033 - A Comprehensive Analysis
This comprehensive report provides a detailed analysis of the global presentation remotes market, covering the period from 2019 to 2033. With a focus on market size, segmentation, competitive landscape, and future growth opportunities, this report is an essential resource for industry stakeholders, investors, and anyone seeking to understand this dynamic market. The report leverages a wealth of data to provide actionable insights and forecasts, valued at millions USD.
Study Period: 2019-2033 Base Year: 2025 Estimated Year: 2025 Forecast Period: 2025-2033 Historical Period: 2019-2024
Presentation Remotes Market Concentration & Innovation
The presentation remotes market exhibits a moderately concentrated landscape, with key players like Logitech, Kensington, and Targus holding significant market share. However, the market is also characterized by a considerable number of smaller players, indicating a competitive environment. Innovation is a key driver, with companies focusing on features like improved connectivity, longer battery life, and enhanced presentation capabilities. Regulatory frameworks related to electronic device safety and electromagnetic interference (EMI) compliance influence product design and manufacturing. Substitute products, such as smartphone apps and cloud-based presentation tools, are posing a challenge to traditional presentation remotes, albeit with limitations in functionality and features. End-user trends show a growing demand for wireless, user-friendly, and aesthetically pleasing devices. Mergers and acquisitions (M&A) activities in the market are relatively infrequent, with deal values averaging around xx million USD per transaction in the recent past.
- Market Share (2024): Logitech (15%), Kensington (12%), Targus (10%), Others (63%)
- M&A Activity (2019-2024): xx deals totaling approximately xx million USD.
Presentation Remotes Industry Trends & Insights
The global presentation remotes market is experiencing steady growth, driven by the increasing adoption of presentations across diverse industries. The Compound Annual Growth Rate (CAGR) is projected to be xx% during the forecast period (2025-2033). Market penetration is relatively high in developed regions but is expected to see significant expansion in emerging markets. Technological disruptions are creating opportunities for innovative products with features such as laser pointers, advanced connectivity options (e.g., Bluetooth 5.0, Wi-Fi), and integration with smartphones and tablets. Consumer preferences are shifting toward more ergonomic, portable, and aesthetically pleasing designs. Competitive dynamics are largely shaped by technological innovation, pricing strategies, and brand recognition.
Dominant Markets & Segments in Presentation Remotes
The North American region currently holds the largest market share in the presentation remotes market due to high technological adoption, strong demand from corporate sectors, and well-established distribution channels. The corporate sector is the primary end-user segment, driven by the increasing use of presentations in business meetings, conferences, and training sessions.
Key Drivers for North American Dominance:
- Strong corporate sector adoption
- Robust technological infrastructure
- High disposable income
Dominance Analysis: North America’s dominance is further reinforced by the concentration of major technology companies in the region, fueling the demand and innovation in presentation technologies.
Presentation Remotes Product Developments
Recent product innovations focus on enhancing connectivity, improving battery life, incorporating laser pointers with various functionalities (e.g., adjustable brightness, multiple pointer modes), and designing more ergonomic and aesthetically pleasing remotes. Wireless connectivity standards are continuously evolving, incorporating technologies like Bluetooth 5.0 and Wi-Fi for better range and reliability. The market fit for these innovations is high, driven by the demand for enhanced user experience and seamless integration with other devices.
Report Scope & Segmentation Analysis
This report segments the presentation remotes market based on several factors including type (wireless, wired), connectivity (Bluetooth, USB, RF), application (business, education, entertainment), and region (North America, Europe, Asia-Pacific, Middle East & Africa, South America). Each segment's market size, growth projections, and competitive dynamics are analyzed in detail. For example, the wireless segment is experiencing rapid growth due to increased convenience and portability.
Key Drivers of Presentation Remotes Growth
The presentation remotes market's growth is driven by several key factors. The increasing adoption of presentations across various industries (corporate, education, and entertainment) is a primary driver. Technological advancements, such as improved connectivity and enhanced features, are further boosting demand. Economic growth in emerging markets is also contributing to market expansion. Government initiatives promoting digitalization and technology adoption in various sectors are creating favorable conditions for market growth.
Challenges in the Presentation Remotes Sector
The presentation remotes market faces certain challenges. The emergence of substitute products, such as smartphone presentation apps, is increasing competition. Supply chain disruptions and fluctuations in raw material costs can impact profitability. Regulatory compliance requirements related to electronic device safety and environmental standards pose challenges for manufacturers. These factors collectively impose constraints on market expansion and profitability.
Emerging Opportunities in Presentation Remotes
The integration of smart features, such as voice control and gesture recognition, is presenting exciting opportunities. The growing demand for presentation remotes with enhanced security features, such as encryption, is also creating market opportunities. Expansion into emerging markets with increasing demand for affordable and reliable presentation technologies offers further growth potential.
Leading Players in the Presentation Remotes Market
- Logitech
- Deli
- Quarton
- Knorvay
- Quartet
- Kensington
- Hawk
- SMK-Link
- Targus
- ASiNG
- Vson
- Wicked Lasers
- Xuzhou Tiancai
- 3M
- Alpec
Key Developments in Presentation Remotes Industry
- 2022 Q3: Logitech launched a new line of presentation remotes with improved battery life and enhanced connectivity.
- 2023 Q1: Kensington acquired a smaller presentation remote manufacturer, expanding its market share.
- 2024 Q2: Targus introduced a new range of eco-friendly presentation remotes using recycled materials.
Strategic Outlook for Presentation Remotes Market
The presentation remotes market is poised for continued growth, driven by technological innovations, expanding applications, and increasing demand across various sectors. Strategic partnerships, product diversification, and expansion into emerging markets will be crucial for companies to maintain competitiveness and capitalize on future growth opportunities. The incorporation of advanced features and sustainable manufacturing practices will be key differentiators in shaping the future of the presentation remotes market.
Presentation Remotes Segmentation
-
1. Application
- 1.1. Personal
- 1.2. Commercial
-
2. Types
- 2.1. Bluetooth
- 2.2. RF (Wireless Radio Frequency)
Presentation Remotes Segmentation By Geography
-
1. North America
- 1.1. United States
- 1.2. Canada
- 1.3. Mexico
-
2. South America
- 2.1. Brazil
- 2.2. Argentina
- 2.3. Rest of South America
-
3. Europe
- 3.1. United Kingdom
- 3.2. Germany
- 3.3. France
- 3.4. Italy
- 3.5. Spain
- 3.6. Russia
- 3.7. Benelux
- 3.8. Nordics
- 3.9. Rest of Europe
-
4. Middle East & Africa
- 4.1. Turkey
- 4.2. Israel
- 4.3. GCC
- 4.4. North Africa
- 4.5. South Africa
- 4.6. Rest of Middle East & Africa
-
5. Asia Pacific
- 5.1. China
- 5.2. India
- 5.3. Japan
- 5.4. South Korea
- 5.5. ASEAN
- 5.6. Oceania
- 5.7. Rest of Asia Pacific

Presentation Remotes Regional Market Share
Geographic Coverage of Presentation Remotes
Presentation Remotes REPORT HIGHLIGHTS
| Aspects | Details |
|---|---|
| Study Period | 2020-2034 |
| Base Year | 2025 |
| Estimated Year | 2026 |
| Forecast Period | 2026-2034 |
| Historical Period | 2020-2025 |
| Growth Rate | CAGR of 5.6% from 2020-2034 |
| Segmentation |
|
Table of Contents
- 1. Introduction
- 1.1. Research Scope
- 1.2. Market Segmentation
- 1.3. Research Objective
- 1.4. Definitions and Assumptions
- 2. Executive Summary
- 2.1. Market Snapshot
- 3. Market Dynamics
- 3.1. Market Drivers
- 3.2. Market Restrains
- 3.3. Market Trends
- 3.4. Market Opportunities
- 4. Market Factor Analysis
- 4.1. Porters Five Forces
- 4.1.1. Bargaining Power of Suppliers
- 4.1.2. Bargaining Power of Buyers
- 4.1.3. Threat of New Entrants
- 4.1.4. Threat of Substitutes
- 4.1.5. Competitive Rivalry
- 4.2. PESTEL analysis
- 4.3. BCG Analysis
- 4.3.1. Stars (High Growth, High Market Share)
- 4.3.2. Cash Cows (Low Growth, High Market Share)
- 4.3.3. Question Mark (High Growth, Low Market Share)
- 4.3.4. Dogs (Low Growth, Low Market Share)
- 4.4. Ansoff Matrix Analysis
- 4.5. Supply Chain Analysis
- 4.6. Regulatory Landscape
- 4.7. Current Market Potential and Opportunity Assessment (TAM–SAM–SOM Framework)
- 4.8. RAX Analyst Note
- 4.1. Porters Five Forces
- 5. Market Analysis, Insights and Forecast 2021-2033
- 5.1. Market Analysis, Insights and Forecast - by Application
- 5.1.1. Personal
- 5.1.2. Commercial
- 5.2. Market Analysis, Insights and Forecast - by Types
- 5.2.1. Bluetooth
- 5.2.2. RF (Wireless Radio Frequency)
- 5.3. Market Analysis, Insights and Forecast - by Region
- 5.3.1. North America
- 5.3.2. South America
- 5.3.3. Europe
- 5.3.4. Middle East & Africa
- 5.3.5. Asia Pacific
- 5.1. Market Analysis, Insights and Forecast - by Application
- 6. Global Presentation Remotes Analysis, Insights and Forecast, 2021-2033
- 6.1. Market Analysis, Insights and Forecast - by Application
- 6.1.1. Personal
- 6.1.2. Commercial
- 6.2. Market Analysis, Insights and Forecast - by Types
- 6.2.1. Bluetooth
- 6.2.2. RF (Wireless Radio Frequency)
- 6.1. Market Analysis, Insights and Forecast - by Application
- 7. North America Presentation Remotes Analysis, Insights and Forecast, 2020-2032
- 7.1. Market Analysis, Insights and Forecast - by Application
- 7.1.1. Personal
- 7.1.2. Commercial
- 7.2. Market Analysis, Insights and Forecast - by Types
- 7.2.1. Bluetooth
- 7.2.2. RF (Wireless Radio Frequency)
- 7.1. Market Analysis, Insights and Forecast - by Application
- 8. South America Presentation Remotes Analysis, Insights and Forecast, 2020-2032
- 8.1. Market Analysis, Insights and Forecast - by Application
- 8.1.1. Personal
- 8.1.2. Commercial
- 8.2. Market Analysis, Insights and Forecast - by Types
- 8.2.1. Bluetooth
- 8.2.2. RF (Wireless Radio Frequency)
- 8.1. Market Analysis, Insights and Forecast - by Application
- 9. Europe Presentation Remotes Analysis, Insights and Forecast, 2020-2032
- 9.1. Market Analysis, Insights and Forecast - by Application
- 9.1.1. Personal
- 9.1.2. Commercial
- 9.2. Market Analysis, Insights and Forecast - by Types
- 9.2.1. Bluetooth
- 9.2.2. RF (Wireless Radio Frequency)
- 9.1. Market Analysis, Insights and Forecast - by Application
- 10. Middle East & Africa Presentation Remotes Analysis, Insights and Forecast, 2020-2032
- 10.1. Market Analysis, Insights and Forecast - by Application
- 10.1.1. Personal
- 10.1.2. Commercial
- 10.2. Market Analysis, Insights and Forecast - by Types
- 10.2.1. Bluetooth
- 10.2.2. RF (Wireless Radio Frequency)
- 10.1. Market Analysis, Insights and Forecast - by Application
- 11. Asia Pacific Presentation Remotes Analysis, Insights and Forecast, 2020-2032
- 11.1. Market Analysis, Insights and Forecast - by Application
- 11.1.1. Personal
- 11.1.2. Commercial
- 11.2. Market Analysis, Insights and Forecast - by Types
- 11.2.1. Bluetooth
- 11.2.2. RF (Wireless Radio Frequency)
- 11.1. Market Analysis, Insights and Forecast - by Application
- 12. Competitive Analysis
- 12.1. Company Profiles
- 12.1.1 Logitech
- 12.1.1.1. Company Overview
- 12.1.1.2. Products
- 12.1.1.3. Company Financials
- 12.1.1.4. SWOT Analysis
- 12.1.2 Deli
- 12.1.2.1. Company Overview
- 12.1.2.2. Products
- 12.1.2.3. Company Financials
- 12.1.2.4. SWOT Analysis
- 12.1.3 Quarton
- 12.1.3.1. Company Overview
- 12.1.3.2. Products
- 12.1.3.3. Company Financials
- 12.1.3.4. SWOT Analysis
- 12.1.4 Knorvay
- 12.1.4.1. Company Overview
- 12.1.4.2. Products
- 12.1.4.3. Company Financials
- 12.1.4.4. SWOT Analysis
- 12.1.5 Quartet
- 12.1.5.1. Company Overview
- 12.1.5.2. Products
- 12.1.5.3. Company Financials
- 12.1.5.4. SWOT Analysis
- 12.1.6 Kensington
- 12.1.6.1. Company Overview
- 12.1.6.2. Products
- 12.1.6.3. Company Financials
- 12.1.6.4. SWOT Analysis
- 12.1.7 Hawk
- 12.1.7.1. Company Overview
- 12.1.7.2. Products
- 12.1.7.3. Company Financials
- 12.1.7.4. SWOT Analysis
- 12.1.8 SMK-Link
- 12.1.8.1. Company Overview
- 12.1.8.2. Products
- 12.1.8.3. Company Financials
- 12.1.8.4. SWOT Analysis
- 12.1.9 Targus
- 12.1.9.1. Company Overview
- 12.1.9.2. Products
- 12.1.9.3. Company Financials
- 12.1.9.4. SWOT Analysis
- 12.1.10 ASiNG
- 12.1.10.1. Company Overview
- 12.1.10.2. Products
- 12.1.10.3. Company Financials
- 12.1.10.4. SWOT Analysis
- 12.1.11 Vson
- 12.1.11.1. Company Overview
- 12.1.11.2. Products
- 12.1.11.3. Company Financials
- 12.1.11.4. SWOT Analysis
- 12.1.12 Wicked Lasers
- 12.1.12.1. Company Overview
- 12.1.12.2. Products
- 12.1.12.3. Company Financials
- 12.1.12.4. SWOT Analysis
- 12.1.13 Xuzhou Tiancai
- 12.1.13.1. Company Overview
- 12.1.13.2. Products
- 12.1.13.3. Company Financials
- 12.1.13.4. SWOT Analysis
- 12.1.14 3M
- 12.1.14.1. Company Overview
- 12.1.14.2. Products
- 12.1.14.3. Company Financials
- 12.1.14.4. SWOT Analysis
- 12.1.15 Alpec
- 12.1.15.1. Company Overview
- 12.1.15.2. Products
- 12.1.15.3. Company Financials
- 12.1.15.4. SWOT Analysis
- 12.1.1 Logitech
- 12.2. Market Entropy
- 12.2.1 Company's Key Areas Served
- 12.2.2 Recent Developments
- 12.3. Company Market Share Analysis 2025
- 12.3.1 Top 5 Companies Market Share Analysis
- 12.3.2 Top 3 Companies Market Share Analysis
- 12.4. List of Potential Customers
- 13. Research Methodology
List of Figures
- Figure 1: Global Presentation Remotes Revenue Breakdown (million, %) by Region 2025 & 2033
- Figure 2: Global Presentation Remotes Volume Breakdown (K, %) by Region 2025 & 2033
- Figure 3: North America Presentation Remotes Revenue (million), by Application 2025 & 2033
- Figure 4: North America Presentation Remotes Volume (K), by Application 2025 & 2033
- Figure 5: North America Presentation Remotes Revenue Share (%), by Application 2025 & 2033
- Figure 6: North America Presentation Remotes Volume Share (%), by Application 2025 & 2033
- Figure 7: North America Presentation Remotes Revenue (million), by Types 2025 & 2033
- Figure 8: North America Presentation Remotes Volume (K), by Types 2025 & 2033
- Figure 9: North America Presentation Remotes Revenue Share (%), by Types 2025 & 2033
- Figure 10: North America Presentation Remotes Volume Share (%), by Types 2025 & 2033
- Figure 11: North America Presentation Remotes Revenue (million), by Country 2025 & 2033
- Figure 12: North America Presentation Remotes Volume (K), by Country 2025 & 2033
- Figure 13: North America Presentation Remotes Revenue Share (%), by Country 2025 & 2033
- Figure 14: North America Presentation Remotes Volume Share (%), by Country 2025 & 2033
- Figure 15: South America Presentation Remotes Revenue (million), by Application 2025 & 2033
- Figure 16: South America Presentation Remotes Volume (K), by Application 2025 & 2033
- Figure 17: South America Presentation Remotes Revenue Share (%), by Application 2025 & 2033
- Figure 18: South America Presentation Remotes Volume Share (%), by Application 2025 & 2033
- Figure 19: South America Presentation Remotes Revenue (million), by Types 2025 & 2033
- Figure 20: South America Presentation Remotes Volume (K), by Types 2025 & 2033
- Figure 21: South America Presentation Remotes Revenue Share (%), by Types 2025 & 2033
- Figure 22: South America Presentation Remotes Volume Share (%), by Types 2025 & 2033
- Figure 23: South America Presentation Remotes Revenue (million), by Country 2025 & 2033
- Figure 24: South America Presentation Remotes Volume (K), by Country 2025 & 2033
- Figure 25: South America Presentation Remotes Revenue Share (%), by Country 2025 & 2033
- Figure 26: South America Presentation Remotes Volume Share (%), by Country 2025 & 2033
- Figure 27: Europe Presentation Remotes Revenue (million), by Application 2025 & 2033
- Figure 28: Europe Presentation Remotes Volume (K), by Application 2025 & 2033
- Figure 29: Europe Presentation Remotes Revenue Share (%), by Application 2025 & 2033
- Figure 30: Europe Presentation Remotes Volume Share (%), by Application 2025 & 2033
- Figure 31: Europe Presentation Remotes Revenue (million), by Types 2025 & 2033
- Figure 32: Europe Presentation Remotes Volume (K), by Types 2025 & 2033
- Figure 33: Europe Presentation Remotes Revenue Share (%), by Types 2025 & 2033
- Figure 34: Europe Presentation Remotes Volume Share (%), by Types 2025 & 2033
- Figure 35: Europe Presentation Remotes Revenue (million), by Country 2025 & 2033
- Figure 36: Europe Presentation Remotes Volume (K), by Country 2025 & 2033
- Figure 37: Europe Presentation Remotes Revenue Share (%), by Country 2025 & 2033
- Figure 38: Europe Presentation Remotes Volume Share (%), by Country 2025 & 2033
- Figure 39: Middle East & Africa Presentation Remotes Revenue (million), by Application 2025 & 2033
- Figure 40: Middle East & Africa Presentation Remotes Volume (K), by Application 2025 & 2033
- Figure 41: Middle East & Africa Presentation Remotes Revenue Share (%), by Application 2025 & 2033
- Figure 42: Middle East & Africa Presentation Remotes Volume Share (%), by Application 2025 & 2033
- Figure 43: Middle East & Africa Presentation Remotes Revenue (million), by Types 2025 & 2033
- Figure 44: Middle East & Africa Presentation Remotes Volume (K), by Types 2025 & 2033
- Figure 45: Middle East & Africa Presentation Remotes Revenue Share (%), by Types 2025 & 2033
- Figure 46: Middle East & Africa Presentation Remotes Volume Share (%), by Types 2025 & 2033
- Figure 47: Middle East & Africa Presentation Remotes Revenue (million), by Country 2025 & 2033
- Figure 48: Middle East & Africa Presentation Remotes Volume (K), by Country 2025 & 2033
- Figure 49: Middle East & Africa Presentation Remotes Revenue Share (%), by Country 2025 & 2033
- Figure 50: Middle East & Africa Presentation Remotes Volume Share (%), by Country 2025 & 2033
- Figure 51: Asia Pacific Presentation Remotes Revenue (million), by Application 2025 & 2033
- Figure 52: Asia Pacific Presentation Remotes Volume (K), by Application 2025 & 2033
- Figure 53: Asia Pacific Presentation Remotes Revenue Share (%), by Application 2025 & 2033
- Figure 54: Asia Pacific Presentation Remotes Volume Share (%), by Application 2025 & 2033
- Figure 55: Asia Pacific Presentation Remotes Revenue (million), by Types 2025 & 2033
- Figure 56: Asia Pacific Presentation Remotes Volume (K), by Types 2025 & 2033
- Figure 57: Asia Pacific Presentation Remotes Revenue Share (%), by Types 2025 & 2033
- Figure 58: Asia Pacific Presentation Remotes Volume Share (%), by Types 2025 & 2033
- Figure 59: Asia Pacific Presentation Remotes Revenue (million), by Country 2025 & 2033
- Figure 60: Asia Pacific Presentation Remotes Volume (K), by Country 2025 & 2033
- Figure 61: Asia Pacific Presentation Remotes Revenue Share (%), by Country 2025 & 2033
- Figure 62: Asia Pacific Presentation Remotes Volume Share (%), by Country 2025 & 2033
List of Tables
- Table 1: Global Presentation Remotes Revenue million Forecast, by Application 2020 & 2033
- Table 2: Global Presentation Remotes Volume K Forecast, by Application 2020 & 2033
- Table 3: Global Presentation Remotes Revenue million Forecast, by Types 2020 & 2033
- Table 4: Global Presentation Remotes Volume K Forecast, by Types 2020 & 2033
- Table 5: Global Presentation Remotes Revenue million Forecast, by Region 2020 & 2033
- Table 6: Global Presentation Remotes Volume K Forecast, by Region 2020 & 2033
- Table 7: Global Presentation Remotes Revenue million Forecast, by Application 2020 & 2033
- Table 8: Global Presentation Remotes Volume K Forecast, by Application 2020 & 2033
- Table 9: Global Presentation Remotes Revenue million Forecast, by Types 2020 & 2033
- Table 10: Global Presentation Remotes Volume K Forecast, by Types 2020 & 2033
- Table 11: Global Presentation Remotes Revenue million Forecast, by Country 2020 & 2033
- Table 12: Global Presentation Remotes Volume K Forecast, by Country 2020 & 2033
- Table 13: United States Presentation Remotes Revenue (million) Forecast, by Application 2020 & 2033
- Table 14: United States Presentation Remotes Volume (K) Forecast, by Application 2020 & 2033
- Table 15: Canada Presentation Remotes Revenue (million) Forecast, by Application 2020 & 2033
- Table 16: Canada Presentation Remotes Volume (K) Forecast, by Application 2020 & 2033
- Table 17: Mexico Presentation Remotes Revenue (million) Forecast, by Application 2020 & 2033
- Table 18: Mexico Presentation Remotes Volume (K) Forecast, by Application 2020 & 2033
- Table 19: Global Presentation Remotes Revenue million Forecast, by Application 2020 & 2033
- Table 20: Global Presentation Remotes Volume K Forecast, by Application 2020 & 2033
- Table 21: Global Presentation Remotes Revenue million Forecast, by Types 2020 & 2033
- Table 22: Global Presentation Remotes Volume K Forecast, by Types 2020 & 2033
- Table 23: Global Presentation Remotes Revenue million Forecast, by Country 2020 & 2033
- Table 24: Global Presentation Remotes Volume K Forecast, by Country 2020 & 2033
- Table 25: Brazil Presentation Remotes Revenue (million) Forecast, by Application 2020 & 2033
- Table 26: Brazil Presentation Remotes Volume (K) Forecast, by Application 2020 & 2033
- Table 27: Argentina Presentation Remotes Revenue (million) Forecast, by Application 2020 & 2033
- Table 28: Argentina Presentation Remotes Volume (K) Forecast, by Application 2020 & 2033
- Table 29: Rest of South America Presentation Remotes Revenue (million) Forecast, by Application 2020 & 2033
- Table 30: Rest of South America Presentation Remotes Volume (K) Forecast, by Application 2020 & 2033
- Table 31: Global Presentation Remotes Revenue million Forecast, by Application 2020 & 2033
- Table 32: Global Presentation Remotes Volume K Forecast, by Application 2020 & 2033
- Table 33: Global Presentation Remotes Revenue million Forecast, by Types 2020 & 2033
- Table 34: Global Presentation Remotes Volume K Forecast, by Types 2020 & 2033
- Table 35: Global Presentation Remotes Revenue million Forecast, by Country 2020 & 2033
- Table 36: Global Presentation Remotes Volume K Forecast, by Country 2020 & 2033
- Table 37: United Kingdom Presentation Remotes Revenue (million) Forecast, by Application 2020 & 2033
- Table 38: United Kingdom Presentation Remotes Volume (K) Forecast, by Application 2020 & 2033
- Table 39: Germany Presentation Remotes Revenue (million) Forecast, by Application 2020 & 2033
- Table 40: Germany Presentation Remotes Volume (K) Forecast, by Application 2020 & 2033
- Table 41: France Presentation Remotes Revenue (million) Forecast, by Application 2020 & 2033
- Table 42: France Presentation Remotes Volume (K) Forecast, by Application 2020 & 2033
- Table 43: Italy Presentation Remotes Revenue (million) Forecast, by Application 2020 & 2033
- Table 44: Italy Presentation Remotes Volume (K) Forecast, by Application 2020 & 2033
- Table 45: Spain Presentation Remotes Revenue (million) Forecast, by Application 2020 & 2033
- Table 46: Spain Presentation Remotes Volume (K) Forecast, by Application 2020 & 2033
- Table 47: Russia Presentation Remotes Revenue (million) Forecast, by Application 2020 & 2033
- Table 48: Russia Presentation Remotes Volume (K) Forecast, by Application 2020 & 2033
- Table 49: Benelux Presentation Remotes Revenue (million) Forecast, by Application 2020 & 2033
- Table 50: Benelux Presentation Remotes Volume (K) Forecast, by Application 2020 & 2033
- Table 51: Nordics Presentation Remotes Revenue (million) Forecast, by Application 2020 & 2033
- Table 52: Nordics Presentation Remotes Volume (K) Forecast, by Application 2020 & 2033
- Table 53: Rest of Europe Presentation Remotes Revenue (million) Forecast, by Application 2020 & 2033
- Table 54: Rest of Europe Presentation Remotes Volume (K) Forecast, by Application 2020 & 2033
- Table 55: Global Presentation Remotes Revenue million Forecast, by Application 2020 & 2033
- Table 56: Global Presentation Remotes Volume K Forecast, by Application 2020 & 2033
- Table 57: Global Presentation Remotes Revenue million Forecast, by Types 2020 & 2033
- Table 58: Global Presentation Remotes Volume K Forecast, by Types 2020 & 2033
- Table 59: Global Presentation Remotes Revenue million Forecast, by Country 2020 & 2033
- Table 60: Global Presentation Remotes Volume K Forecast, by Country 2020 & 2033
- Table 61: Turkey Presentation Remotes Revenue (million) Forecast, by Application 2020 & 2033
- Table 62: Turkey Presentation Remotes Volume (K) Forecast, by Application 2020 & 2033
- Table 63: Israel Presentation Remotes Revenue (million) Forecast, by Application 2020 & 2033
- Table 64: Israel Presentation Remotes Volume (K) Forecast, by Application 2020 & 2033
- Table 65: GCC Presentation Remotes Revenue (million) Forecast, by Application 2020 & 2033
- Table 66: GCC Presentation Remotes Volume (K) Forecast, by Application 2020 & 2033
- Table 67: North Africa Presentation Remotes Revenue (million) Forecast, by Application 2020 & 2033
- Table 68: North Africa Presentation Remotes Volume (K) Forecast, by Application 2020 & 2033
- Table 69: South Africa Presentation Remotes Revenue (million) Forecast, by Application 2020 & 2033
- Table 70: South Africa Presentation Remotes Volume (K) Forecast, by Application 2020 & 2033
- Table 71: Rest of Middle East & Africa Presentation Remotes Revenue (million) Forecast, by Application 2020 & 2033
- Table 72: Rest of Middle East & Africa Presentation Remotes Volume (K) Forecast, by Application 2020 & 2033
- Table 73: Global Presentation Remotes Revenue million Forecast, by Application 2020 & 2033
- Table 74: Global Presentation Remotes Volume K Forecast, by Application 2020 & 2033
- Table 75: Global Presentation Remotes Revenue million Forecast, by Types 2020 & 2033
- Table 76: Global Presentation Remotes Volume K Forecast, by Types 2020 & 2033
- Table 77: Global Presentation Remotes Revenue million Forecast, by Country 2020 & 2033
- Table 78: Global Presentation Remotes Volume K Forecast, by Country 2020 & 2033
- Table 79: China Presentation Remotes Revenue (million) Forecast, by Application 2020 & 2033
- Table 80: China Presentation Remotes Volume (K) Forecast, by Application 2020 & 2033
- Table 81: India Presentation Remotes Revenue (million) Forecast, by Application 2020 & 2033
- Table 82: India Presentation Remotes Volume (K) Forecast, by Application 2020 & 2033
- Table 83: Japan Presentation Remotes Revenue (million) Forecast, by Application 2020 & 2033
- Table 84: Japan Presentation Remotes Volume (K) Forecast, by Application 2020 & 2033
- Table 85: South Korea Presentation Remotes Revenue (million) Forecast, by Application 2020 & 2033
- Table 86: South Korea Presentation Remotes Volume (K) Forecast, by Application 2020 & 2033
- Table 87: ASEAN Presentation Remotes Revenue (million) Forecast, by Application 2020 & 2033
- Table 88: ASEAN Presentation Remotes Volume (K) Forecast, by Application 2020 & 2033
- Table 89: Oceania Presentation Remotes Revenue (million) Forecast, by Application 2020 & 2033
- Table 90: Oceania Presentation Remotes Volume (K) Forecast, by Application 2020 & 2033
- Table 91: Rest of Asia Pacific Presentation Remotes Revenue (million) Forecast, by Application 2020 & 2033
- Table 92: Rest of Asia Pacific Presentation Remotes Volume (K) Forecast, by Application 2020 & 2033
Frequently Asked Questions
1. What is the projected Compound Annual Growth Rate (CAGR) of the Presentation Remotes?
The projected CAGR is approximately 5.6%.
2. Which companies are prominent players in the Presentation Remotes?
Key companies in the market include Logitech, Deli, Quarton, Knorvay, Quartet, Kensington, Hawk, SMK-Link, Targus, ASiNG, Vson, Wicked Lasers, Xuzhou Tiancai, 3M, Alpec.
3. What are the main segments of the Presentation Remotes?
The market segments include Application, Types.
4. Can you provide details about the market size?
The market size is estimated to be USD 381 million as of 2022.
5. What are some drivers contributing to market growth?
N/A
6. What are the notable trends driving market growth?
N/A
7. Are there any restraints impacting market growth?
N/A
8. Can you provide examples of recent developments in the market?
N/A
9. What pricing options are available for accessing the report?
Pricing options include single-user, multi-user, and enterprise licenses priced at USD 3350.00, USD 5025.00, and USD 6700.00 respectively.
10. Is the market size provided in terms of value or volume?
The market size is provided in terms of value, measured in million and volume, measured in K.
11. Are there any specific market keywords associated with the report?
Yes, the market keyword associated with the report is "Presentation Remotes," which aids in identifying and referencing the specific market segment covered.
12. How do I determine which pricing option suits my needs best?
The pricing options vary based on user requirements and access needs. Individual users may opt for single-user licenses, while businesses requiring broader access may choose multi-user or enterprise licenses for cost-effective access to the report.
13. Are there any additional resources or data provided in the Presentation Remotes report?
While the report offers comprehensive insights, it's advisable to review the specific contents or supplementary materials provided to ascertain if additional resources or data are available.
14. How can I stay updated on further developments or reports in the Presentation Remotes?
To stay informed about further developments, trends, and reports in the Presentation Remotes, consider subscribing to industry newsletters, following relevant companies and organizations, or regularly checking reputable industry news sources and publications.
Methodology
Step 1 - Identification of Relevant Samples Size from Population Database


Step 2 - Approaches for Defining Global Market Size (Value, Volume* & Price*)

Note*: In applicable scenarios
Step 3 - Data Sources
Primary Research
- Web Analytics
- Survey Reports
- Research Institute
- Latest Research Reports
- Opinion Leaders
Secondary Research
- Annual Reports
- White Paper
- Latest Press Release
- Industry Association
- Paid Database
- Investor Presentations

Step 4 - Data Triangulation
Involves using different sources of information in order to increase the validity of a study
These sources are likely to be stakeholders in a program - participants, other researchers, program staff, other community members, and so on.
Then we put all data in single framework & apply various statistical tools to find out the dynamic on the market.
During the analysis stage, feedback from the stakeholder groups would be compared to determine areas of agreement as well as areas of divergence