

Key Insights
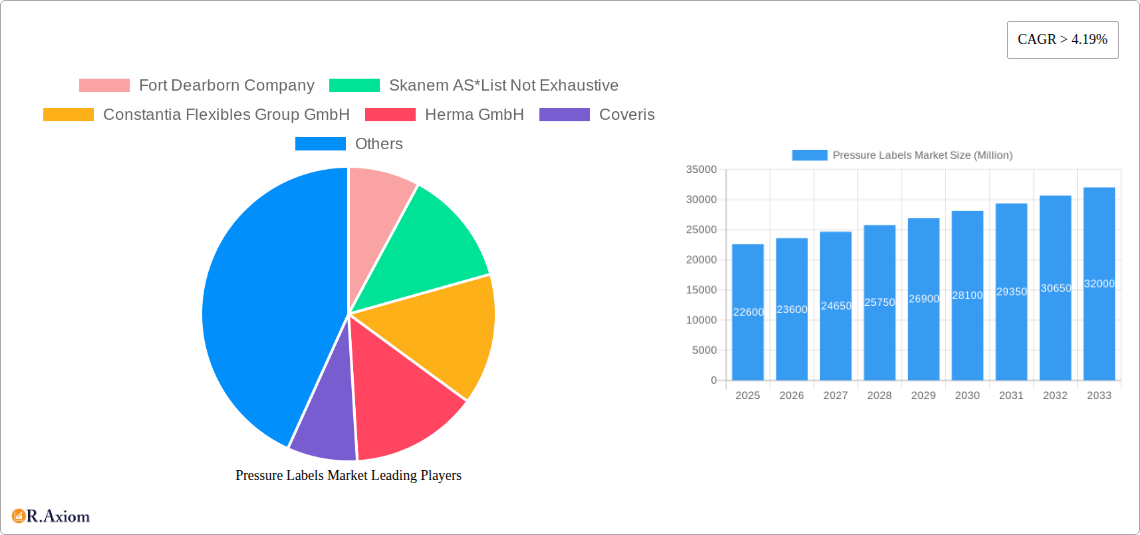
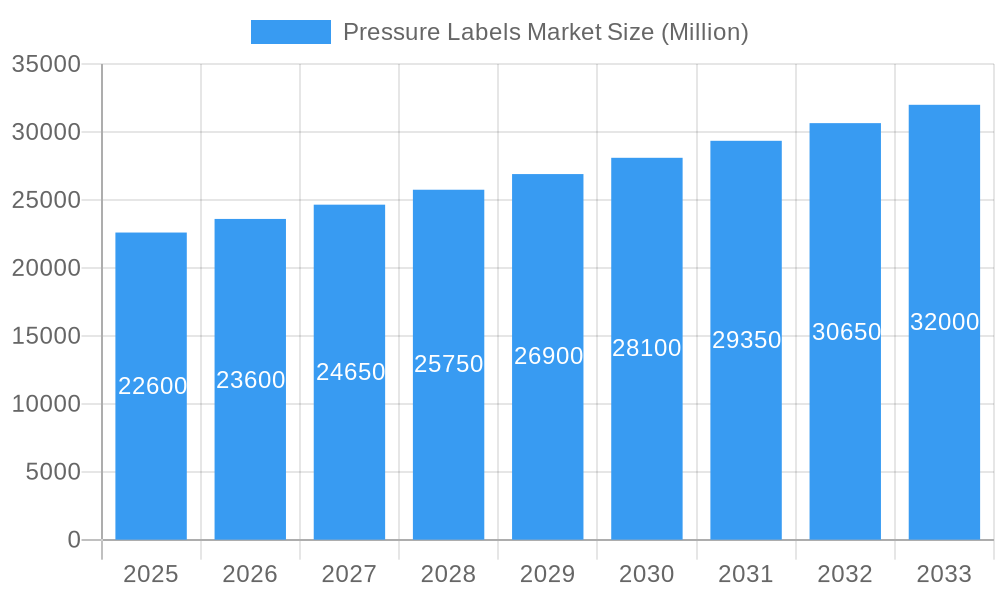
The pressure-sensitive label market, valued at $22.60 billion in 2025, exhibits robust growth, projected to expand at a CAGR exceeding 4.19% from 2025 to 2033. This expansion is fueled by several key drivers. The burgeoning food and beverage industry, demanding efficient and attractive labeling solutions, significantly contributes to market growth. The healthcare sector's increasing reliance on tamper-evident and detailed labels for pharmaceuticals and medical devices further boosts demand. E-commerce's explosive growth necessitates high-volume, durable pressure-sensitive labels for efficient product identification and shipping. Technological advancements in printing processes, such as inkjet and flexography, enabling high-quality, customized labels at competitive prices, also propel market expansion. Furthermore, the rising adoption of sustainable and eco-friendly label materials caters to growing environmental consciousness. Regional variations exist, with North America and Europe currently holding substantial market shares, driven by established industries and advanced technologies. However, Asia-Pacific is poised for significant growth due to rapid industrialization and expanding consumer markets. Despite these positive trends, challenges remain, including fluctuating raw material prices and increasing competition from alternative labeling technologies.
Pressure Labels Market Market Size (In Billion)
The market segmentation reveals significant opportunities across various end-user industries. The food and beverage sector remains dominant due to the volume of products requiring labeling. The healthcare industry shows significant growth potential due to stringent regulatory requirements and the need for detailed product information. The cosmetics and personal care sector also displays strong demand for aesthetically pleasing and informative labels. Gravure and flexography remain the most widely used printing processes due to their cost-effectiveness and ability to handle high-volume production. However, inkjet printing is rapidly gaining traction due to its versatility and ability to produce highly customized labels. Key players in this market, including Fort Dearborn Company, Constantia Flexibles, and Avery Dennison, are continuously innovating to meet evolving customer demands and maintain their competitive edge. The forecast period suggests continued growth, driven by sustained demand from key sectors and ongoing technological advancements.
Pressure Labels Market Company Market Share
Pressure Labels Market: A Comprehensive Report (2019-2033)
This in-depth report provides a comprehensive analysis of the global pressure labels market, offering invaluable insights for industry stakeholders, investors, and strategic decision-makers. The study covers the period 2019-2033, with a focus on the forecast period 2025-2033 and a base year of 2025. The report meticulously examines market dynamics, including key segments, leading players, emerging trends, and future growth prospects. With detailed segmentation by end-user industry and print process, this report is an essential resource for understanding and navigating this dynamic market. The total market size is projected to reach xx Million by 2033.
Pressure Labels Market Market Concentration & Innovation
The pressure-sensitive label market exhibits a moderately concentrated landscape, with several major players commanding significant market share. While precise market share figures for individual companies are proprietary, key players like Avery Dennison Corp, CCL Industries Inc, and UPM Raflatac Inc hold substantial positions. The market's overall concentration is influenced by factors such as economies of scale, technological advancements, and brand recognition.
- Market Concentration: The Herfindahl-Hirschman Index (HHI) is estimated to be around xx, indicating a moderately concentrated market.
- Innovation Drivers: Key drivers include advancements in printing technologies (e.g., digital printing), the development of sustainable materials (e.g., recycled content labels), and increasing demand for specialized labels across various sectors.
- Regulatory Frameworks: Regulations concerning material safety, labeling requirements (e.g., food safety standards), and environmental concerns significantly impact market dynamics. Compliance costs and evolving regulations influence manufacturers' strategies.
- Product Substitutes: Alternative labeling methods, such as inkjet printing directly onto products, pose some competitive threat; however, the advantages of pressure-sensitive labels in terms of flexibility, ease of application, and cost-effectiveness generally maintain their dominance.
- End-User Trends: Growing e-commerce, personalized product packaging, and brand enhancement drives demand for innovative and high-quality pressure-sensitive labels.
- M&A Activities: Recent mergers and acquisitions, such as the recapitalization of Online Labels Group by Sentinel Capital Partners in December 2023, highlight industry consolidation and strategic investments to enhance market position and product portfolios. The total value of M&A deals in the pressure-sensitive label market in 2024 was estimated at xx Million.
Pressure Labels Market Industry Trends & Insights
The global pressure labels market is experiencing robust growth, driven by a confluence of factors. The increasing demand for packaged goods across diverse industries fuels market expansion. Technological advancements, particularly in digital printing, contribute to higher customization options and faster production times, boosting market attractiveness. The growing preference for sustainable and eco-friendly labeling solutions is also shaping market trends. A strong CAGR of xx% is projected for the forecast period (2025-2033), reflecting the positive market outlook.
Consumer preferences for visually appealing and informative labels are increasingly influencing packaging designs. This trend encourages innovation in label materials, printing techniques, and finishing options. The competitive landscape remains dynamic, with established players and new entrants constantly vying for market share. Competition is primarily driven by product innovation, pricing strategies, and geographical expansion. Market penetration across various end-user sectors shows continued growth, with significant opportunities across emerging economies.
Dominant Markets & Segments in Pressure Labels Market
The pressure-sensitive label market is geographically diverse, with significant variations across regions and countries. However, North America and Europe currently dominate the market due to their established packaging industries, high consumer spending, and advanced technological infrastructure.
By End-User Industry:
- Food & Beverage: This segment remains the largest, driven by stringent labeling regulations and increasing consumer demand for product information.
- Healthcare: The demand for pharmaceutical and medical device labeling with high-quality printing and durability contributes to significant market share.
- Cosmetics & Household: Growing demand for aesthetically appealing and informative labels drives growth in this segment.
By Print Process:
- Flexography: This process maintains market dominance due to its cost-effectiveness and suitability for high-volume production.
- Gravure: This method excels in high-quality printing, particularly for intricate designs, but faces competition from more cost-effective alternatives.
- Digital Printing: Growth in digital printing is observed, driven by increased flexibility and shorter lead times.
Key drivers for regional dominance include strong economic growth, robust industrial sectors, advanced infrastructure, and favorable regulatory frameworks. Emerging economies in Asia-Pacific present considerable growth potential, fueled by rising consumer spending and increasing industrialization.
Pressure Labels Market Product Developments
Recent innovations focus on sustainable materials like recycled paper and biodegradable plastics. New printing technologies, especially digital printing, enhance label customization and speed. Advances in adhesive technology improve label performance, adhesion, and shelf life. These innovations are helping to meet the growing demand for more sustainable and effective labeling solutions. The key competitive advantage lies in offering high-quality, cost-effective solutions tailored to specific end-user needs.
Report Scope & Segmentation Analysis
This report segments the pressure-sensitive labels market across various categories. By End-User Industry: Food, Beverage, Healthcare, Cosmetics, Household, Industrial (Automotive, Industrial Chemicals, Consumer & Non-consumer Durables), Logistics, and Other End-user Industries. Each segment is analyzed based on market size, growth projections, and competitive dynamics. By Print Process: Gravure, Flexography, Screen, Letterpress, Inkjet, and Other Processes (Offset Lithography, Electrophotography) are considered. Growth projections for each segment are provided, taking into account various factors like technological advancements, changing consumer preferences, and regulatory landscape.
Key Drivers of Pressure Labels Market Growth
The market is propelled by the rising demand for packaged goods globally, especially in emerging markets. Technological advancements in printing, materials, and adhesives enhance product quality, customization, and sustainability. Stringent labeling regulations and consumer preference for detailed product information contribute to higher demand. The increasing adoption of e-commerce also significantly boosts the need for high-quality pressure-sensitive labels.
Challenges in the Pressure Labels Market Sector
Fluctuating raw material prices, particularly for adhesives and substrates, pose a significant challenge. The intense competition among existing players leads to price pressures. Stringent environmental regulations impact material choices and manufacturing processes, adding to production costs. Supply chain disruptions due to geopolitical factors and global events can hinder production and delivery timelines.
Emerging Opportunities in Pressure Labels Market
The growing demand for sustainable and eco-friendly labels opens opportunities for manufacturers offering biodegradable and recycled materials. The increasing use of digital printing allows for personalized labeling, enhancing brand differentiation and consumer engagement. Expansion into emerging markets with high growth potential is another significant opportunity. Smart labels with embedded technologies, such as RFID, offer potential for future market expansion.
Leading Players in the Pressure Labels Market Market
- Fort Dearborn Company
- Skanem AS
- Constantia Flexibles Group GmbH
- Herma GmbH
- Coveris
- Westrock Company
- Inland Printing Co Ltd
- UPM Raflatac Inc
- Taylor Corporation
- Huhtamaki Group
- CCL Industries Inc
- Avery Dennison Corp
- Fuji Seal International Inc
- Taghleef Industries Inc (Al Ghurair Group)
- Multicolor Corporation
- Folienprint RAKO GmbH
Key Developments in Pressure Labels Market Industry
- December 2023: Sentinel Capital Partners' recapitalization of Online Labels Group signals industry consolidation and investment in pressure-sensitive labels, shrink sleeves, and flexible packaging.
- April 2023: Innovia Films' development of Rayoface AQBSA, a new printable coated BOPP film for pressure-sensitive labeling, highlights innovation in materials and technology.
Strategic Outlook for Pressure Labels Market Market
The pressure-sensitive label market is poised for continued growth, driven by rising global demand for packaged goods, technological advancements, and increasing consumer focus on product information and sustainability. Strategic investments in innovation, sustainable materials, and efficient manufacturing processes will be crucial for success. Expansion into new markets and the adoption of advanced technologies will play a significant role in shaping the industry's future.
Pressure Labels Market Segmentation
-
1. Print Process
- 1.1. Gravure
- 1.2. Flexography
- 1.3. Screen
- 1.4. Letterpress
- 1.5. Inkjet
- 1.6. Other Pr
-
2. End-User Industry
- 2.1. Food
- 2.2. Beverage
- 2.3. Healthcare
- 2.4. Cosmetics
- 2.5. Household
- 2.6. Industri
- 2.7. Logistics
- 2.8. Other End-user Industries
Pressure Labels Market Segmentation By Geography
-
1. North America
- 1.1. United States
- 1.2. Canada
-
2. Europe
- 2.1. United Kingdom
- 2.2. Germany
- 2.3. France
- 2.4. Spain
- 2.5. Rest of Europe
-
3. Asia Pacific
- 3.1. China
- 3.2. India
- 3.3. Japan
- 3.4. Rest of Asia Pacific
- 4. Latin America
- 5. Middle East and Africa
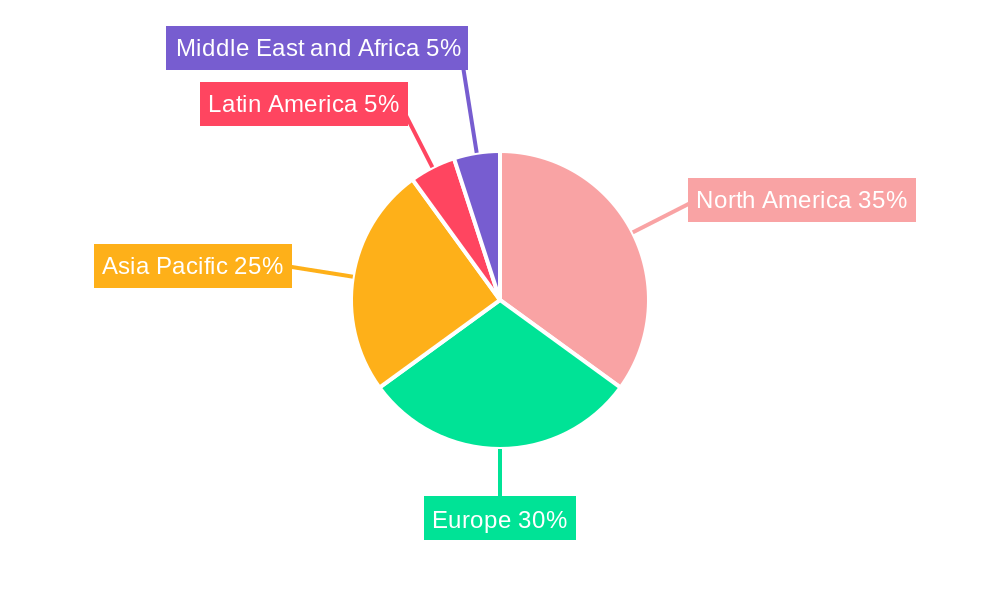
Pressure Labels Market Regional Market Share
Geographic Coverage of Pressure Labels Market
Pressure Labels Market REPORT HIGHLIGHTS
| Aspects | Details |
|---|---|
| Study Period | 2020-2034 |
| Base Year | 2025 |
| Estimated Year | 2026 |
| Forecast Period | 2026-2034 |
| Historical Period | 2020-2025 |
| Growth Rate | CAGR of > 4.19% from 2020-2034 |
| Segmentation |
|
Table of Contents
- 1. Introduction
- 1.1. Research Scope
- 1.2. Market Segmentation
- 1.3. Research Objective
- 1.4. Definitions and Assumptions
- 2. Executive Summary
- 2.1. Market Snapshot
- 3. Market Dynamics
- 3.1. Market Drivers
- 3.2. Market Restrains
- 3.3. Market Trends
- 3.4. Market Opportunities
- 4. Market Factor Analysis
- 4.1. Porters Five Forces
- 4.1.1. Bargaining Power of Suppliers
- 4.1.2. Bargaining Power of Buyers
- 4.1.3. Threat of New Entrants
- 4.1.4. Threat of Substitutes
- 4.1.5. Competitive Rivalry
- 4.2. PESTEL analysis
- 4.3. BCG Analysis
- 4.3.1. Stars (High Growth, High Market Share)
- 4.3.2. Cash Cows (Low Growth, High Market Share)
- 4.3.3. Question Mark (High Growth, Low Market Share)
- 4.3.4. Dogs (Low Growth, Low Market Share)
- 4.4. Ansoff Matrix Analysis
- 4.5. Supply Chain Analysis
- 4.6. Regulatory Landscape
- 4.7. Current Market Potential and Opportunity Assessment (TAM–SAM–SOM Framework)
- 4.8. RAX Analyst Note
- 4.1. Porters Five Forces
- 5. Market Analysis, Insights and Forecast 2021-2033
- 5.1. Market Analysis, Insights and Forecast - by Print Process
- 5.1.1. Gravure
- 5.1.2. Flexography
- 5.1.3. Screen
- 5.1.4. Letterpress
- 5.1.5. Inkjet
- 5.1.6. Other Pr
- 5.2. Market Analysis, Insights and Forecast - by End-User Industry
- 5.2.1. Food
- 5.2.2. Beverage
- 5.2.3. Healthcare
- 5.2.4. Cosmetics
- 5.2.5. Household
- 5.2.6. Industri
- 5.2.7. Logistics
- 5.2.8. Other End-user Industries
- 5.3. Market Analysis, Insights and Forecast - by Region
- 5.3.1. North America
- 5.3.2. Europe
- 5.3.3. Asia Pacific
- 5.3.4. Latin America
- 5.3.5. Middle East and Africa
- 5.1. Market Analysis, Insights and Forecast - by Print Process
- 6. Global Pressure Labels Market Analysis, Insights and Forecast, 2021-2033
- 6.1. Market Analysis, Insights and Forecast - by Print Process
- 6.1.1. Gravure
- 6.1.2. Flexography
- 6.1.3. Screen
- 6.1.4. Letterpress
- 6.1.5. Inkjet
- 6.1.6. Other Pr
- 6.2. Market Analysis, Insights and Forecast - by End-User Industry
- 6.2.1. Food
- 6.2.2. Beverage
- 6.2.3. Healthcare
- 6.2.4. Cosmetics
- 6.2.5. Household
- 6.2.6. Industri
- 6.2.7. Logistics
- 6.2.8. Other End-user Industries
- 6.1. Market Analysis, Insights and Forecast - by Print Process
- 7. North America Pressure Labels Market Analysis, Insights and Forecast, 2020-2032
- 7.1. Market Analysis, Insights and Forecast - by Print Process
- 7.1.1. Gravure
- 7.1.2. Flexography
- 7.1.3. Screen
- 7.1.4. Letterpress
- 7.1.5. Inkjet
- 7.1.6. Other Pr
- 7.2. Market Analysis, Insights and Forecast - by End-User Industry
- 7.2.1. Food
- 7.2.2. Beverage
- 7.2.3. Healthcare
- 7.2.4. Cosmetics
- 7.2.5. Household
- 7.2.6. Industri
- 7.2.7. Logistics
- 7.2.8. Other End-user Industries
- 7.1. Market Analysis, Insights and Forecast - by Print Process
- 8. Europe Pressure Labels Market Analysis, Insights and Forecast, 2020-2032
- 8.1. Market Analysis, Insights and Forecast - by Print Process
- 8.1.1. Gravure
- 8.1.2. Flexography
- 8.1.3. Screen
- 8.1.4. Letterpress
- 8.1.5. Inkjet
- 8.1.6. Other Pr
- 8.2. Market Analysis, Insights and Forecast - by End-User Industry
- 8.2.1. Food
- 8.2.2. Beverage
- 8.2.3. Healthcare
- 8.2.4. Cosmetics
- 8.2.5. Household
- 8.2.6. Industri
- 8.2.7. Logistics
- 8.2.8. Other End-user Industries
- 8.1. Market Analysis, Insights and Forecast - by Print Process
- 9. Asia Pacific Pressure Labels Market Analysis, Insights and Forecast, 2020-2032
- 9.1. Market Analysis, Insights and Forecast - by Print Process
- 9.1.1. Gravure
- 9.1.2. Flexography
- 9.1.3. Screen
- 9.1.4. Letterpress
- 9.1.5. Inkjet
- 9.1.6. Other Pr
- 9.2. Market Analysis, Insights and Forecast - by End-User Industry
- 9.2.1. Food
- 9.2.2. Beverage
- 9.2.3. Healthcare
- 9.2.4. Cosmetics
- 9.2.5. Household
- 9.2.6. Industri
- 9.2.7. Logistics
- 9.2.8. Other End-user Industries
- 9.1. Market Analysis, Insights and Forecast - by Print Process
- 10. Latin America Pressure Labels Market Analysis, Insights and Forecast, 2020-2032
- 10.1. Market Analysis, Insights and Forecast - by Print Process
- 10.1.1. Gravure
- 10.1.2. Flexography
- 10.1.3. Screen
- 10.1.4. Letterpress
- 10.1.5. Inkjet
- 10.1.6. Other Pr
- 10.2. Market Analysis, Insights and Forecast - by End-User Industry
- 10.2.1. Food
- 10.2.2. Beverage
- 10.2.3. Healthcare
- 10.2.4. Cosmetics
- 10.2.5. Household
- 10.2.6. Industri
- 10.2.7. Logistics
- 10.2.8. Other End-user Industries
- 10.1. Market Analysis, Insights and Forecast - by Print Process
- 11. Middle East and Africa Pressure Labels Market Analysis, Insights and Forecast, 2020-2032
- 11.1. Market Analysis, Insights and Forecast - by Print Process
- 11.1.1. Gravure
- 11.1.2. Flexography
- 11.1.3. Screen
- 11.1.4. Letterpress
- 11.1.5. Inkjet
- 11.1.6. Other Pr
- 11.2. Market Analysis, Insights and Forecast - by End-User Industry
- 11.2.1. Food
- 11.2.2. Beverage
- 11.2.3. Healthcare
- 11.2.4. Cosmetics
- 11.2.5. Household
- 11.2.6. Industri
- 11.2.7. Logistics
- 11.2.8. Other End-user Industries
- 11.1. Market Analysis, Insights and Forecast - by Print Process
- 12. Competitive Analysis
- 12.1. Company Profiles
- 12.1.1 Fort Dearborn Company
- 12.1.1.1. Company Overview
- 12.1.1.2. Products
- 12.1.1.3. Company Financials
- 12.1.1.4. SWOT Analysis
- 12.1.2 Skanem AS*List Not Exhaustive
- 12.1.2.1. Company Overview
- 12.1.2.2. Products
- 12.1.2.3. Company Financials
- 12.1.2.4. SWOT Analysis
- 12.1.3 Constantia Flexibles Group GmbH
- 12.1.3.1. Company Overview
- 12.1.3.2. Products
- 12.1.3.3. Company Financials
- 12.1.3.4. SWOT Analysis
- 12.1.4 Herma GmbH
- 12.1.4.1. Company Overview
- 12.1.4.2. Products
- 12.1.4.3. Company Financials
- 12.1.4.4. SWOT Analysis
- 12.1.5 Coveris
- 12.1.5.1. Company Overview
- 12.1.5.2. Products
- 12.1.5.3. Company Financials
- 12.1.5.4. SWOT Analysis
- 12.1.6 Westrock Company
- 12.1.6.1. Company Overview
- 12.1.6.2. Products
- 12.1.6.3. Company Financials
- 12.1.6.4. SWOT Analysis
- 12.1.7 Inland Printing Co Ltd
- 12.1.7.1. Company Overview
- 12.1.7.2. Products
- 12.1.7.3. Company Financials
- 12.1.7.4. SWOT Analysis
- 12.1.8 UPM Raflatac Inc
- 12.1.8.1. Company Overview
- 12.1.8.2. Products
- 12.1.8.3. Company Financials
- 12.1.8.4. SWOT Analysis
- 12.1.9 Taylor Corporation
- 12.1.9.1. Company Overview
- 12.1.9.2. Products
- 12.1.9.3. Company Financials
- 12.1.9.4. SWOT Analysis
- 12.1.10 Huhtamaki Group
- 12.1.10.1. Company Overview
- 12.1.10.2. Products
- 12.1.10.3. Company Financials
- 12.1.10.4. SWOT Analysis
- 12.1.11 CCL Industries Inc
- 12.1.11.1. Company Overview
- 12.1.11.2. Products
- 12.1.11.3. Company Financials
- 12.1.11.4. SWOT Analysis
- 12.1.12 Avery Dennison Corp
- 12.1.12.1. Company Overview
- 12.1.12.2. Products
- 12.1.12.3. Company Financials
- 12.1.12.4. SWOT Analysis
- 12.1.13 Fuji Seal International Inc
- 12.1.13.1. Company Overview
- 12.1.13.2. Products
- 12.1.13.3. Company Financials
- 12.1.13.4. SWOT Analysis
- 12.1.14 Taghleef Industries Inc (Al Ghurair Group)
- 12.1.14.1. Company Overview
- 12.1.14.2. Products
- 12.1.14.3. Company Financials
- 12.1.14.4. SWOT Analysis
- 12.1.15 Multicolor Corporation
- 12.1.15.1. Company Overview
- 12.1.15.2. Products
- 12.1.15.3. Company Financials
- 12.1.15.4. SWOT Analysis
- 12.1.16 Folienprint RAKO GmbH
- 12.1.16.1. Company Overview
- 12.1.16.2. Products
- 12.1.16.3. Company Financials
- 12.1.16.4. SWOT Analysis
- 12.1.1 Fort Dearborn Company
- 12.2. Market Entropy
- 12.2.1 Company's Key Areas Served
- 12.2.2 Recent Developments
- 12.3. Company Market Share Analysis 2025
- 12.3.1 Top 5 Companies Market Share Analysis
- 12.3.2 Top 3 Companies Market Share Analysis
- 12.4. List of Potential Customers
- 13. Research Methodology
List of Figures
- Figure 1: Global Pressure Labels Market Revenue Breakdown (Million, %) by Region 2025 & 2033
- Figure 2: North America Pressure Labels Market Revenue (Million), by Print Process 2025 & 2033
- Figure 3: North America Pressure Labels Market Revenue Share (%), by Print Process 2025 & 2033
- Figure 4: North America Pressure Labels Market Revenue (Million), by End-User Industry 2025 & 2033
- Figure 5: North America Pressure Labels Market Revenue Share (%), by End-User Industry 2025 & 2033
- Figure 6: North America Pressure Labels Market Revenue (Million), by Country 2025 & 2033
- Figure 7: North America Pressure Labels Market Revenue Share (%), by Country 2025 & 2033
- Figure 8: Europe Pressure Labels Market Revenue (Million), by Print Process 2025 & 2033
- Figure 9: Europe Pressure Labels Market Revenue Share (%), by Print Process 2025 & 2033
- Figure 10: Europe Pressure Labels Market Revenue (Million), by End-User Industry 2025 & 2033
- Figure 11: Europe Pressure Labels Market Revenue Share (%), by End-User Industry 2025 & 2033
- Figure 12: Europe Pressure Labels Market Revenue (Million), by Country 2025 & 2033
- Figure 13: Europe Pressure Labels Market Revenue Share (%), by Country 2025 & 2033
- Figure 14: Asia Pacific Pressure Labels Market Revenue (Million), by Print Process 2025 & 2033
- Figure 15: Asia Pacific Pressure Labels Market Revenue Share (%), by Print Process 2025 & 2033
- Figure 16: Asia Pacific Pressure Labels Market Revenue (Million), by End-User Industry 2025 & 2033
- Figure 17: Asia Pacific Pressure Labels Market Revenue Share (%), by End-User Industry 2025 & 2033
- Figure 18: Asia Pacific Pressure Labels Market Revenue (Million), by Country 2025 & 2033
- Figure 19: Asia Pacific Pressure Labels Market Revenue Share (%), by Country 2025 & 2033
- Figure 20: Latin America Pressure Labels Market Revenue (Million), by Print Process 2025 & 2033
- Figure 21: Latin America Pressure Labels Market Revenue Share (%), by Print Process 2025 & 2033
- Figure 22: Latin America Pressure Labels Market Revenue (Million), by End-User Industry 2025 & 2033
- Figure 23: Latin America Pressure Labels Market Revenue Share (%), by End-User Industry 2025 & 2033
- Figure 24: Latin America Pressure Labels Market Revenue (Million), by Country 2025 & 2033
- Figure 25: Latin America Pressure Labels Market Revenue Share (%), by Country 2025 & 2033
- Figure 26: Middle East and Africa Pressure Labels Market Revenue (Million), by Print Process 2025 & 2033
- Figure 27: Middle East and Africa Pressure Labels Market Revenue Share (%), by Print Process 2025 & 2033
- Figure 28: Middle East and Africa Pressure Labels Market Revenue (Million), by End-User Industry 2025 & 2033
- Figure 29: Middle East and Africa Pressure Labels Market Revenue Share (%), by End-User Industry 2025 & 2033
- Figure 30: Middle East and Africa Pressure Labels Market Revenue (Million), by Country 2025 & 2033
- Figure 31: Middle East and Africa Pressure Labels Market Revenue Share (%), by Country 2025 & 2033
List of Tables
- Table 1: Global Pressure Labels Market Revenue Million Forecast, by Print Process 2020 & 2033
- Table 2: Global Pressure Labels Market Revenue Million Forecast, by End-User Industry 2020 & 2033
- Table 3: Global Pressure Labels Market Revenue Million Forecast, by Region 2020 & 2033
- Table 4: Global Pressure Labels Market Revenue Million Forecast, by Print Process 2020 & 2033
- Table 5: Global Pressure Labels Market Revenue Million Forecast, by End-User Industry 2020 & 2033
- Table 6: Global Pressure Labels Market Revenue Million Forecast, by Country 2020 & 2033
- Table 7: United States Pressure Labels Market Revenue (Million) Forecast, by Application 2020 & 2033
- Table 8: Canada Pressure Labels Market Revenue (Million) Forecast, by Application 2020 & 2033
- Table 9: Global Pressure Labels Market Revenue Million Forecast, by Print Process 2020 & 2033
- Table 10: Global Pressure Labels Market Revenue Million Forecast, by End-User Industry 2020 & 2033
- Table 11: Global Pressure Labels Market Revenue Million Forecast, by Country 2020 & 2033
- Table 12: United Kingdom Pressure Labels Market Revenue (Million) Forecast, by Application 2020 & 2033
- Table 13: Germany Pressure Labels Market Revenue (Million) Forecast, by Application 2020 & 2033
- Table 14: France Pressure Labels Market Revenue (Million) Forecast, by Application 2020 & 2033
- Table 15: Spain Pressure Labels Market Revenue (Million) Forecast, by Application 2020 & 2033
- Table 16: Rest of Europe Pressure Labels Market Revenue (Million) Forecast, by Application 2020 & 2033
- Table 17: Global Pressure Labels Market Revenue Million Forecast, by Print Process 2020 & 2033
- Table 18: Global Pressure Labels Market Revenue Million Forecast, by End-User Industry 2020 & 2033
- Table 19: Global Pressure Labels Market Revenue Million Forecast, by Country 2020 & 2033
- Table 20: China Pressure Labels Market Revenue (Million) Forecast, by Application 2020 & 2033
- Table 21: India Pressure Labels Market Revenue (Million) Forecast, by Application 2020 & 2033
- Table 22: Japan Pressure Labels Market Revenue (Million) Forecast, by Application 2020 & 2033
- Table 23: Rest of Asia Pacific Pressure Labels Market Revenue (Million) Forecast, by Application 2020 & 2033
- Table 24: Global Pressure Labels Market Revenue Million Forecast, by Print Process 2020 & 2033
- Table 25: Global Pressure Labels Market Revenue Million Forecast, by End-User Industry 2020 & 2033
- Table 26: Global Pressure Labels Market Revenue Million Forecast, by Country 2020 & 2033
- Table 27: Global Pressure Labels Market Revenue Million Forecast, by Print Process 2020 & 2033
- Table 28: Global Pressure Labels Market Revenue Million Forecast, by End-User Industry 2020 & 2033
- Table 29: Global Pressure Labels Market Revenue Million Forecast, by Country 2020 & 2033
Frequently Asked Questions
1. What is the projected Compound Annual Growth Rate (CAGR) of the Pressure Labels Market?
The projected CAGR is approximately > 4.19%.
2. Which companies are prominent players in the Pressure Labels Market?
Key companies in the market include Fort Dearborn Company, Skanem AS*List Not Exhaustive, Constantia Flexibles Group GmbH, Herma GmbH, Coveris, Westrock Company, Inland Printing Co Ltd, UPM Raflatac Inc, Taylor Corporation, Huhtamaki Group, CCL Industries Inc, Avery Dennison Corp, Fuji Seal International Inc, Taghleef Industries Inc (Al Ghurair Group), Multicolor Corporation, Folienprint RAKO GmbH.
3. What are the main segments of the Pressure Labels Market?
The market segments include Print Process, End-User Industry .
4. Can you provide details about the market size?
The market size is estimated to be USD 22.60 Million as of 2022.
5. What are some drivers contributing to market growth?
Evolution of Digital Print Technology.
6. What are the notable trends driving market growth?
Beverage End-User Segment is Expected to Drive Growth of Pressure Labels.
7. Are there any restraints impacting market growth?
Lack of Products with Ability to Withstand Harsh Climatic Conditions.
8. Can you provide examples of recent developments in the market?
December 2023 - Sentinel Capital Partners, a private equity firm that invests in midmarket companies, announced the recapitalization of Online Labels Group (OLG), one of the leading providers of pressure-sensitive labels, shrink sleeves, and flexible packaging solutions.
9. What pricing options are available for accessing the report?
Pricing options include single-user, multi-user, and enterprise licenses priced at USD 4750, USD 5250, and USD 8750 respectively.
10. Is the market size provided in terms of value or volume?
The market size is provided in terms of value, measured in Million.
11. Are there any specific market keywords associated with the report?
Yes, the market keyword associated with the report is "Pressure Labels Market," which aids in identifying and referencing the specific market segment covered.
12. How do I determine which pricing option suits my needs best?
The pricing options vary based on user requirements and access needs. Individual users may opt for single-user licenses, while businesses requiring broader access may choose multi-user or enterprise licenses for cost-effective access to the report.
13. Are there any additional resources or data provided in the Pressure Labels Market report?
While the report offers comprehensive insights, it's advisable to review the specific contents or supplementary materials provided to ascertain if additional resources or data are available.
14. How can I stay updated on further developments or reports in the Pressure Labels Market?
To stay informed about further developments, trends, and reports in the Pressure Labels Market, consider subscribing to industry newsletters, following relevant companies and organizations, or regularly checking reputable industry news sources and publications.
Methodology
Step 1 - Identification of Relevant Samples Size from Population Database


Step 2 - Approaches for Defining Global Market Size (Value, Volume* & Price*)

Note*: In applicable scenarios
Step 3 - Data Sources
Primary Research
- Web Analytics
- Survey Reports
- Research Institute
- Latest Research Reports
- Opinion Leaders
Secondary Research
- Annual Reports
- White Paper
- Latest Press Release
- Industry Association
- Paid Database
- Investor Presentations

Step 4 - Data Triangulation
Involves using different sources of information in order to increase the validity of a study
These sources are likely to be stakeholders in a program - participants, other researchers, program staff, other community members, and so on.
Then we put all data in single framework & apply various statistical tools to find out the dynamic on the market.
During the analysis stage, feedback from the stakeholder groups would be compared to determine areas of agreement as well as areas of divergence