Key Insights
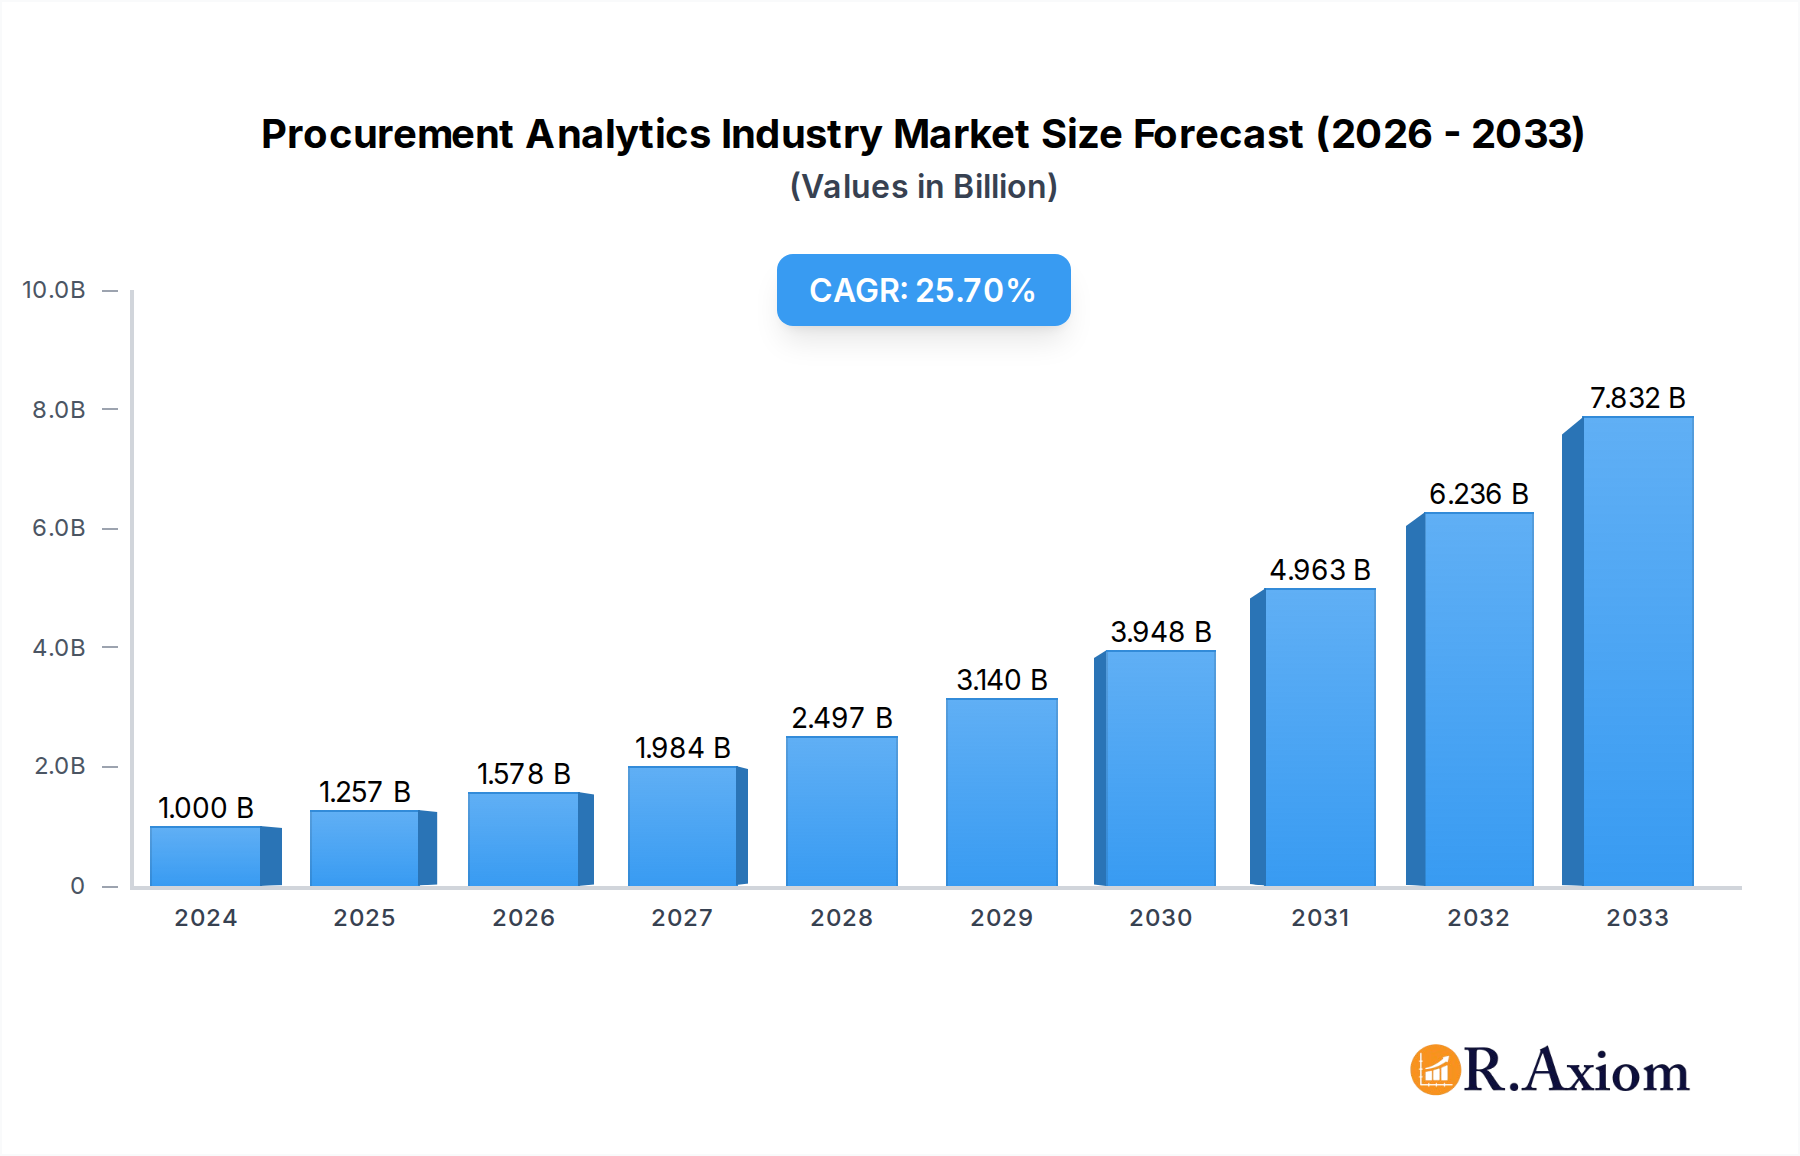
The Procurement Analytics market is experiencing robust expansion, projected to reach a substantial $4.17 million by 2033, fueled by an impressive Compound Annual Growth Rate (CAGR) of 25.67%. This dynamic growth is primarily driven by the escalating need for organizations across all sectors to optimize their spending, mitigate risks, and enhance supply chain efficiency. Businesses are increasingly leveraging advanced analytics to gain deeper insights into procurement processes, identify cost-saving opportunities, and improve supplier relationships. The burgeoning adoption of cloud-based solutions is a significant trend, offering scalability, flexibility, and cost-effectiveness for procurement analytics tools and services. Furthermore, the rising complexity of global supply chains and the constant threat of disruptions are compelling companies to invest in predictive analytics for demand forecasting and risk management.

Procurement Analytics Industry Market Size (In Billion)
The market segmentation highlights the diverse applications of procurement analytics, with Supply Chain Analytics, Risk Analytics, and Spend Analytics emerging as key areas of focus. Software solutions and professional services are both witnessing considerable demand, catering to the varied needs of businesses implementing these advanced capabilities. The manufacturing and transportation & logistics sectors are leading the adoption, recognizing the critical role of efficient procurement in their operational success. However, the market is not without its challenges. Data integration complexities, the need for skilled personnel to manage and interpret analytics, and concerns over data security and privacy can act as restraints. Despite these hurdles, the overarching benefits of enhanced visibility, improved decision-making, and increased operational efficiency are propelling the procurement analytics market forward, with significant opportunities present across all major regions.
Procurement Analytics Industry Company Market Share
Procurement Analytics Industry Market Concentration & Innovation
The procurement analytics market exhibits moderate concentration, with leading players like SAS Institute Inc, IBM Corporation, JAGGAER Inc, SAP SE, and Oracle Corporation holding significant market share, estimated to be around 65% combined. Innovation is primarily driven by advancements in Artificial Intelligence (AI) and Machine Learning (ML), enabling predictive analytics for demand forecasting and risk identification. Regulatory frameworks, particularly concerning data privacy and supply chain transparency, are becoming increasingly influential, shaping product development and market entry strategies. While direct product substitutes are limited, traditional manual procurement processes and generic business intelligence tools represent indirect competition. End-user adoption is escalating across manufacturing, BFSI, and retail sectors, fueled by the need for cost optimization and improved supplier management. Mergers and acquisitions (M&A) activity, with deal values reaching hundreds of millions of dollars annually, is a key trend, as larger players acquire innovative startups to expand their technology portfolios and market reach.
Procurement Analytics Industry Industry Trends & Insights
The procurement analytics industry is experiencing robust growth, projected to expand at a Compound Annual Growth Rate (CAGR) of approximately 15% from the base year 2025 to 2033. This expansion is propelled by a confluence of factors, most notably the increasing imperative for organizations to gain deeper insights into their spending patterns, identify cost-saving opportunities, and mitigate supply chain risks. The digital transformation wave sweeping across industries is a primary catalyst, compelling businesses to invest in advanced analytics solutions to optimize their procurement functions. Technological disruptions, including the integration of AI, ML, and blockchain, are revolutionizing how procurement data is collected, analyzed, and acted upon. AI-powered predictive models are enhancing demand forecasting accuracy, while ML algorithms are identifying potential supplier disruptions and fraud. Furthermore, the growing emphasis on sustainability and ethical sourcing is driving the demand for analytics that can track and verify supplier compliance. Consumer preferences are indirectly influencing this sector, as end-users demand greater transparency and faster delivery, pushing companies to streamline their supply chains through effective procurement analytics. The competitive landscape is characterized by intense innovation and strategic partnerships, with companies continuously striving to offer more comprehensive and user-friendly solutions. Market penetration of sophisticated procurement analytics tools is steadily increasing, especially within large enterprises, but significant growth potential remains in the small and medium-sized enterprise (SME) segment as cloud-based, more accessible solutions become prevalent. The ongoing evolution of data analytics capabilities, coupled with the increasing volume and complexity of procurement data, ensures a dynamic and expanding market for procurement analytics solutions. The base year 2025 is estimated to see a market size of over $10 Billion, with the forecast period set to witness exponential growth.
Dominant Markets & Segments in Procurement Analytics Industry
The procurement analytics industry showcases distinct dominance across various segments, driven by specific end-user needs and technological adoption rates.
Dominant Type: The Software segment currently leads the market, estimated to capture over 60% of the total market share in 2025. This dominance is attributed to the increasing availability of sophisticated, feature-rich procurement analytics platforms that offer comprehensive functionalities for spend analysis, risk management, and supplier performance tracking. Services, while crucial for implementation and support, follow with an estimated 35% market share.
Dominant Deployment Type: Cloud deployment is rapidly emerging as the preferred option, projected to account for approximately 70% of the market by 2033. Its scalability, flexibility, and cost-effectiveness, especially for SMEs, are key drivers. On-premise solutions, while still relevant for highly regulated industries, are expected to see a decline in market share.
Dominant Application: Spend Analytics stands as the most mature and widely adopted application, estimated to hold over 25% of the application market share. This is due to the direct and immediate ROI it offers in identifying cost-saving opportunities. Following closely are Supply Chain Analytics and Risk Analytics, each projected to grow significantly as businesses grapple with global supply chain disruptions and geopolitical uncertainties. Demand Forecasting and Contract Management are also critical, with substantial market shares.
Dominant End-User: The Manufacturing sector is a significant contributor, expected to represent over 20% of the market share. This is driven by the complexity of their supply chains, the need for precise inventory management, and the pursuit of operational efficiency. The BFSI sector also presents a strong market, driven by stringent regulatory compliance and the need for robust risk management. The Retail and E-commerce sector is experiencing rapid adoption due to the demand for agile supply chains and accurate demand forecasting in a highly competitive market.
Procurement Analytics Industry Product Developments
Product developments in the procurement analytics industry are characterized by the integration of advanced AI and ML capabilities to deliver predictive insights and automated decision-making. Innovations are focused on enhancing user experience through intuitive dashboards, real-time data visualization, and self-service analytics. Competitive advantages are being built around specialized modules for risk assessment, supplier risk scoring, and sustainability tracking. The market is witnessing the emergence of solutions that leverage natural language processing (NLP) for contract analysis and unstructured data interpretation, further streamlining procurement processes and uncovering hidden opportunities.
Report Scope & Segmentation Analysis
This report comprehensively analyzes the Procurement Analytics Industry across key segments:
- Type: Software and Services. The Software segment is expected to grow at a CAGR of approximately 16% from 2025–2033, driven by the continuous innovation in analytics platforms. Services, including consulting and implementation, will see a steady CAGR of around 12%.
- Deployment Type: On-Premise and Cloud. Cloud deployment is poised for rapid expansion with an estimated CAGR of 18%, outpacing on-premise solutions.
- Application: Supply Chain Analytics, Risk Analytics, Spend Analytics, Demand Forecasting, and Contract Management. Spend Analytics and Supply Chain Analytics are projected to be the largest segments in 2025, with Risk Analytics demonstrating the highest growth potential.
- End-User: Manufacturing, Transportation & Logistic, Retail and E-commerce, BFSI, IT & Telecommunication, and Other End-Users. Manufacturing and BFSI are expected to lead in terms of market share, while Retail and E-commerce will exhibit the fastest growth.
Key Drivers of Procurement Analytics Industry Growth
The procurement analytics industry's growth is propelled by several key drivers:
- Increased Demand for Cost Optimization: Organizations are under immense pressure to reduce operational costs, making data-driven procurement decisions essential.
- Supply Chain Volatility and Risk Mitigation: Global disruptions necessitate robust analytics to identify and manage supplier risks, ensuring business continuity.
- Digital Transformation Initiatives: The widespread adoption of digital technologies is creating a demand for integrated analytics solutions across all business functions.
- Advancements in AI and ML: These technologies are enhancing the predictive and prescriptive capabilities of procurement analytics platforms, offering deeper insights.
- Regulatory Compliance and ESG Initiatives: Growing focus on ethical sourcing, sustainability, and data privacy is driving the need for transparent and compliant procurement processes.
Challenges in the Procurement Analytics Industry Sector
Despite its robust growth, the procurement analytics industry faces several challenges:
- Data Quality and Integration: Inconsistent or poor-quality data from disparate sources can hinder the accuracy of analytics. Integrating legacy systems with new platforms also poses a significant hurdle.
- Talent Shortage: A lack of skilled professionals with expertise in data analytics, AI, and procurement is a restraining factor.
- Resistance to Change: Some organizations may face internal resistance to adopting new technologies and changing established procurement processes.
- Security and Privacy Concerns: Handling sensitive procurement data raises concerns about data security and compliance with various privacy regulations. The estimated cost of a major data breach can exceed $4 Million.
- High Implementation Costs: While cloud solutions are more accessible, comprehensive on-premise implementations can still involve substantial upfront investment.
Emerging Opportunities in Procurement Analytics Industry
The procurement analytics industry is ripe with emerging opportunities:
- Hyper-personalization of Procurement: Leveraging AI to tailor procurement strategies and supplier interactions based on individual client needs.
- Predictive Maintenance in Supply Chains: Utilizing analytics to predict equipment failures in logistics and manufacturing, minimizing downtime.
- Blockchain Integration for Transparency: Enhancing supply chain traceability and trust through blockchain-enabled analytics.
- AI-Powered Supplier Discovery and Onboarding: Automating the process of identifying, vetting, and onboarding new suppliers.
- Focus on Sustainability Analytics: Growing demand for tools that track and report on environmental, social, and governance (ESG) metrics within the supply chain.
- Expansion into Emerging Markets: Significant untapped potential in developing economies seeking to modernize their procurement practices.
Leading Players in the Procurement Analytics Industry Market
- SAS Institute Inc
- Simfoni Analytic
- IBM Corporation
- JAGGAER Inc
- BRIDGEi2i Analytics Solutions Pvt Ltd
- Rosslyn Data Technologies PLC
- Zycus Inc
- Oracle Corporation
- SAP SE
- Genpact Limited
Key Developments in Procurement Analytics Industry Industry
- October 2023: SAP announced that Tata Projects Limited, one of India's fastest-growing technology, engineering, procurement, and construction companies, is accelerating its business transformation journey by leveraging the RISE with SAP solutions and surrounding cloud solutions. This development signifies SAP's continued focus on enterprise-level cloud transformations in the procurement space.
- August 2022: SAS Institute Inc joined forces with SingleStore to help organizations remove barriers to data access, maximize performance and scalability, and uncover critical data-driven insights. SAS Viya with SingleStore enables using SAS analytics and AI technology on data stored in SingleStore's cloud-native real-time database. The integration provides flexible, open access to curated data to help accelerate value for cloud, hybrid, and on-premises deployments. This partnership highlights the trend of integrating advanced analytics with high-performance databases to unlock real-time insights.
Strategic Outlook for Procurement Analytics Industry Market
The strategic outlook for the procurement analytics industry is overwhelmingly positive, fueled by the continuous evolution of digital technologies and the persistent global drive for operational efficiency. The increasing reliance on data-driven decision-making, coupled with the growing complexity of global supply chains, positions procurement analytics as a critical strategic imperative for businesses across all sectors. Key growth catalysts include the ongoing advancements in AI and ML, which are enabling more sophisticated predictive and prescriptive analytics capabilities. The expanding adoption of cloud-based solutions will further democratize access to powerful analytics tools, particularly for SMEs. Opportunities for innovation lie in areas such as enhanced supplier risk management, sustainability tracking, and the integration of emerging technologies like blockchain. Strategic collaborations and M&A activities are expected to continue shaping the market landscape, leading to more comprehensive and integrated solutions that address the multifaceted challenges of modern procurement. The market is poised for sustained double-digit growth in the coming years.
Procurement Analytics Industry Segmentation
-
1. Type
- 1.1. Software
- 1.2. Services
-
2. Deployment Type
- 2.1. On-Premise
- 2.2. Cloud
-
3. Application
- 3.1. Supply Chain Analytics
- 3.2. Risk Analytics
- 3.3. Spend Analytics
- 3.4. Demand Forecasting
- 3.5. Contract Management
-
4. End-User
- 4.1. Manufacturing
- 4.2. Transportation & Logistic
- 4.3. Retail and E-commerce
- 4.4. BFSI
- 4.5. IT & Telecommunication
- 4.6. Other End-Users (Education, Healthcare)
Procurement Analytics Industry Segmentation By Geography
- 1. North America
- 2. Europe
- 3. Asia Pacific
- 4. Rest of the World
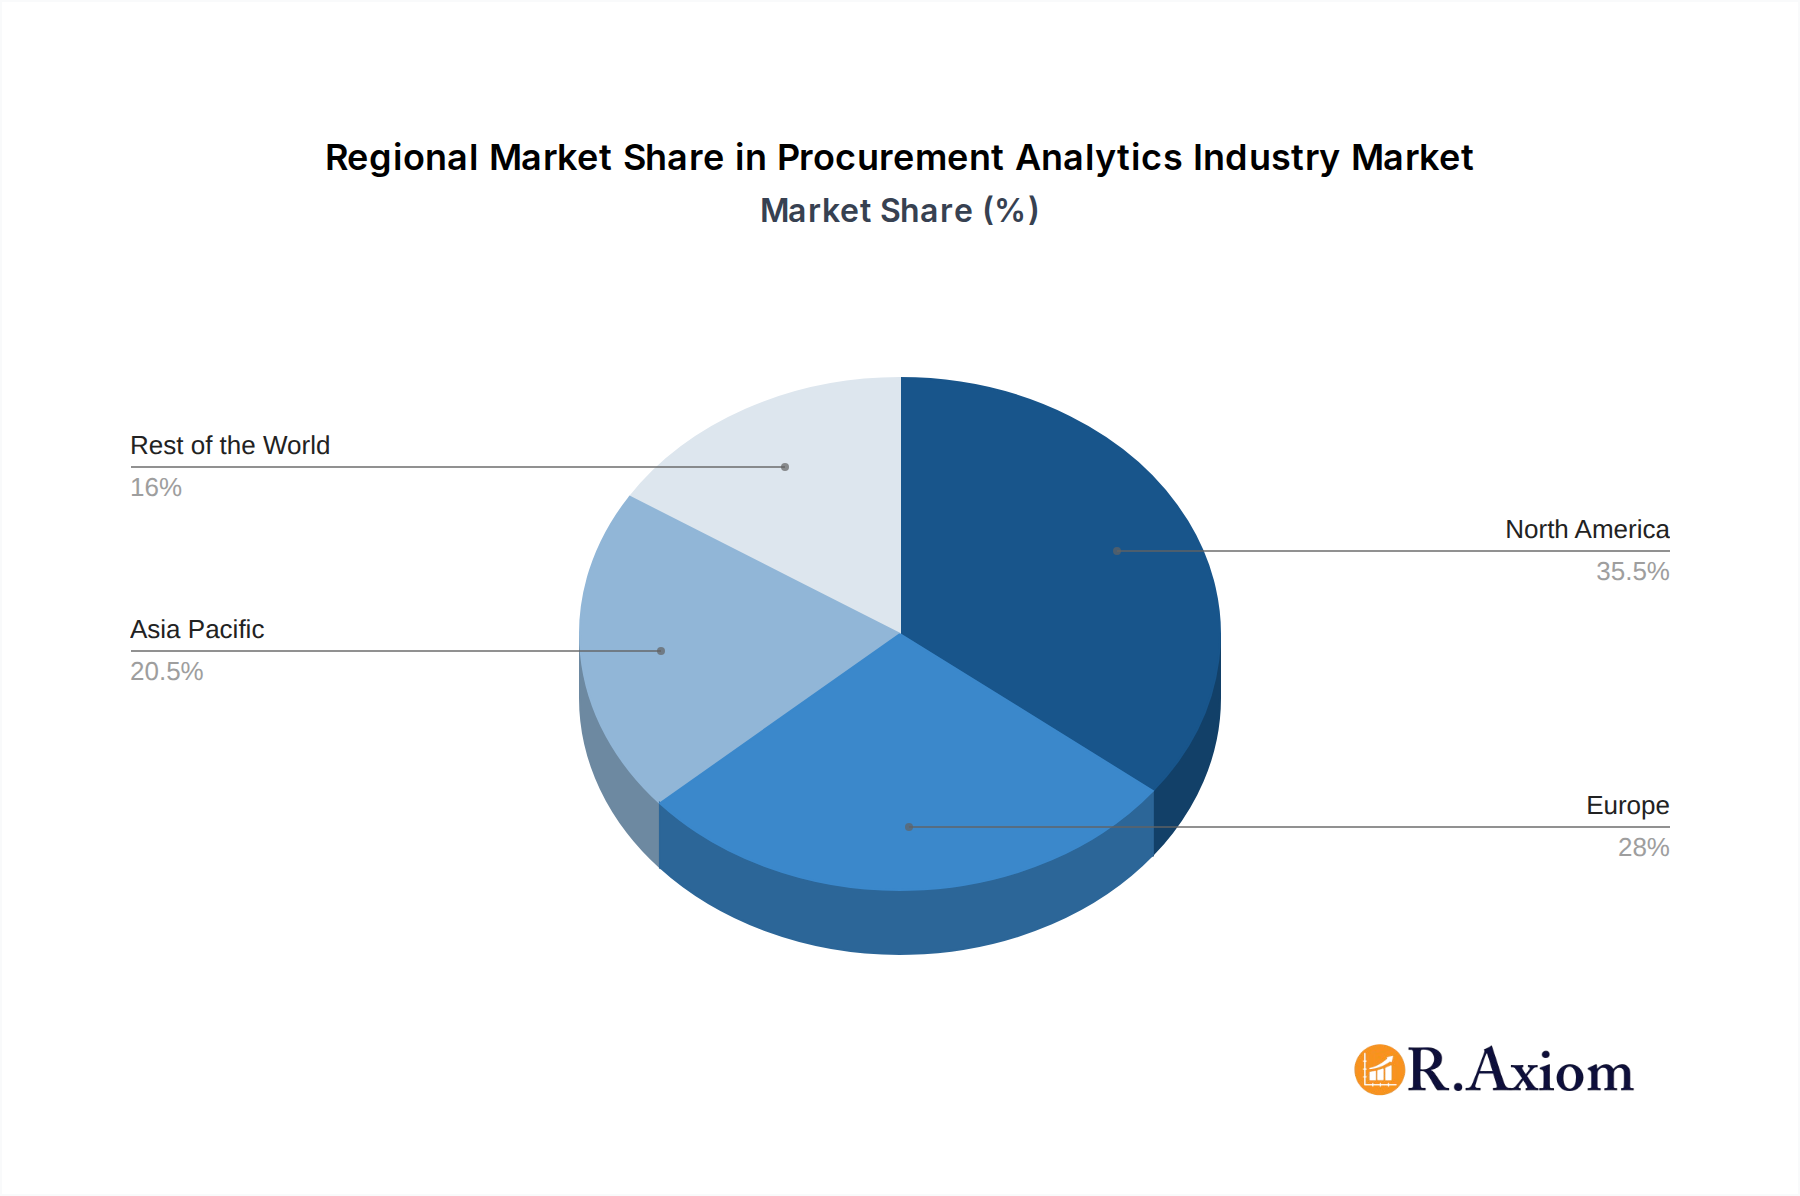
Procurement Analytics Industry Regional Market Share
Geographic Coverage of Procurement Analytics Industry
Procurement Analytics Industry REPORT HIGHLIGHTS
| Aspects | Details |
|---|---|
| Study Period | 2020-2034 |
| Base Year | 2025 |
| Estimated Year | 2026 |
| Forecast Period | 2026-2034 |
| Historical Period | 2020-2025 |
| Growth Rate | CAGR of 25.67% from 2020-2034 |
| Segmentation |
|
Table of Contents
- 1. Introduction
- 1.1. Research Scope
- 1.2. Market Segmentation
- 1.3. Research Objective
- 1.4. Definitions and Assumptions
- 2. Executive Summary
- 2.1. Market Snapshot
- 3. Market Dynamics
- 3.1. Market Drivers
- 3.2. Market Restrains
- 3.3. Market Trends
- 3.4. Market Opportunities
- 4. Market Factor Analysis
- 4.1. Porters Five Forces
- 4.1.1. Bargaining Power of Suppliers
- 4.1.2. Bargaining Power of Buyers
- 4.1.3. Threat of New Entrants
- 4.1.4. Threat of Substitutes
- 4.1.5. Competitive Rivalry
- 4.2. PESTEL analysis
- 4.3. BCG Analysis
- 4.3.1. Stars (High Growth, High Market Share)
- 4.3.2. Cash Cows (Low Growth, High Market Share)
- 4.3.3. Question Mark (High Growth, Low Market Share)
- 4.3.4. Dogs (Low Growth, Low Market Share)
- 4.4. Ansoff Matrix Analysis
- 4.5. Supply Chain Analysis
- 4.6. Regulatory Landscape
- 4.7. Current Market Potential and Opportunity Assessment (TAM–SAM–SOM Framework)
- 4.8. RAX Analyst Note
- 4.1. Porters Five Forces
- 5. Market Analysis, Insights and Forecast 2021-2033
- 5.1. Market Analysis, Insights and Forecast - by Type
- 5.1.1. Software
- 5.1.2. Services
- 5.2. Market Analysis, Insights and Forecast - by Deployment Type
- 5.2.1. On-Premise
- 5.2.2. Cloud
- 5.3. Market Analysis, Insights and Forecast - by Application
- 5.3.1. Supply Chain Analytics
- 5.3.2. Risk Analytics
- 5.3.3. Spend Analytics
- 5.3.4. Demand Forecasting
- 5.3.5. Contract Management
- 5.4. Market Analysis, Insights and Forecast - by End-User
- 5.4.1. Manufacturing
- 5.4.2. Transportation & Logistic
- 5.4.3. Retail and E-commerce
- 5.4.4. BFSI
- 5.4.5. IT & Telecommunication
- 5.4.6. Other End-Users (Education, Healthcare)
- 5.5. Market Analysis, Insights and Forecast - by Region
- 5.5.1. North America
- 5.5.2. Europe
- 5.5.3. Asia Pacific
- 5.5.4. Rest of the World
- 5.1. Market Analysis, Insights and Forecast - by Type
- 6. Global Procurement Analytics Industry Analysis, Insights and Forecast, 2021-2033
- 6.1. Market Analysis, Insights and Forecast - by Type
- 6.1.1. Software
- 6.1.2. Services
- 6.2. Market Analysis, Insights and Forecast - by Deployment Type
- 6.2.1. On-Premise
- 6.2.2. Cloud
- 6.3. Market Analysis, Insights and Forecast - by Application
- 6.3.1. Supply Chain Analytics
- 6.3.2. Risk Analytics
- 6.3.3. Spend Analytics
- 6.3.4. Demand Forecasting
- 6.3.5. Contract Management
- 6.4. Market Analysis, Insights and Forecast - by End-User
- 6.4.1. Manufacturing
- 6.4.2. Transportation & Logistic
- 6.4.3. Retail and E-commerce
- 6.4.4. BFSI
- 6.4.5. IT & Telecommunication
- 6.4.6. Other End-Users (Education, Healthcare)
- 6.1. Market Analysis, Insights and Forecast - by Type
- 7. North America Procurement Analytics Industry Analysis, Insights and Forecast, 2020-2032
- 7.1. Market Analysis, Insights and Forecast - by Type
- 7.1.1. Software
- 7.1.2. Services
- 7.2. Market Analysis, Insights and Forecast - by Deployment Type
- 7.2.1. On-Premise
- 7.2.2. Cloud
- 7.3. Market Analysis, Insights and Forecast - by Application
- 7.3.1. Supply Chain Analytics
- 7.3.2. Risk Analytics
- 7.3.3. Spend Analytics
- 7.3.4. Demand Forecasting
- 7.3.5. Contract Management
- 7.4. Market Analysis, Insights and Forecast - by End-User
- 7.4.1. Manufacturing
- 7.4.2. Transportation & Logistic
- 7.4.3. Retail and E-commerce
- 7.4.4. BFSI
- 7.4.5. IT & Telecommunication
- 7.4.6. Other End-Users (Education, Healthcare)
- 7.1. Market Analysis, Insights and Forecast - by Type
- 8. Europe Procurement Analytics Industry Analysis, Insights and Forecast, 2020-2032
- 8.1. Market Analysis, Insights and Forecast - by Type
- 8.1.1. Software
- 8.1.2. Services
- 8.2. Market Analysis, Insights and Forecast - by Deployment Type
- 8.2.1. On-Premise
- 8.2.2. Cloud
- 8.3. Market Analysis, Insights and Forecast - by Application
- 8.3.1. Supply Chain Analytics
- 8.3.2. Risk Analytics
- 8.3.3. Spend Analytics
- 8.3.4. Demand Forecasting
- 8.3.5. Contract Management
- 8.4. Market Analysis, Insights and Forecast - by End-User
- 8.4.1. Manufacturing
- 8.4.2. Transportation & Logistic
- 8.4.3. Retail and E-commerce
- 8.4.4. BFSI
- 8.4.5. IT & Telecommunication
- 8.4.6. Other End-Users (Education, Healthcare)
- 8.1. Market Analysis, Insights and Forecast - by Type
- 9. Asia Pacific Procurement Analytics Industry Analysis, Insights and Forecast, 2020-2032
- 9.1. Market Analysis, Insights and Forecast - by Type
- 9.1.1. Software
- 9.1.2. Services
- 9.2. Market Analysis, Insights and Forecast - by Deployment Type
- 9.2.1. On-Premise
- 9.2.2. Cloud
- 9.3. Market Analysis, Insights and Forecast - by Application
- 9.3.1. Supply Chain Analytics
- 9.3.2. Risk Analytics
- 9.3.3. Spend Analytics
- 9.3.4. Demand Forecasting
- 9.3.5. Contract Management
- 9.4. Market Analysis, Insights and Forecast - by End-User
- 9.4.1. Manufacturing
- 9.4.2. Transportation & Logistic
- 9.4.3. Retail and E-commerce
- 9.4.4. BFSI
- 9.4.5. IT & Telecommunication
- 9.4.6. Other End-Users (Education, Healthcare)
- 9.1. Market Analysis, Insights and Forecast - by Type
- 10. Rest of the World Procurement Analytics Industry Analysis, Insights and Forecast, 2020-2032
- 10.1. Market Analysis, Insights and Forecast - by Type
- 10.1.1. Software
- 10.1.2. Services
- 10.2. Market Analysis, Insights and Forecast - by Deployment Type
- 10.2.1. On-Premise
- 10.2.2. Cloud
- 10.3. Market Analysis, Insights and Forecast - by Application
- 10.3.1. Supply Chain Analytics
- 10.3.2. Risk Analytics
- 10.3.3. Spend Analytics
- 10.3.4. Demand Forecasting
- 10.3.5. Contract Management
- 10.4. Market Analysis, Insights and Forecast - by End-User
- 10.4.1. Manufacturing
- 10.4.2. Transportation & Logistic
- 10.4.3. Retail and E-commerce
- 10.4.4. BFSI
- 10.4.5. IT & Telecommunication
- 10.4.6. Other End-Users (Education, Healthcare)
- 10.1. Market Analysis, Insights and Forecast - by Type
- 11. Competitive Analysis
- 11.1. Company Profiles
- 11.1.1 SAS Institute Inc
- 11.1.1.1. Company Overview
- 11.1.1.2. Products
- 11.1.1.3. Company Financials
- 11.1.1.4. SWOT Analysis
- 11.1.2 Simfoni Analytic
- 11.1.2.1. Company Overview
- 11.1.2.2. Products
- 11.1.2.3. Company Financials
- 11.1.2.4. SWOT Analysis
- 11.1.3 IBM Corporation
- 11.1.3.1. Company Overview
- 11.1.3.2. Products
- 11.1.3.3. Company Financials
- 11.1.3.4. SWOT Analysis
- 11.1.4 JAGGAER Inc
- 11.1.4.1. Company Overview
- 11.1.4.2. Products
- 11.1.4.3. Company Financials
- 11.1.4.4. SWOT Analysis
- 11.1.5 BRIDGEi2i Analytics Solutions Pvt Ltd
- 11.1.5.1. Company Overview
- 11.1.5.2. Products
- 11.1.5.3. Company Financials
- 11.1.5.4. SWOT Analysis
- 11.1.6 Rosslyn Data Technologies PLC
- 11.1.6.1. Company Overview
- 11.1.6.2. Products
- 11.1.6.3. Company Financials
- 11.1.6.4. SWOT Analysis
- 11.1.7 Zycus Inc
- 11.1.7.1. Company Overview
- 11.1.7.2. Products
- 11.1.7.3. Company Financials
- 11.1.7.4. SWOT Analysis
- 11.1.8 Oracle Corporation
- 11.1.8.1. Company Overview
- 11.1.8.2. Products
- 11.1.8.3. Company Financials
- 11.1.8.4. SWOT Analysis
- 11.1.9 SAP SE
- 11.1.9.1. Company Overview
- 11.1.9.2. Products
- 11.1.9.3. Company Financials
- 11.1.9.4. SWOT Analysis
- 11.1.10 Genpact Limited
- 11.1.10.1. Company Overview
- 11.1.10.2. Products
- 11.1.10.3. Company Financials
- 11.1.10.4. SWOT Analysis
- 11.1.1 SAS Institute Inc
- 11.2. Market Entropy
- 11.2.1 Company's Key Areas Served
- 11.2.2 Recent Developments
- 11.3. Company Market Share Analysis 2025
- 11.3.1 Top 5 Companies Market Share Analysis
- 11.3.2 Top 3 Companies Market Share Analysis
- 11.4. List of Potential Customers
- 12. Research Methodology
List of Figures
- Figure 1: Global Procurement Analytics Industry Revenue Breakdown (Million, %) by Region 2025 & 2033
- Figure 2: North America Procurement Analytics Industry Revenue (Million), by Type 2025 & 2033
- Figure 3: North America Procurement Analytics Industry Revenue Share (%), by Type 2025 & 2033
- Figure 4: North America Procurement Analytics Industry Revenue (Million), by Deployment Type 2025 & 2033
- Figure 5: North America Procurement Analytics Industry Revenue Share (%), by Deployment Type 2025 & 2033
- Figure 6: North America Procurement Analytics Industry Revenue (Million), by Application 2025 & 2033
- Figure 7: North America Procurement Analytics Industry Revenue Share (%), by Application 2025 & 2033
- Figure 8: North America Procurement Analytics Industry Revenue (Million), by End-User 2025 & 2033
- Figure 9: North America Procurement Analytics Industry Revenue Share (%), by End-User 2025 & 2033
- Figure 10: North America Procurement Analytics Industry Revenue (Million), by Country 2025 & 2033
- Figure 11: North America Procurement Analytics Industry Revenue Share (%), by Country 2025 & 2033
- Figure 12: Europe Procurement Analytics Industry Revenue (Million), by Type 2025 & 2033
- Figure 13: Europe Procurement Analytics Industry Revenue Share (%), by Type 2025 & 2033
- Figure 14: Europe Procurement Analytics Industry Revenue (Million), by Deployment Type 2025 & 2033
- Figure 15: Europe Procurement Analytics Industry Revenue Share (%), by Deployment Type 2025 & 2033
- Figure 16: Europe Procurement Analytics Industry Revenue (Million), by Application 2025 & 2033
- Figure 17: Europe Procurement Analytics Industry Revenue Share (%), by Application 2025 & 2033
- Figure 18: Europe Procurement Analytics Industry Revenue (Million), by End-User 2025 & 2033
- Figure 19: Europe Procurement Analytics Industry Revenue Share (%), by End-User 2025 & 2033
- Figure 20: Europe Procurement Analytics Industry Revenue (Million), by Country 2025 & 2033
- Figure 21: Europe Procurement Analytics Industry Revenue Share (%), by Country 2025 & 2033
- Figure 22: Asia Pacific Procurement Analytics Industry Revenue (Million), by Type 2025 & 2033
- Figure 23: Asia Pacific Procurement Analytics Industry Revenue Share (%), by Type 2025 & 2033
- Figure 24: Asia Pacific Procurement Analytics Industry Revenue (Million), by Deployment Type 2025 & 2033
- Figure 25: Asia Pacific Procurement Analytics Industry Revenue Share (%), by Deployment Type 2025 & 2033
- Figure 26: Asia Pacific Procurement Analytics Industry Revenue (Million), by Application 2025 & 2033
- Figure 27: Asia Pacific Procurement Analytics Industry Revenue Share (%), by Application 2025 & 2033
- Figure 28: Asia Pacific Procurement Analytics Industry Revenue (Million), by End-User 2025 & 2033
- Figure 29: Asia Pacific Procurement Analytics Industry Revenue Share (%), by End-User 2025 & 2033
- Figure 30: Asia Pacific Procurement Analytics Industry Revenue (Million), by Country 2025 & 2033
- Figure 31: Asia Pacific Procurement Analytics Industry Revenue Share (%), by Country 2025 & 2033
- Figure 32: Rest of the World Procurement Analytics Industry Revenue (Million), by Type 2025 & 2033
- Figure 33: Rest of the World Procurement Analytics Industry Revenue Share (%), by Type 2025 & 2033
- Figure 34: Rest of the World Procurement Analytics Industry Revenue (Million), by Deployment Type 2025 & 2033
- Figure 35: Rest of the World Procurement Analytics Industry Revenue Share (%), by Deployment Type 2025 & 2033
- Figure 36: Rest of the World Procurement Analytics Industry Revenue (Million), by Application 2025 & 2033
- Figure 37: Rest of the World Procurement Analytics Industry Revenue Share (%), by Application 2025 & 2033
- Figure 38: Rest of the World Procurement Analytics Industry Revenue (Million), by End-User 2025 & 2033
- Figure 39: Rest of the World Procurement Analytics Industry Revenue Share (%), by End-User 2025 & 2033
- Figure 40: Rest of the World Procurement Analytics Industry Revenue (Million), by Country 2025 & 2033
- Figure 41: Rest of the World Procurement Analytics Industry Revenue Share (%), by Country 2025 & 2033
List of Tables
- Table 1: Global Procurement Analytics Industry Revenue Million Forecast, by Type 2020 & 2033
- Table 2: Global Procurement Analytics Industry Revenue Million Forecast, by Deployment Type 2020 & 2033
- Table 3: Global Procurement Analytics Industry Revenue Million Forecast, by Application 2020 & 2033
- Table 4: Global Procurement Analytics Industry Revenue Million Forecast, by End-User 2020 & 2033
- Table 5: Global Procurement Analytics Industry Revenue Million Forecast, by Region 2020 & 2033
- Table 6: Global Procurement Analytics Industry Revenue Million Forecast, by Type 2020 & 2033
- Table 7: Global Procurement Analytics Industry Revenue Million Forecast, by Deployment Type 2020 & 2033
- Table 8: Global Procurement Analytics Industry Revenue Million Forecast, by Application 2020 & 2033
- Table 9: Global Procurement Analytics Industry Revenue Million Forecast, by End-User 2020 & 2033
- Table 10: Global Procurement Analytics Industry Revenue Million Forecast, by Country 2020 & 2033
- Table 11: Global Procurement Analytics Industry Revenue Million Forecast, by Type 2020 & 2033
- Table 12: Global Procurement Analytics Industry Revenue Million Forecast, by Deployment Type 2020 & 2033
- Table 13: Global Procurement Analytics Industry Revenue Million Forecast, by Application 2020 & 2033
- Table 14: Global Procurement Analytics Industry Revenue Million Forecast, by End-User 2020 & 2033
- Table 15: Global Procurement Analytics Industry Revenue Million Forecast, by Country 2020 & 2033
- Table 16: Global Procurement Analytics Industry Revenue Million Forecast, by Type 2020 & 2033
- Table 17: Global Procurement Analytics Industry Revenue Million Forecast, by Deployment Type 2020 & 2033
- Table 18: Global Procurement Analytics Industry Revenue Million Forecast, by Application 2020 & 2033
- Table 19: Global Procurement Analytics Industry Revenue Million Forecast, by End-User 2020 & 2033
- Table 20: Global Procurement Analytics Industry Revenue Million Forecast, by Country 2020 & 2033
- Table 21: Global Procurement Analytics Industry Revenue Million Forecast, by Type 2020 & 2033
- Table 22: Global Procurement Analytics Industry Revenue Million Forecast, by Deployment Type 2020 & 2033
- Table 23: Global Procurement Analytics Industry Revenue Million Forecast, by Application 2020 & 2033
- Table 24: Global Procurement Analytics Industry Revenue Million Forecast, by End-User 2020 & 2033
- Table 25: Global Procurement Analytics Industry Revenue Million Forecast, by Country 2020 & 2033
Frequently Asked Questions
1. What is the projected Compound Annual Growth Rate (CAGR) of the Procurement Analytics Industry?
The projected CAGR is approximately 25.67%.
2. Which companies are prominent players in the Procurement Analytics Industry?
Key companies in the market include SAS Institute Inc, Simfoni Analytic, IBM Corporation, JAGGAER Inc, BRIDGEi2i Analytics Solutions Pvt Ltd, Rosslyn Data Technologies PLC, Zycus Inc, Oracle Corporation, SAP SE, Genpact Limited.
3. What are the main segments of the Procurement Analytics Industry?
The market segments include Type, Deployment Type, Application, End-User.
4. Can you provide details about the market size?
The market size is estimated to be USD 4.17 Million as of 2022.
5. What are some drivers contributing to market growth?
Rising Adoption in Procurement Process in Industries; Rising Demand for Cloud Based Analytical Solutions.
6. What are the notable trends driving market growth?
Retail and E-commerce Sector to Witness the Growth.
7. Are there any restraints impacting market growth?
Lack of Trained and Skilled Analytical Professionals; Growing Data Breaches Cases.
8. Can you provide examples of recent developments in the market?
October 2023: SAP announced that Tata Projects Limited, one of India's fastest-growing technology, engineering, procurement, and construction companies, is accelerating its business transformation journey by leveraging the RISE with SAP solutions and surrounding cloud solutions.
9. What pricing options are available for accessing the report?
Pricing options include single-user, multi-user, and enterprise licenses priced at USD 4750, USD 5250, and USD 8750 respectively.
10. Is the market size provided in terms of value or volume?
The market size is provided in terms of value, measured in Million.
11. Are there any specific market keywords associated with the report?
Yes, the market keyword associated with the report is "Procurement Analytics Industry," which aids in identifying and referencing the specific market segment covered.
12. How do I determine which pricing option suits my needs best?
The pricing options vary based on user requirements and access needs. Individual users may opt for single-user licenses, while businesses requiring broader access may choose multi-user or enterprise licenses for cost-effective access to the report.
13. Are there any additional resources or data provided in the Procurement Analytics Industry report?
While the report offers comprehensive insights, it's advisable to review the specific contents or supplementary materials provided to ascertain if additional resources or data are available.
14. How can I stay updated on further developments or reports in the Procurement Analytics Industry?
To stay informed about further developments, trends, and reports in the Procurement Analytics Industry, consider subscribing to industry newsletters, following relevant companies and organizations, or regularly checking reputable industry news sources and publications.
Methodology
Step 1 - Identification of Relevant Samples Size from Population Database


Step 2 - Approaches for Defining Global Market Size (Value, Volume* & Price*)

Note*: In applicable scenarios
Step 3 - Data Sources
Primary Research
- Web Analytics
- Survey Reports
- Research Institute
- Latest Research Reports
- Opinion Leaders
Secondary Research
- Annual Reports
- White Paper
- Latest Press Release
- Industry Association
- Paid Database
- Investor Presentations

Step 4 - Data Triangulation
Involves using different sources of information in order to increase the validity of a study
These sources are likely to be stakeholders in a program - participants, other researchers, program staff, other community members, and so on.
Then we put all data in single framework & apply various statistical tools to find out the dynamic on the market.
During the analysis stage, feedback from the stakeholder groups would be compared to determine areas of agreement as well as areas of divergence

