

Key Insights
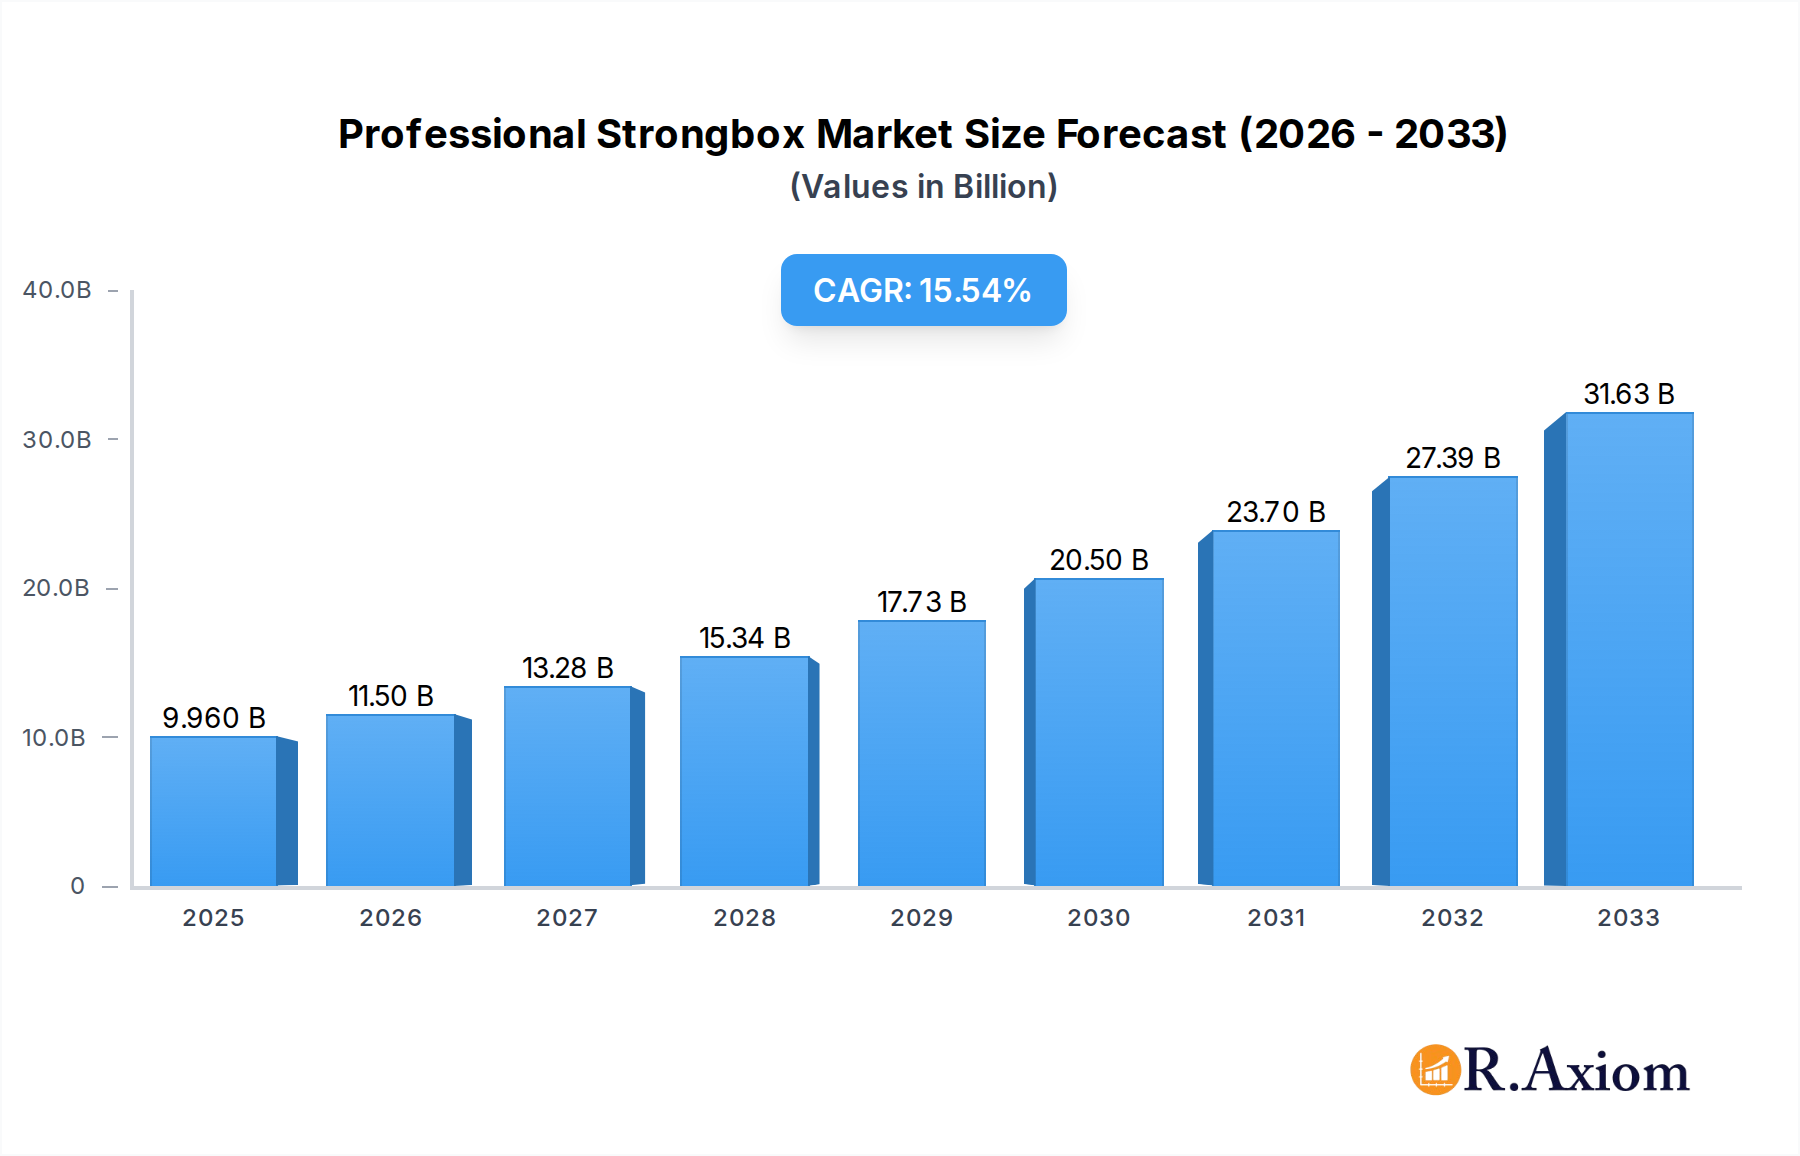
The Professional Strongbox market is projected for substantial expansion, anticipating a market size of $9.96 billion by 2025, with a robust Compound Annual Growth Rate (CAGR) of 15.42% from 2025 to 2033. This growth is driven by escalating demand for secure storage in financial institutions, retail, and jewelry sectors, fueled by increasing concerns over theft, data breaches, and regulatory compliance. Innovations in locking mechanisms, biometric security, and fire/water resistance are further enhancing product appeal. The market is segmented by application into Commercial Use and Home Use, with Commercial Use currently leading. Key product types include Mechanical Safes and Electric Safes, with electric variants gaining traction due to advanced features and user convenience.

Professional Strongbox Market Size (In Billion)
Evolving consumer awareness regarding asset protection and technological advancements are key market influencers. While high-net-worth households contribute to the Home Use segment's growth, the Commercial Use segment remains dominant. Geographically, North America and Europe lead, with the Asia Pacific region exhibiting significant growth potential due to economic development and rising property crime rates. Restraints include the high cost of premium strongboxes and the availability of lower-cost alternatives. However, the ongoing emphasis on enhanced security and continuous innovation by leading manufacturers are expected to sustain strong market momentum.
Professional Strongbox Company Market Share
This comprehensive report analyzes the global Professional Strongbox market, covering historical data, current trends, and future projections from 2019 to 2033, with a base year of 2025. It offers critical insights into market size, growth rates, competitive landscapes, and emerging opportunities across applications and product types. Key industry players, including AMSEC Safes, Liberty Safe, Gunnebo, and others, are profiled. The report details market dynamics across Commercial Use and Home Use applications, and Mechanical Safes and Electric Safes product categories.
Professional Strongbox Market Concentration & Innovation
The professional strongbox market exhibits a moderate level of concentration, with several key players holding significant market share. In the historical period (2019–2024), market share for leading companies has seen fluctuations, with estimated shares of approximately 15% to 20% held by the top three to five manufacturers. Innovation remains a critical driver, fueled by advancements in material science for enhanced security, biometric access technologies, and smart connectivity features. Regulatory frameworks, including UL certifications and local safety standards, are paramount, influencing product design and market entry. Product substitutes, such as advanced digital safes and vault services, pose a growing challenge. End-user trends are increasingly leaning towards integrated security systems and aesthetically pleasing designs for home use, alongside robust, high-capacity solutions for commercial applications. Mergers and acquisitions (M&A) activities, with estimated deal values in the range of several million to tens of millions, have been observed as companies seek to expand their product portfolios and geographical reach. For instance, the acquisition of smaller specialized safe manufacturers by larger conglomerates aims to consolidate market position.
Professional Strongbox Industry Trends & Insights
The professional strongbox industry is poised for significant growth, driven by a projected Compound Annual Growth Rate (CAGR) of approximately 5.5% from 2025 to 2033. This expansion is largely attributable to increasing global wealth, rising concerns over asset protection, and a growing awareness of the need for secure storage solutions for valuables, important documents, and firearms. Technological disruptions are continuously reshaping the market, with the integration of IoT capabilities, advanced locking mechanisms (biometric, electronic, and dual-lock systems), and enhanced fire and water resistance becoming standard features. Consumer preferences are evolving; while traditional mechanical safes continue to hold a niche for their simplicity and reliability, electric and smart safes are gaining substantial traction, particularly among younger demographics and for home applications where convenience and remote access are valued. The competitive dynamics are intense, with established brands investing heavily in research and development to maintain their edge and new entrants focusing on niche markets and disruptive technologies. Market penetration is expected to increase as strongboxes move beyond traditional commercial settings to become more integrated into smart home ecosystems and personal security strategies. The increasing prevalence of high-value personal assets, such as luxury watches, jewelry, and cryptocurrencies (requiring secure hardware wallets), further propels demand. Cybersecurity concerns also indirectly benefit the physical security sector, as individuals seek to protect digital assets from physical theft or damage.
Dominant Markets & Segments in Professional Strongbox
The global professional strongbox market is characterized by distinct dominant regions and segments. North America and Europe currently represent the largest markets, accounting for an estimated 60% of the global revenue. This dominance is driven by high disposable incomes, robust regulatory frameworks mandating secure storage for certain items, and a well-established culture of personal and business security.
- Leading Region: North America, with an estimated market share of 35%, leads due to factors such as high gun ownership rates (requiring firearm safes), a strong financial services sector, and a significant presence of high-net-worth individuals.
- Leading Country: The United States, within North America, holds the largest share, propelled by a vast consumer base and a strong demand from both residential and commercial sectors.
Within the application segments:
- Commercial Use: This segment is a significant revenue generator, estimated to contribute approximately 55% of the total market value. Key drivers include:
- Economic Policies: Stringent regulations for storing cash, sensitive documents, and high-value assets in businesses, financial institutions, and retail environments.
- Infrastructure: Development of secure storage facilities for banks, jewelry stores, pharmacies, and government offices.
- Crime Rates: Rising crime rates in urban areas necessitate enhanced physical security for businesses.
- Home Use: This segment is experiencing rapid growth, with an estimated CAGR of 6.2%. Key drivers include:
- Consumer Preferences: Increasing desire for personal asset protection, including jewelry, cash, important documents, and firearms.
- Smart Home Integration: Demand for smart safes that can be integrated with home security systems and accessed remotely.
- Awareness: Growing public awareness of the benefits of home safes due to media coverage of burglaries and property crime.
In terms of product types:
- Electric Safe: This type is projected to witness the highest growth, with an estimated CAGR of 7.0%, driven by user convenience, advanced features, and integration with smart technology.
- Mechanical Safe: While traditional, mechanical safes continue to hold a substantial market share, valued for their durability, reliability, and independence from power sources. Their market is expected to grow steadily, albeit at a slower pace than electric safes.
Professional Strongbox Product Developments
Product innovation in the professional strongbox sector is rapidly evolving. Manufacturers are increasingly integrating advanced biometric authentication systems (fingerprint, iris scanners) for enhanced security and user-friendliness, alongside digital keypads and dual-locking mechanisms. Smart connectivity features, allowing remote monitoring, access logs, and emergency alerts via smartphone applications, are becoming a key competitive advantage. Fire and water resistance ratings are being improved to offer greater protection against environmental threats. These developments cater to a growing demand for sophisticated, integrated security solutions that combine robust physical protection with modern technological convenience, ensuring market fit for both commercial and discerning home users.
Report Scope & Segmentation Analysis
This report meticulously segments the professional strongbox market to provide granular insights. The segmentation includes:
Application:
- Commercial Use: This segment, projected to reach a market size of approximately $5,500 million by 2033, is driven by the need for secure storage in financial institutions, retail, hospitality, and government sectors. Competitive dynamics are shaped by reliability, capacity, and regulatory compliance.
- Home Use: Expected to grow at a CAGR of 6.2%, this segment will reach an estimated $4,000 million by 2033. The increasing adoption of smart home technology and a rising awareness of personal security are key growth catalysts, with a focus on user-friendly interfaces and aesthetic appeal.
Types:
- Mechanical Safe: This segment, estimated at $3,000 million in 2033, continues to be a reliable choice, particularly for settings where power outages are a concern. Growth is steady, driven by durability and cost-effectiveness.
- Electric Safe: Projected to experience robust growth with a CAGR of 7.0%, reaching an estimated $6,500 million by 2033. This segment benefits from advanced features, digital interfaces, and smart connectivity, appealing to a tech-savvy consumer base.
Key Drivers of Professional Strongbox Growth
Several factors are propelling the growth of the professional strongbox market. Economically, rising global wealth and increasing ownership of high-value assets necessitate secure storage solutions. Technologically, advancements in biometric access, smart connectivity, and improved material science offer enhanced security and user experience. Regulatory frameworks, mandating the secure storage of firearms, cash, and sensitive documents, further boost demand, particularly in commercial sectors. The increasing integration of strongboxes into smart home ecosystems is also a significant growth catalyst.
Challenges in the Professional Strongbox Sector
Despite the positive outlook, the professional strongbox sector faces several challenges. Regulatory hurdles can arise from differing international standards and compliance requirements. Supply chain disruptions, as experienced globally in recent years, can impact manufacturing and material availability, leading to price volatility. Intense competitive pressures from both established brands and emerging players can squeeze profit margins. Furthermore, the perceived high cost of premium strongboxes for some consumer segments and the growing availability of digital asset security solutions present ongoing restraints to market expansion.
Emerging Opportunities in Professional Strongbox
Emerging opportunities abound in the professional strongbox market. The growing demand for specialized safes, such as those designed for cryptocurrency hardware wallets, presents a new lucrative niche. Expansion into emerging economies with rapidly developing financial sectors and increasing disposable incomes offers significant untapped potential. The integration of stronger cybersecurity features within smart safes to protect against remote hacking is another critical area for innovation and market growth. Furthermore, the development of more sustainable and eco-friendly manufacturing processes could attract environmentally conscious consumers and businesses.
Leading Players in the Professional Strongbox Market
- AMSEC Safes
- Liberty Safe
- Boca do Lobo
- Buben&Zorweg
- Casoro Jewelry Safes
- Stockinger Safe
- Phoenix Safe
- SentrySafe
- Nika Safe
- Yale Safe
- Lucell
- Diplomat Safe
- Gunnebo
- Agresti
- Brown Safe
- First Alert
- Godrej & Boyce
- Kaba Group
- Cannon Safe
- Honeywell
- Aipu
- Weidunsi
- Hebei Hupai
- Deli
Key Developments in Professional Strongbox Industry
- 2023: Launch of advanced biometric fingerprint scanners with enhanced accuracy and speed in high-security home safes.
- 2022: Introduction of smart safes with integrated IoT capabilities for remote monitoring and app-based access control by multiple manufacturers.
- 2021: Increased focus on fire and water resistance ratings, with several brands achieving higher protection certifications.
- 2020: Mergers and acquisitions among smaller specialized safe manufacturers to consolidate market share and expand product lines.
- 2019: Development of aesthetically designed jewelry safes and luxury strongboxes targeting the high-end home market.
Strategic Outlook for Professional Strongbox Market
The strategic outlook for the professional strongbox market is highly positive, driven by an increasing global emphasis on security and asset protection. Future growth will be catalyzed by the continued integration of smart technologies, catering to the demand for convenience and enhanced control. Manufacturers that can innovate with advanced security features, robust construction, and user-friendly interfaces will be well-positioned for success. The expansion into emerging markets and the development of niche products, such as specialized digital asset safes, represent significant opportunities for market players to capture new revenue streams and maintain a competitive edge in this dynamic and essential industry.
Professional Strongbox Segmentation
-
1. Application
- 1.1. Commercial Use
- 1.2. Home Use
-
2. Types
- 2.1. Mechanical Safe
- 2.2. Electric Safe
Professional Strongbox Segmentation By Geography
-
1. North America
- 1.1. United States
- 1.2. Canada
- 1.3. Mexico
-
2. South America
- 2.1. Brazil
- 2.2. Argentina
- 2.3. Rest of South America
-
3. Europe
- 3.1. United Kingdom
- 3.2. Germany
- 3.3. France
- 3.4. Italy
- 3.5. Spain
- 3.6. Russia
- 3.7. Benelux
- 3.8. Nordics
- 3.9. Rest of Europe
-
4. Middle East & Africa
- 4.1. Turkey
- 4.2. Israel
- 4.3. GCC
- 4.4. North Africa
- 4.5. South Africa
- 4.6. Rest of Middle East & Africa
-
5. Asia Pacific
- 5.1. China
- 5.2. India
- 5.3. Japan
- 5.4. South Korea
- 5.5. ASEAN
- 5.6. Oceania
- 5.7. Rest of Asia Pacific

Professional Strongbox Regional Market Share
Geographic Coverage of Professional Strongbox
Professional Strongbox REPORT HIGHLIGHTS
| Aspects | Details |
|---|---|
| Study Period | 2020-2034 |
| Base Year | 2025 |
| Estimated Year | 2026 |
| Forecast Period | 2026-2034 |
| Historical Period | 2020-2025 |
| Growth Rate | CAGR of 15.42% from 2020-2034 |
| Segmentation |
|
Table of Contents
- 1. Introduction
- 1.1. Research Scope
- 1.2. Market Segmentation
- 1.3. Research Objective
- 1.4. Definitions and Assumptions
- 2. Executive Summary
- 2.1. Market Snapshot
- 3. Market Dynamics
- 3.1. Market Drivers
- 3.2. Market Restrains
- 3.3. Market Trends
- 3.4. Market Opportunities
- 4. Market Factor Analysis
- 4.1. Porters Five Forces
- 4.1.1. Bargaining Power of Suppliers
- 4.1.2. Bargaining Power of Buyers
- 4.1.3. Threat of New Entrants
- 4.1.4. Threat of Substitutes
- 4.1.5. Competitive Rivalry
- 4.2. PESTEL analysis
- 4.3. BCG Analysis
- 4.3.1. Stars (High Growth, High Market Share)
- 4.3.2. Cash Cows (Low Growth, High Market Share)
- 4.3.3. Question Mark (High Growth, Low Market Share)
- 4.3.4. Dogs (Low Growth, Low Market Share)
- 4.4. Ansoff Matrix Analysis
- 4.5. Supply Chain Analysis
- 4.6. Regulatory Landscape
- 4.7. Current Market Potential and Opportunity Assessment (TAM–SAM–SOM Framework)
- 4.8. RAX Analyst Note
- 4.1. Porters Five Forces
- 5. Market Analysis, Insights and Forecast 2021-2033
- 5.1. Market Analysis, Insights and Forecast - by Application
- 5.1.1. Commercial Use
- 5.1.2. Home Use
- 5.2. Market Analysis, Insights and Forecast - by Types
- 5.2.1. Mechanical Safe
- 5.2.2. Electric Safe
- 5.3. Market Analysis, Insights and Forecast - by Region
- 5.3.1. North America
- 5.3.2. South America
- 5.3.3. Europe
- 5.3.4. Middle East & Africa
- 5.3.5. Asia Pacific
- 5.1. Market Analysis, Insights and Forecast - by Application
- 6. Global Professional Strongbox Analysis, Insights and Forecast, 2021-2033
- 6.1. Market Analysis, Insights and Forecast - by Application
- 6.1.1. Commercial Use
- 6.1.2. Home Use
- 6.2. Market Analysis, Insights and Forecast - by Types
- 6.2.1. Mechanical Safe
- 6.2.2. Electric Safe
- 6.1. Market Analysis, Insights and Forecast - by Application
- 7. North America Professional Strongbox Analysis, Insights and Forecast, 2020-2032
- 7.1. Market Analysis, Insights and Forecast - by Application
- 7.1.1. Commercial Use
- 7.1.2. Home Use
- 7.2. Market Analysis, Insights and Forecast - by Types
- 7.2.1. Mechanical Safe
- 7.2.2. Electric Safe
- 7.1. Market Analysis, Insights and Forecast - by Application
- 8. South America Professional Strongbox Analysis, Insights and Forecast, 2020-2032
- 8.1. Market Analysis, Insights and Forecast - by Application
- 8.1.1. Commercial Use
- 8.1.2. Home Use
- 8.2. Market Analysis, Insights and Forecast - by Types
- 8.2.1. Mechanical Safe
- 8.2.2. Electric Safe
- 8.1. Market Analysis, Insights and Forecast - by Application
- 9. Europe Professional Strongbox Analysis, Insights and Forecast, 2020-2032
- 9.1. Market Analysis, Insights and Forecast - by Application
- 9.1.1. Commercial Use
- 9.1.2. Home Use
- 9.2. Market Analysis, Insights and Forecast - by Types
- 9.2.1. Mechanical Safe
- 9.2.2. Electric Safe
- 9.1. Market Analysis, Insights and Forecast - by Application
- 10. Middle East & Africa Professional Strongbox Analysis, Insights and Forecast, 2020-2032
- 10.1. Market Analysis, Insights and Forecast - by Application
- 10.1.1. Commercial Use
- 10.1.2. Home Use
- 10.2. Market Analysis, Insights and Forecast - by Types
- 10.2.1. Mechanical Safe
- 10.2.2. Electric Safe
- 10.1. Market Analysis, Insights and Forecast - by Application
- 11. Asia Pacific Professional Strongbox Analysis, Insights and Forecast, 2020-2032
- 11.1. Market Analysis, Insights and Forecast - by Application
- 11.1.1. Commercial Use
- 11.1.2. Home Use
- 11.2. Market Analysis, Insights and Forecast - by Types
- 11.2.1. Mechanical Safe
- 11.2.2. Electric Safe
- 11.1. Market Analysis, Insights and Forecast - by Application
- 12. Competitive Analysis
- 12.1. Company Profiles
- 12.1.1 AMSEC Safes
- 12.1.1.1. Company Overview
- 12.1.1.2. Products
- 12.1.1.3. Company Financials
- 12.1.1.4. SWOT Analysis
- 12.1.2 Liberty Safe
- 12.1.2.1. Company Overview
- 12.1.2.2. Products
- 12.1.2.3. Company Financials
- 12.1.2.4. SWOT Analysis
- 12.1.3 Boca do Lobo
- 12.1.3.1. Company Overview
- 12.1.3.2. Products
- 12.1.3.3. Company Financials
- 12.1.3.4. SWOT Analysis
- 12.1.4 Buben&Zorweg
- 12.1.4.1. Company Overview
- 12.1.4.2. Products
- 12.1.4.3. Company Financials
- 12.1.4.4. SWOT Analysis
- 12.1.5 Casoro Jewelry Safes
- 12.1.5.1. Company Overview
- 12.1.5.2. Products
- 12.1.5.3. Company Financials
- 12.1.5.4. SWOT Analysis
- 12.1.6 Stockinger Safe
- 12.1.6.1. Company Overview
- 12.1.6.2. Products
- 12.1.6.3. Company Financials
- 12.1.6.4. SWOT Analysis
- 12.1.7 Phoenix Safe
- 12.1.7.1. Company Overview
- 12.1.7.2. Products
- 12.1.7.3. Company Financials
- 12.1.7.4. SWOT Analysis
- 12.1.8 SentrySafe
- 12.1.8.1. Company Overview
- 12.1.8.2. Products
- 12.1.8.3. Company Financials
- 12.1.8.4. SWOT Analysis
- 12.1.9 Nika Safe
- 12.1.9.1. Company Overview
- 12.1.9.2. Products
- 12.1.9.3. Company Financials
- 12.1.9.4. SWOT Analysis
- 12.1.10 Yale Safe
- 12.1.10.1. Company Overview
- 12.1.10.2. Products
- 12.1.10.3. Company Financials
- 12.1.10.4. SWOT Analysis
- 12.1.11 Lucell
- 12.1.11.1. Company Overview
- 12.1.11.2. Products
- 12.1.11.3. Company Financials
- 12.1.11.4. SWOT Analysis
- 12.1.12 Diplomat Safe
- 12.1.12.1. Company Overview
- 12.1.12.2. Products
- 12.1.12.3. Company Financials
- 12.1.12.4. SWOT Analysis
- 12.1.13 Gunnebo
- 12.1.13.1. Company Overview
- 12.1.13.2. Products
- 12.1.13.3. Company Financials
- 12.1.13.4. SWOT Analysis
- 12.1.14 Agresti
- 12.1.14.1. Company Overview
- 12.1.14.2. Products
- 12.1.14.3. Company Financials
- 12.1.14.4. SWOT Analysis
- 12.1.15 Brown Safe
- 12.1.15.1. Company Overview
- 12.1.15.2. Products
- 12.1.15.3. Company Financials
- 12.1.15.4. SWOT Analysis
- 12.1.16 First Alert
- 12.1.16.1. Company Overview
- 12.1.16.2. Products
- 12.1.16.3. Company Financials
- 12.1.16.4. SWOT Analysis
- 12.1.17 Godrej & Boyce
- 12.1.17.1. Company Overview
- 12.1.17.2. Products
- 12.1.17.3. Company Financials
- 12.1.17.4. SWOT Analysis
- 12.1.18 Kaba Group
- 12.1.18.1. Company Overview
- 12.1.18.2. Products
- 12.1.18.3. Company Financials
- 12.1.18.4. SWOT Analysis
- 12.1.19 Cannon Safe
- 12.1.19.1. Company Overview
- 12.1.19.2. Products
- 12.1.19.3. Company Financials
- 12.1.19.4. SWOT Analysis
- 12.1.20 Honeywell
- 12.1.20.1. Company Overview
- 12.1.20.2. Products
- 12.1.20.3. Company Financials
- 12.1.20.4. SWOT Analysis
- 12.1.21 Aipu
- 12.1.21.1. Company Overview
- 12.1.21.2. Products
- 12.1.21.3. Company Financials
- 12.1.21.4. SWOT Analysis
- 12.1.22 Weidunsi
- 12.1.22.1. Company Overview
- 12.1.22.2. Products
- 12.1.22.3. Company Financials
- 12.1.22.4. SWOT Analysis
- 12.1.23 Hebei Hupai
- 12.1.23.1. Company Overview
- 12.1.23.2. Products
- 12.1.23.3. Company Financials
- 12.1.23.4. SWOT Analysis
- 12.1.24 Deli
- 12.1.24.1. Company Overview
- 12.1.24.2. Products
- 12.1.24.3. Company Financials
- 12.1.24.4. SWOT Analysis
- 12.1.1 AMSEC Safes
- 12.2. Market Entropy
- 12.2.1 Company's Key Areas Served
- 12.2.2 Recent Developments
- 12.3. Company Market Share Analysis 2025
- 12.3.1 Top 5 Companies Market Share Analysis
- 12.3.2 Top 3 Companies Market Share Analysis
- 12.4. List of Potential Customers
- 13. Research Methodology
List of Figures
- Figure 1: Global Professional Strongbox Revenue Breakdown (billion, %) by Region 2025 & 2033
- Figure 2: Global Professional Strongbox Volume Breakdown (K, %) by Region 2025 & 2033
- Figure 3: North America Professional Strongbox Revenue (billion), by Application 2025 & 2033
- Figure 4: North America Professional Strongbox Volume (K), by Application 2025 & 2033
- Figure 5: North America Professional Strongbox Revenue Share (%), by Application 2025 & 2033
- Figure 6: North America Professional Strongbox Volume Share (%), by Application 2025 & 2033
- Figure 7: North America Professional Strongbox Revenue (billion), by Types 2025 & 2033
- Figure 8: North America Professional Strongbox Volume (K), by Types 2025 & 2033
- Figure 9: North America Professional Strongbox Revenue Share (%), by Types 2025 & 2033
- Figure 10: North America Professional Strongbox Volume Share (%), by Types 2025 & 2033
- Figure 11: North America Professional Strongbox Revenue (billion), by Country 2025 & 2033
- Figure 12: North America Professional Strongbox Volume (K), by Country 2025 & 2033
- Figure 13: North America Professional Strongbox Revenue Share (%), by Country 2025 & 2033
- Figure 14: North America Professional Strongbox Volume Share (%), by Country 2025 & 2033
- Figure 15: South America Professional Strongbox Revenue (billion), by Application 2025 & 2033
- Figure 16: South America Professional Strongbox Volume (K), by Application 2025 & 2033
- Figure 17: South America Professional Strongbox Revenue Share (%), by Application 2025 & 2033
- Figure 18: South America Professional Strongbox Volume Share (%), by Application 2025 & 2033
- Figure 19: South America Professional Strongbox Revenue (billion), by Types 2025 & 2033
- Figure 20: South America Professional Strongbox Volume (K), by Types 2025 & 2033
- Figure 21: South America Professional Strongbox Revenue Share (%), by Types 2025 & 2033
- Figure 22: South America Professional Strongbox Volume Share (%), by Types 2025 & 2033
- Figure 23: South America Professional Strongbox Revenue (billion), by Country 2025 & 2033
- Figure 24: South America Professional Strongbox Volume (K), by Country 2025 & 2033
- Figure 25: South America Professional Strongbox Revenue Share (%), by Country 2025 & 2033
- Figure 26: South America Professional Strongbox Volume Share (%), by Country 2025 & 2033
- Figure 27: Europe Professional Strongbox Revenue (billion), by Application 2025 & 2033
- Figure 28: Europe Professional Strongbox Volume (K), by Application 2025 & 2033
- Figure 29: Europe Professional Strongbox Revenue Share (%), by Application 2025 & 2033
- Figure 30: Europe Professional Strongbox Volume Share (%), by Application 2025 & 2033
- Figure 31: Europe Professional Strongbox Revenue (billion), by Types 2025 & 2033
- Figure 32: Europe Professional Strongbox Volume (K), by Types 2025 & 2033
- Figure 33: Europe Professional Strongbox Revenue Share (%), by Types 2025 & 2033
- Figure 34: Europe Professional Strongbox Volume Share (%), by Types 2025 & 2033
- Figure 35: Europe Professional Strongbox Revenue (billion), by Country 2025 & 2033
- Figure 36: Europe Professional Strongbox Volume (K), by Country 2025 & 2033
- Figure 37: Europe Professional Strongbox Revenue Share (%), by Country 2025 & 2033
- Figure 38: Europe Professional Strongbox Volume Share (%), by Country 2025 & 2033
- Figure 39: Middle East & Africa Professional Strongbox Revenue (billion), by Application 2025 & 2033
- Figure 40: Middle East & Africa Professional Strongbox Volume (K), by Application 2025 & 2033
- Figure 41: Middle East & Africa Professional Strongbox Revenue Share (%), by Application 2025 & 2033
- Figure 42: Middle East & Africa Professional Strongbox Volume Share (%), by Application 2025 & 2033
- Figure 43: Middle East & Africa Professional Strongbox Revenue (billion), by Types 2025 & 2033
- Figure 44: Middle East & Africa Professional Strongbox Volume (K), by Types 2025 & 2033
- Figure 45: Middle East & Africa Professional Strongbox Revenue Share (%), by Types 2025 & 2033
- Figure 46: Middle East & Africa Professional Strongbox Volume Share (%), by Types 2025 & 2033
- Figure 47: Middle East & Africa Professional Strongbox Revenue (billion), by Country 2025 & 2033
- Figure 48: Middle East & Africa Professional Strongbox Volume (K), by Country 2025 & 2033
- Figure 49: Middle East & Africa Professional Strongbox Revenue Share (%), by Country 2025 & 2033
- Figure 50: Middle East & Africa Professional Strongbox Volume Share (%), by Country 2025 & 2033
- Figure 51: Asia Pacific Professional Strongbox Revenue (billion), by Application 2025 & 2033
- Figure 52: Asia Pacific Professional Strongbox Volume (K), by Application 2025 & 2033
- Figure 53: Asia Pacific Professional Strongbox Revenue Share (%), by Application 2025 & 2033
- Figure 54: Asia Pacific Professional Strongbox Volume Share (%), by Application 2025 & 2033
- Figure 55: Asia Pacific Professional Strongbox Revenue (billion), by Types 2025 & 2033
- Figure 56: Asia Pacific Professional Strongbox Volume (K), by Types 2025 & 2033
- Figure 57: Asia Pacific Professional Strongbox Revenue Share (%), by Types 2025 & 2033
- Figure 58: Asia Pacific Professional Strongbox Volume Share (%), by Types 2025 & 2033
- Figure 59: Asia Pacific Professional Strongbox Revenue (billion), by Country 2025 & 2033
- Figure 60: Asia Pacific Professional Strongbox Volume (K), by Country 2025 & 2033
- Figure 61: Asia Pacific Professional Strongbox Revenue Share (%), by Country 2025 & 2033
- Figure 62: Asia Pacific Professional Strongbox Volume Share (%), by Country 2025 & 2033
List of Tables
- Table 1: Global Professional Strongbox Revenue billion Forecast, by Application 2020 & 2033
- Table 2: Global Professional Strongbox Volume K Forecast, by Application 2020 & 2033
- Table 3: Global Professional Strongbox Revenue billion Forecast, by Types 2020 & 2033
- Table 4: Global Professional Strongbox Volume K Forecast, by Types 2020 & 2033
- Table 5: Global Professional Strongbox Revenue billion Forecast, by Region 2020 & 2033
- Table 6: Global Professional Strongbox Volume K Forecast, by Region 2020 & 2033
- Table 7: Global Professional Strongbox Revenue billion Forecast, by Application 2020 & 2033
- Table 8: Global Professional Strongbox Volume K Forecast, by Application 2020 & 2033
- Table 9: Global Professional Strongbox Revenue billion Forecast, by Types 2020 & 2033
- Table 10: Global Professional Strongbox Volume K Forecast, by Types 2020 & 2033
- Table 11: Global Professional Strongbox Revenue billion Forecast, by Country 2020 & 2033
- Table 12: Global Professional Strongbox Volume K Forecast, by Country 2020 & 2033
- Table 13: United States Professional Strongbox Revenue (billion) Forecast, by Application 2020 & 2033
- Table 14: United States Professional Strongbox Volume (K) Forecast, by Application 2020 & 2033
- Table 15: Canada Professional Strongbox Revenue (billion) Forecast, by Application 2020 & 2033
- Table 16: Canada Professional Strongbox Volume (K) Forecast, by Application 2020 & 2033
- Table 17: Mexico Professional Strongbox Revenue (billion) Forecast, by Application 2020 & 2033
- Table 18: Mexico Professional Strongbox Volume (K) Forecast, by Application 2020 & 2033
- Table 19: Global Professional Strongbox Revenue billion Forecast, by Application 2020 & 2033
- Table 20: Global Professional Strongbox Volume K Forecast, by Application 2020 & 2033
- Table 21: Global Professional Strongbox Revenue billion Forecast, by Types 2020 & 2033
- Table 22: Global Professional Strongbox Volume K Forecast, by Types 2020 & 2033
- Table 23: Global Professional Strongbox Revenue billion Forecast, by Country 2020 & 2033
- Table 24: Global Professional Strongbox Volume K Forecast, by Country 2020 & 2033
- Table 25: Brazil Professional Strongbox Revenue (billion) Forecast, by Application 2020 & 2033
- Table 26: Brazil Professional Strongbox Volume (K) Forecast, by Application 2020 & 2033
- Table 27: Argentina Professional Strongbox Revenue (billion) Forecast, by Application 2020 & 2033
- Table 28: Argentina Professional Strongbox Volume (K) Forecast, by Application 2020 & 2033
- Table 29: Rest of South America Professional Strongbox Revenue (billion) Forecast, by Application 2020 & 2033
- Table 30: Rest of South America Professional Strongbox Volume (K) Forecast, by Application 2020 & 2033
- Table 31: Global Professional Strongbox Revenue billion Forecast, by Application 2020 & 2033
- Table 32: Global Professional Strongbox Volume K Forecast, by Application 2020 & 2033
- Table 33: Global Professional Strongbox Revenue billion Forecast, by Types 2020 & 2033
- Table 34: Global Professional Strongbox Volume K Forecast, by Types 2020 & 2033
- Table 35: Global Professional Strongbox Revenue billion Forecast, by Country 2020 & 2033
- Table 36: Global Professional Strongbox Volume K Forecast, by Country 2020 & 2033
- Table 37: United Kingdom Professional Strongbox Revenue (billion) Forecast, by Application 2020 & 2033
- Table 38: United Kingdom Professional Strongbox Volume (K) Forecast, by Application 2020 & 2033
- Table 39: Germany Professional Strongbox Revenue (billion) Forecast, by Application 2020 & 2033
- Table 40: Germany Professional Strongbox Volume (K) Forecast, by Application 2020 & 2033
- Table 41: France Professional Strongbox Revenue (billion) Forecast, by Application 2020 & 2033
- Table 42: France Professional Strongbox Volume (K) Forecast, by Application 2020 & 2033
- Table 43: Italy Professional Strongbox Revenue (billion) Forecast, by Application 2020 & 2033
- Table 44: Italy Professional Strongbox Volume (K) Forecast, by Application 2020 & 2033
- Table 45: Spain Professional Strongbox Revenue (billion) Forecast, by Application 2020 & 2033
- Table 46: Spain Professional Strongbox Volume (K) Forecast, by Application 2020 & 2033
- Table 47: Russia Professional Strongbox Revenue (billion) Forecast, by Application 2020 & 2033
- Table 48: Russia Professional Strongbox Volume (K) Forecast, by Application 2020 & 2033
- Table 49: Benelux Professional Strongbox Revenue (billion) Forecast, by Application 2020 & 2033
- Table 50: Benelux Professional Strongbox Volume (K) Forecast, by Application 2020 & 2033
- Table 51: Nordics Professional Strongbox Revenue (billion) Forecast, by Application 2020 & 2033
- Table 52: Nordics Professional Strongbox Volume (K) Forecast, by Application 2020 & 2033
- Table 53: Rest of Europe Professional Strongbox Revenue (billion) Forecast, by Application 2020 & 2033
- Table 54: Rest of Europe Professional Strongbox Volume (K) Forecast, by Application 2020 & 2033
- Table 55: Global Professional Strongbox Revenue billion Forecast, by Application 2020 & 2033
- Table 56: Global Professional Strongbox Volume K Forecast, by Application 2020 & 2033
- Table 57: Global Professional Strongbox Revenue billion Forecast, by Types 2020 & 2033
- Table 58: Global Professional Strongbox Volume K Forecast, by Types 2020 & 2033
- Table 59: Global Professional Strongbox Revenue billion Forecast, by Country 2020 & 2033
- Table 60: Global Professional Strongbox Volume K Forecast, by Country 2020 & 2033
- Table 61: Turkey Professional Strongbox Revenue (billion) Forecast, by Application 2020 & 2033
- Table 62: Turkey Professional Strongbox Volume (K) Forecast, by Application 2020 & 2033
- Table 63: Israel Professional Strongbox Revenue (billion) Forecast, by Application 2020 & 2033
- Table 64: Israel Professional Strongbox Volume (K) Forecast, by Application 2020 & 2033
- Table 65: GCC Professional Strongbox Revenue (billion) Forecast, by Application 2020 & 2033
- Table 66: GCC Professional Strongbox Volume (K) Forecast, by Application 2020 & 2033
- Table 67: North Africa Professional Strongbox Revenue (billion) Forecast, by Application 2020 & 2033
- Table 68: North Africa Professional Strongbox Volume (K) Forecast, by Application 2020 & 2033
- Table 69: South Africa Professional Strongbox Revenue (billion) Forecast, by Application 2020 & 2033
- Table 70: South Africa Professional Strongbox Volume (K) Forecast, by Application 2020 & 2033
- Table 71: Rest of Middle East & Africa Professional Strongbox Revenue (billion) Forecast, by Application 2020 & 2033
- Table 72: Rest of Middle East & Africa Professional Strongbox Volume (K) Forecast, by Application 2020 & 2033
- Table 73: Global Professional Strongbox Revenue billion Forecast, by Application 2020 & 2033
- Table 74: Global Professional Strongbox Volume K Forecast, by Application 2020 & 2033
- Table 75: Global Professional Strongbox Revenue billion Forecast, by Types 2020 & 2033
- Table 76: Global Professional Strongbox Volume K Forecast, by Types 2020 & 2033
- Table 77: Global Professional Strongbox Revenue billion Forecast, by Country 2020 & 2033
- Table 78: Global Professional Strongbox Volume K Forecast, by Country 2020 & 2033
- Table 79: China Professional Strongbox Revenue (billion) Forecast, by Application 2020 & 2033
- Table 80: China Professional Strongbox Volume (K) Forecast, by Application 2020 & 2033
- Table 81: India Professional Strongbox Revenue (billion) Forecast, by Application 2020 & 2033
- Table 82: India Professional Strongbox Volume (K) Forecast, by Application 2020 & 2033
- Table 83: Japan Professional Strongbox Revenue (billion) Forecast, by Application 2020 & 2033
- Table 84: Japan Professional Strongbox Volume (K) Forecast, by Application 2020 & 2033
- Table 85: South Korea Professional Strongbox Revenue (billion) Forecast, by Application 2020 & 2033
- Table 86: South Korea Professional Strongbox Volume (K) Forecast, by Application 2020 & 2033
- Table 87: ASEAN Professional Strongbox Revenue (billion) Forecast, by Application 2020 & 2033
- Table 88: ASEAN Professional Strongbox Volume (K) Forecast, by Application 2020 & 2033
- Table 89: Oceania Professional Strongbox Revenue (billion) Forecast, by Application 2020 & 2033
- Table 90: Oceania Professional Strongbox Volume (K) Forecast, by Application 2020 & 2033
- Table 91: Rest of Asia Pacific Professional Strongbox Revenue (billion) Forecast, by Application 2020 & 2033
- Table 92: Rest of Asia Pacific Professional Strongbox Volume (K) Forecast, by Application 2020 & 2033
Frequently Asked Questions
1. What is the projected Compound Annual Growth Rate (CAGR) of the Professional Strongbox?
The projected CAGR is approximately 15.42%.
2. Which companies are prominent players in the Professional Strongbox?
Key companies in the market include AMSEC Safes, Liberty Safe, Boca do Lobo, Buben&Zorweg, Casoro Jewelry Safes, Stockinger Safe, Phoenix Safe, SentrySafe, Nika Safe, Yale Safe, Lucell, Diplomat Safe, Gunnebo, Agresti, Brown Safe, First Alert, Godrej & Boyce, Kaba Group, Cannon Safe, Honeywell, Aipu, Weidunsi, Hebei Hupai, Deli.
3. What are the main segments of the Professional Strongbox?
The market segments include Application, Types.
4. Can you provide details about the market size?
The market size is estimated to be USD 9.96 billion as of 2022.
5. What are some drivers contributing to market growth?
N/A
6. What are the notable trends driving market growth?
N/A
7. Are there any restraints impacting market growth?
N/A
8. Can you provide examples of recent developments in the market?
N/A
9. What pricing options are available for accessing the report?
Pricing options include single-user, multi-user, and enterprise licenses priced at USD 3350.00, USD 5025.00, and USD 6700.00 respectively.
10. Is the market size provided in terms of value or volume?
The market size is provided in terms of value, measured in billion and volume, measured in K.
11. Are there any specific market keywords associated with the report?
Yes, the market keyword associated with the report is "Professional Strongbox," which aids in identifying and referencing the specific market segment covered.
12. How do I determine which pricing option suits my needs best?
The pricing options vary based on user requirements and access needs. Individual users may opt for single-user licenses, while businesses requiring broader access may choose multi-user or enterprise licenses for cost-effective access to the report.
13. Are there any additional resources or data provided in the Professional Strongbox report?
While the report offers comprehensive insights, it's advisable to review the specific contents or supplementary materials provided to ascertain if additional resources or data are available.
14. How can I stay updated on further developments or reports in the Professional Strongbox?
To stay informed about further developments, trends, and reports in the Professional Strongbox, consider subscribing to industry newsletters, following relevant companies and organizations, or regularly checking reputable industry news sources and publications.
Methodology
Step 1 - Identification of Relevant Samples Size from Population Database


Step 2 - Approaches for Defining Global Market Size (Value, Volume* & Price*)

Note*: In applicable scenarios
Step 3 - Data Sources
Primary Research
- Web Analytics
- Survey Reports
- Research Institute
- Latest Research Reports
- Opinion Leaders
Secondary Research
- Annual Reports
- White Paper
- Latest Press Release
- Industry Association
- Paid Database
- Investor Presentations

Step 4 - Data Triangulation
Involves using different sources of information in order to increase the validity of a study
These sources are likely to be stakeholders in a program - participants, other researchers, program staff, other community members, and so on.
Then we put all data in single framework & apply various statistical tools to find out the dynamic on the market.
During the analysis stage, feedback from the stakeholder groups would be compared to determine areas of agreement as well as areas of divergence