

Key Insights
The global PropTech market is poised for significant expansion, projected to reach an estimated market size of approximately $70,000 million by 2025, with a robust Compound Annual Growth Rate (CAGR) of around 18-20% anticipated over the forecast period of 2025-2033. This substantial growth is fueled by a confluence of transformative drivers. The increasing adoption of digital solutions across the entire real estate value chain, from property search and transaction management to building operations and maintenance, is a primary catalyst. Furthermore, escalating demand for enhanced operational efficiency, improved customer experiences, and data-driven decision-making within the real estate sector is propelling PropTech adoption. The market is witnessing a strong trend towards cloud-based solutions, offering scalability, flexibility, and cost-effectiveness, which are particularly attractive to Small and Medium Enterprises (SMEs) looking to modernize their operations. The growing integration of artificial intelligence (AI) and machine learning (ML) for predictive analytics, personalized recommendations, and automated processes is further shaping the market landscape, enabling more intelligent property management and investment strategies.
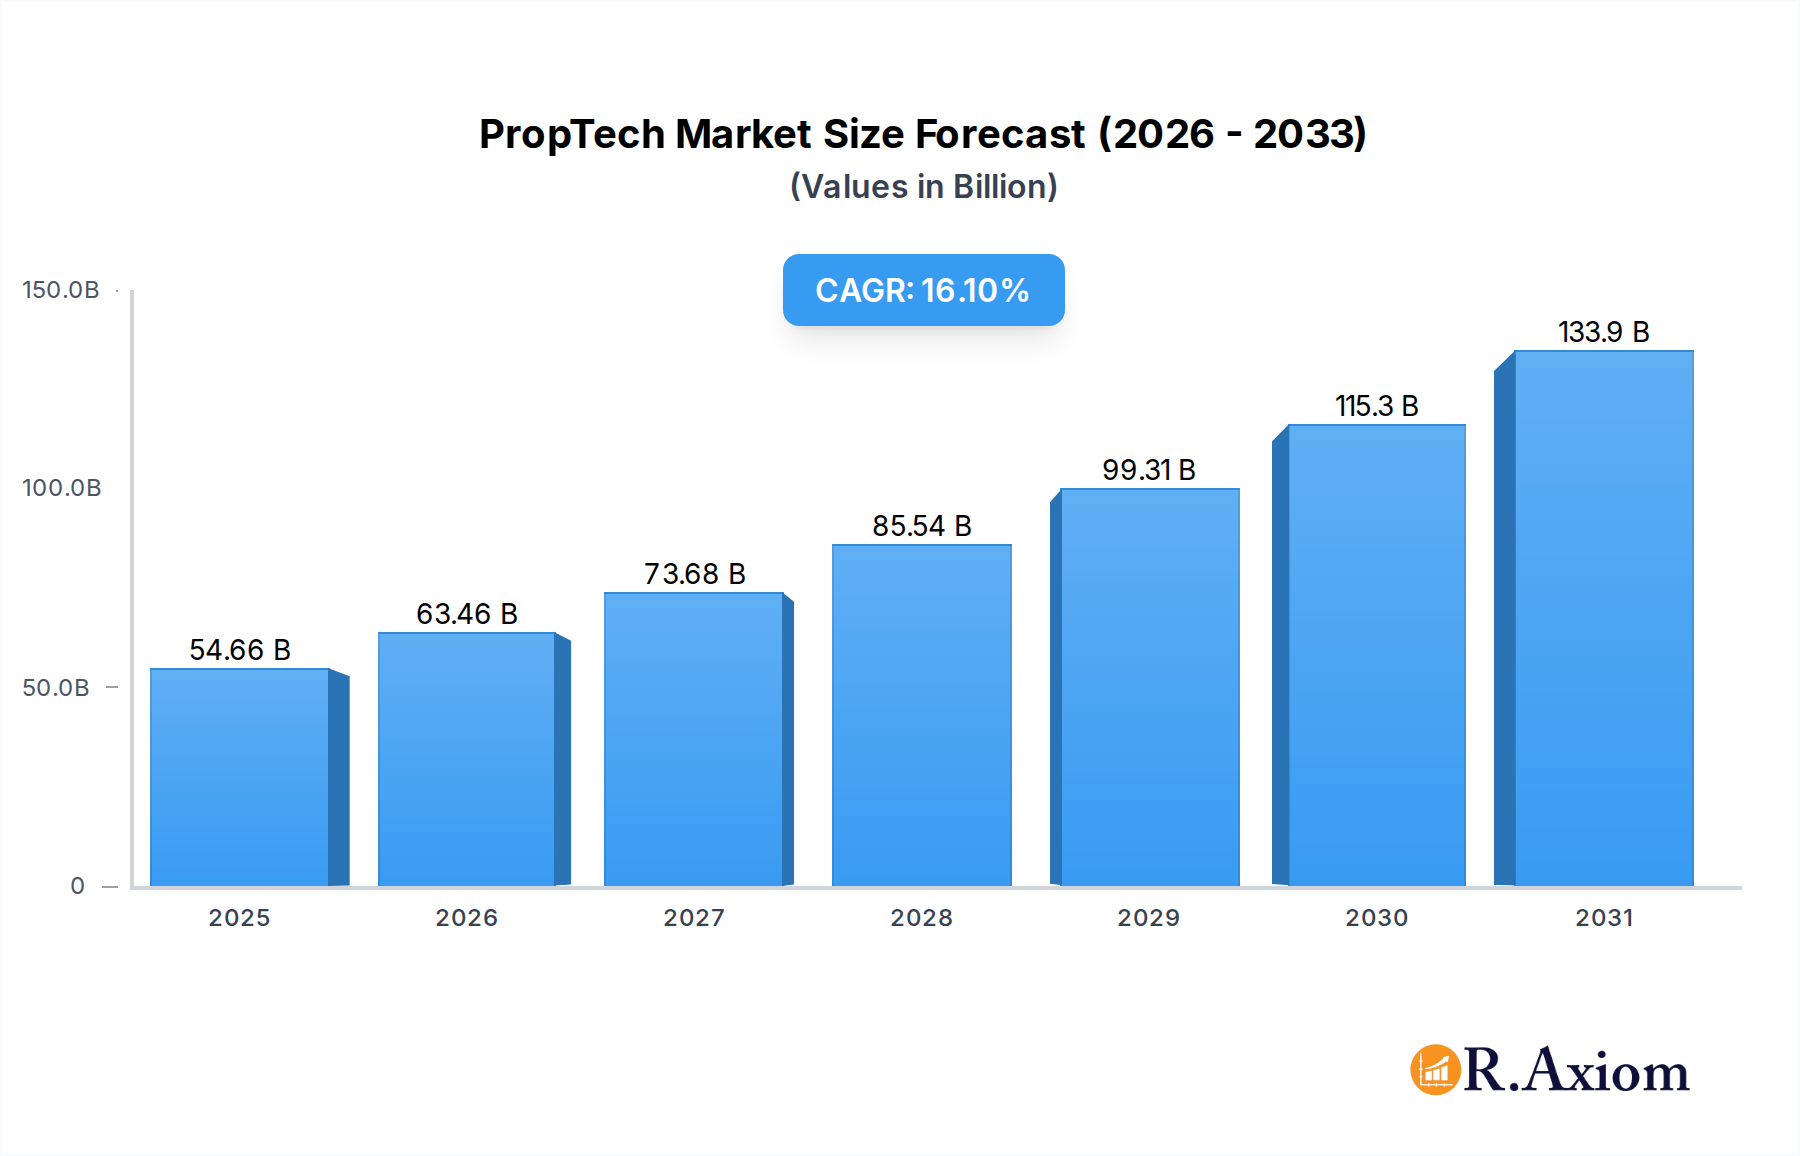
PropTech Market Size (In Billion)
Despite the optimistic outlook, certain restraints could temper the market's pace. Data security and privacy concerns remain a significant hurdle, as PropTech solutions often handle sensitive customer and property information. The high initial investment required for implementing advanced PropTech solutions can also be a barrier, especially for smaller players. Regulatory complexities and the slow pace of digital transformation in certain traditional real estate segments might also pose challenges. However, the persistent demand for streamlined property management, innovative investment platforms, and smart building technologies, coupled with the increasing venture capital investment in PropTech startups, is expected to outweigh these restraints. The market is segmented by application, with Large Enterprises and Small and Medium Enterprises forming key customer bases, and by type, with Cloud-based solutions dominating over On-premise alternatives due to their inherent advantages in accessibility and scalability. Prominent companies like Zillow Group, OpenDoor Technologies, and Compass are actively shaping this dynamic market.

PropTech Company Market Share
PropTech Market Concentration & Innovation
The PropTech market exhibits a dynamic landscape characterized by increasing concentration among key players and a relentless drive for innovation. This report delves into the intricate details of market concentration, exploring how companies like Zillow Group and OpenDoor Technologies are shaping the industry through strategic acquisitions and expansive service offerings. We will analyze the primary innovation drivers, including advancements in AI, IoT, blockchain, and data analytics, which are revolutionizing property management, transactions, and development. Furthermore, the report scrutinizes the impact of evolving regulatory frameworks on PropTech adoption and the emergence of product substitutes, assessing their potential to disrupt established business models. End-user trends, such as the growing demand for seamless digital experiences and sustainable solutions, are meticulously examined. Mergers and acquisitions (M&A) activities are a significant indicator of market consolidation and strategic expansion. Key M&A deals, valued in the hundreds of millions, underscore the intense competition and the pursuit of market dominance by leading entities. Market share analysis will reveal the relative strengths of major participants, such as Compass and Zumper, as they vie for a larger portion of the multi-trillion dollar global real estate technology market. Understanding these interwoven factors is crucial for stakeholders seeking to navigate and capitalize on the PropTech revolution.
PropTech Industry Trends & Insights
The PropTech industry is experiencing unprecedented growth, fueled by a confluence of technological advancements, evolving consumer expectations, and increasing investment. This report provides a comprehensive analysis of the key trends and insights shaping this burgeoning sector. The market is projected to grow at a Compound Annual Growth Rate (CAGR) of approximately xx% during the forecast period of 2025–2033, reaching an estimated market size of several trillion dollars by 2033. Technological disruptions are at the forefront, with the integration of Artificial Intelligence (AI) for property valuation and predictive analytics, Internet of Things (IoT) for smart building management, and blockchain for secure and transparent transactions fundamentally altering how properties are bought, sold, managed, and experienced. Consumer preferences are shifting rapidly towards digital-first solutions, demanding personalized services, virtual tours, and streamlined online processes. The rise of remote work has also spurred demand for flexible office solutions and updated residential living spaces. Competitive dynamics are intensifying, with established real estate giants and agile startups alike investing heavily in PropTech solutions. Companies are focusing on enhancing user experience, improving operational efficiency, and creating innovative revenue streams. Market penetration is steadily increasing across all segments, from residential rentals and sales to commercial real estate and property management. The report will also highlight emerging trends such as the metaverse's potential impact on virtual property, the growing importance of sustainability and ESG (Environmental, Social, and Governance) factors in real estate decisions, and the increasing adoption of proptech solutions by traditional real estate firms to enhance their service offerings and competitiveness. The interconnectedness of these trends creates a fertile ground for innovation and significant market expansion in the coming years.
Dominant Markets & Segments in PropTech
This section meticulously examines the dominant markets and segments within the global PropTech landscape, offering insights into regional leadership, country-specific dominance, and the performance of key application and type segments. The Asia-Pacific region is emerging as a powerhouse, driven by rapid urbanization, a burgeoning middle class, and substantial government investment in smart city initiatives and digital infrastructure. Countries like China and India, with their vast populations and increasing adoption of mobile technology, represent significant growth engines. Within this region, specific economic policies supporting technological innovation and the development of advanced infrastructure are crucial drivers. In North America, particularly the United States, a mature market with high property values and a strong existing technology ecosystem, PropTech adoption is widespread. Regulatory frameworks that encourage digital transformation and a high propensity for investment in real estate technology further solidify its dominance.
The application segments reveal a clear trend towards catering to Large Enterprises, which benefit from integrated solutions that can manage vast portfolios and complex operations. These enterprises are increasingly leveraging PropTech for property management, facilities management, and investment analysis, seeking to optimize efficiency and reduce costs. Companies like ManageCasa and Reonomy are at the forefront of providing sophisticated solutions for this segment. However, the Small and Medium Enterprises (SMEs) segment is also experiencing robust growth, driven by the availability of more accessible and affordable cloud-based PropTech solutions that empower them to compete effectively. The development of user-friendly platforms and specialized tools for niche markets are key drivers for SME adoption.
In terms of types, Cloud-based solutions are overwhelmingly dominant and are projected to continue their ascendance. This is attributed to their scalability, flexibility, lower upfront costs, and ease of integration. Cloud platforms enable real-time data access, remote management, and seamless collaboration, making them indispensable for modern real estate operations. While On-premise solutions still exist, particularly for organizations with highly specific security or customization needs, the market's trajectory clearly favors the agility and cost-effectiveness of cloud deployments. The strategic importance of economic policies, robust infrastructure development, and supportive regulatory environments cannot be overstated in driving the dominance of these specific markets and segments.
PropTech Product Developments
PropTech product developments are characterized by a relentless focus on enhancing user experience, streamlining operations, and unlocking new value propositions. Innovations in AI-powered analytics are enabling more accurate property valuations, predictive maintenance, and personalized tenant recommendations. IoT devices are transforming buildings into intelligent, interconnected ecosystems, optimizing energy consumption, security, and occupant comfort. Blockchain technology is paving the way for secure, transparent, and efficient property transactions, reducing fraud and speeding up settlement times. Companies are developing integrated platforms that offer end-to-end solutions for property management, from listing and leasing to maintenance and accounting. Competitive advantages are being carved out through superior data integration capabilities, intuitive user interfaces, and the ability to provide actionable insights that drive better decision-making for property owners, managers, and tenants alike. The market fit for these products is increasingly dictated by their ability to address specific pain points in the real estate lifecycle, from initial investment and development to ongoing management and eventual sale.
Report Scope & Segmentation Analysis
This report provides an in-depth analysis of the PropTech market, segmented by Application and Type. In the Application segment, Large Enterprises represent a significant market share, valued at several hundred million dollars. These organizations leverage PropTech for comprehensive portfolio management, predictive analytics, and large-scale operational efficiencies. Their demand for advanced, integrated solutions drives innovation in enterprise-grade software and AI-driven insights. The Small and Medium Enterprises (SMEs) segment, while smaller in individual transaction value, presents substantial growth potential, with market sizes in the tens of millions. SMEs are increasingly adopting PropTech for cost-effective property management, lead generation, and client relationship management, benefiting from accessible and scalable cloud-based solutions.
In the Type segmentation, the Cloud-based market dominates, projected to reach several trillion dollars. Its scalability, flexibility, and accessibility make it the preferred choice for most users, enabling real-time data access and remote management capabilities. The On-premise segment, while more niche, still holds value in specific enterprise deployments requiring stringent data control, with market sizes in the tens of millions. However, its growth is outpaced by the rapid adoption of cloud solutions. Competitive dynamics within each segment are driven by feature innovation, pricing strategies, and the ability to cater to specific user needs.
Key Drivers of PropTech Growth
Several key factors are propelling the substantial growth of the PropTech sector. Technologically, the pervasive adoption of AI, IoT, and blockchain is revolutionizing property management, transactions, and development by enhancing efficiency, transparency, and predictive capabilities. Economically, a robust global real estate market, coupled with increasing investor confidence and the need for operational cost optimization, fuels demand for advanced technology solutions. Regulatory frameworks in many regions are becoming more supportive of digital transformation in real estate, encouraging innovation and the adoption of new technologies. Furthermore, evolving consumer preferences for seamless digital experiences, personalized services, and sustainable living are compelling real estate stakeholders to invest in PropTech. The increasing digitization of industries across the board also creates a fertile ground for PropTech to integrate with broader digital ecosystems.
Challenges in the PropTech Sector
Despite its promising growth, the PropTech sector faces notable challenges. Regulatory hurdles, including data privacy concerns and the evolving legal landscape for digital transactions, can slow down adoption and necessitate complex compliance measures. Interoperability issues between different PropTech solutions and legacy systems within established real estate firms can hinder seamless integration and create data silos. Supply chain disruptions, particularly for hardware components used in IoT devices and smart building technologies, can impact product availability and pricing. Intense competitive pressures from both established players and emerging startups necessitate continuous innovation and strategic differentiation to maintain market share. High customer acquisition costs and the need for extensive user education also present significant barriers.
Emerging Opportunities in PropTech
The PropTech landscape is ripe with emerging opportunities. The increasing demand for sustainable and green building technologies presents a significant avenue for growth, aligning with global ESG initiatives. The metaverse offers unexplored potential for virtual property tours, digital twins, and immersive real estate experiences. The development of AI-driven tools for hyper-personalized property recommendations and predictive market analysis will continue to be a key area. Furthermore, the integration of PropTech with other industries, such as finance (FinTech) for mortgage and investment solutions, and healthcare for senior living technology, opens up new market frontiers. The growing need for flexible and hybrid workspace solutions also presents opportunities for innovative office management and co-working platforms.
Leading Players in the PropTech Market
- eSelf AI
- VuHome.ai
- Structurely
- Ask the Agent
- EliseAI
- Placeform
- Loft47
- Matterport
- Soul Machines
- UneeQ
- Others
Key Developments in PropTech Industry
- 2023: Launch of advanced AI-powered valuation models by Zillow Group, enhancing accuracy and speed.
- 2023: OpenDoor Technologies expands its iBuyer services into new metropolitan areas, solidifying its market presence.
- 2023: Guesty introduces enhanced automation features for vacation rental property managers, streamlining operations.
- 2023: Compass rolls out new agent-centric tools, focusing on data analytics and client engagement.
- 2022: Reonomy enhances its data platform with more granular property ownership and transaction insights.
- 2022: HoloBuilder integrates advanced reality capture technology for construction project documentation.
- 2022: ManageCasa expands its cloud-based property management software with integrated accounting features.
- 2021: Zumper acquires a competitor, further consolidating its position in the rental market.
- 2021: Ascendix Technologies launches a new CRM tailored for the commercial real estate sector.
- 2020: NoBroker introduces new services for home loans and rental deposit management in India.
- 2020: Rethink Solutions develops enhanced tools for construction project bidding and management.
- 2019: Anyone Home rolls out new lead management and CRM functionalities for property managers.
Strategic Outlook for PropTech Market
The strategic outlook for the PropTech market is overwhelmingly positive, driven by sustained innovation and increasing integration across the real estate value chain. Key growth catalysts include the continued digitization of real estate processes, the growing demand for data-driven decision-making, and the expansion of cloud-based solutions. Emerging technologies like AI and blockchain will play an increasingly pivotal role in shaping the future of property management, transactions, and development. Opportunities lie in addressing the growing demand for sustainable real estate, leveraging the metaverse for immersive experiences, and expanding into adjacent markets like FinTech. Strategic partnerships and acquisitions will continue to be crucial for market leaders to gain competitive advantages and expand their service portfolios. The future promises a more efficient, transparent, and accessible real estate ecosystem, powered by innovative PropTech solutions.
PropTech Segmentation
- By Type
- ConTech
- Smart Real Estate
- Shared Economy Real Estate
- FinTech
- By Property Type
- Property Type
- Commercial Property
- By Deployment
- Cloud-Based
- On-Premises
- By End User
- Property Managers
- Real Estate Agents/Brokers
- Real Estate Investors
- Landlords
- Tenants
- Others
PropTech Segmentation By Geography
- 1. North America
- 1.1. United States
- 1.2. Canada
- 1.3. Mexico
- 2. South America
- 2.1. Brazil
- 2.2. Argentina
- 2.3. Rest of South America
- 3. Europe
- 3.1. United Kingdom
- 3.2. Germany
- 3.3. France
- 3.4. Italy
- 3.5. Spain
- 3.6. Russia
- 3.7. Benelux
- 3.8. Nordics
- 3.9. Rest of Europe
- 4. Middle East & Africa
- 4.1. Turkey
- 4.2. Israel
- 4.3. GCC
- 4.4. North Africa
- 4.5. South Africa
- 4.6. Rest of Middle East & Africa
- 5. Asia Pacific
- 5.1. China
- 5.2. India
- 5.3. Japan
- 5.4. South Korea
- 5.5. ASEAN
- 5.6. Oceania
- 5.7. Rest of Asia Pacific
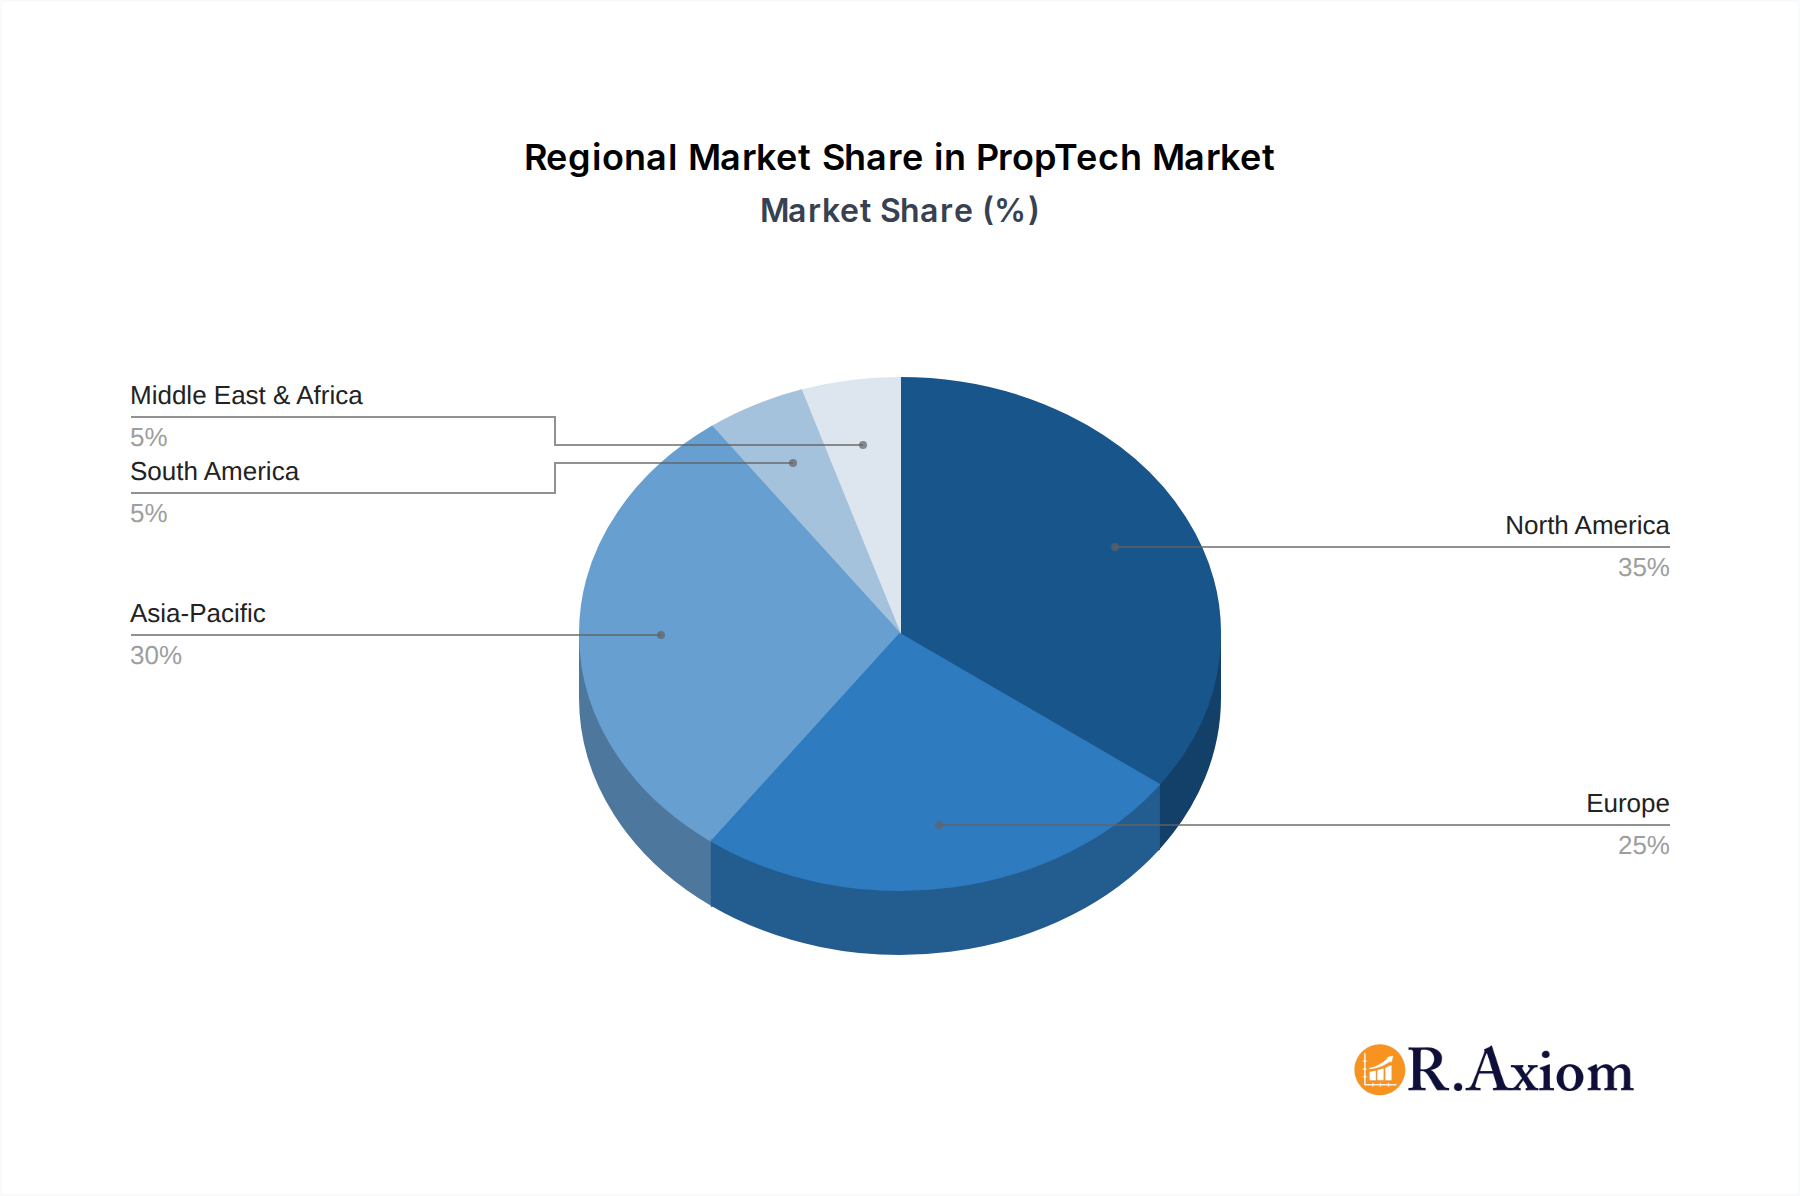
PropTech Regional Market Share
Geographic Coverage of PropTech
PropTech REPORT HIGHLIGHTS
| Aspects | Details |
|---|---|
| Study Period | 2020-2034 |
| Base Year | 2025 |
| Estimated Year | 2026 |
| Forecast Period | 2026-2034 |
| Historical Period | 2020-2025 |
| Growth Rate | CAGR of 16.1% from 2020-2034 |
| Segmentation |
|
Table of Contents
- 1. Introduction
- 1.1. Research Scope
- 1.2. Market Segmentation
- 1.3. Research Objective
- 1.4. Definitions and Assumptions
- 2. Executive Summary
- 2.1. Market Snapshot
- 3. Market Dynamics
- 3.1. Market Drivers
- 3.2. Market Restrains
- 3.3. Market Trends
- 3.4. Market Opportunities
- 4. Market Factor Analysis
- 4.1. Porters Five Forces
- 4.1.1. Bargaining Power of Suppliers
- 4.1.2. Bargaining Power of Buyers
- 4.1.3. Threat of New Entrants
- 4.1.4. Threat of Substitutes
- 4.1.5. Competitive Rivalry
- 4.2. PESTEL analysis
- 4.3. BCG Analysis
- 4.3.1. Stars (High Growth, High Market Share)
- 4.3.2. Cash Cows (Low Growth, High Market Share)
- 4.3.3. Question Mark (High Growth, Low Market Share)
- 4.3.4. Dogs (Low Growth, Low Market Share)
- 4.4. Ansoff Matrix Analysis
- 4.5. Supply Chain Analysis
- 4.6. Regulatory Landscape
- 4.7. Current Market Potential and Opportunity Assessment (TAM–SAM–SOM Framework)
- 4.8. RAX Analyst Note
- 4.1. Porters Five Forces
- 5. Market Analysis, Insights and Forecast 2021-2033
- 5.1. Market Analysis, Insights and Forecast - by Type
- 5.1.1. ConTech
- 5.1.2. Smart Real Estate
- 5.1.3. Shared Economy Real Estate
- 5.1.4. FinTech
- 5.2. Market Analysis, Insights and Forecast - by Property Type
- 5.2.1. Residential Property
- 5.2.2. Commercial Property
- 5.3. Market Analysis, Insights and Forecast - by Deployment
- 5.3.1. Cloud-Based
- 5.3.2. On-Premises
- 5.4. Market Analysis, Insights and Forecast - by End User
- 5.4.1. Property Managers
- 5.4.2. Real Estate Agents/Brokers
- 5.4.3. Real Estate Investors
- 5.4.4. Landlords
- 5.4.5. Tenants
- 5.4.6. Others
- 5.5. Market Analysis, Insights and Forecast - by Region
- 5.5.1. North America
- 5.5.2. South America
- 5.5.3. Europe
- 5.5.4. Middle East & Africa
- 5.5.5. Asia Pacific
- 5.1. Market Analysis, Insights and Forecast - by Type
- 6. Global PropTech Analysis, Insights and Forecast, 2021-2033
- 6.1. Market Analysis, Insights and Forecast - by Type
- 6.1.1. ConTech
- 6.1.2. Smart Real Estate
- 6.1.3. Shared Economy Real Estate
- 6.1.4. FinTech
- 6.2. Market Analysis, Insights and Forecast - by Property Type
- 6.2.1. Residential Property
- 6.2.2. Commercial Property
- 6.3. Market Analysis, Insights and Forecast - by Deployment
- 6.3.1. Cloud-Based
- 6.3.2. On-Premises
- 6.4. Market Analysis, Insights and Forecast - by End User
- 6.4.1. Property Managers
- 6.4.2. Real Estate Agents/Brokers
- 6.4.3. Real Estate Investors
- 6.4.4. Landlords
- 6.4.5. Tenants
- 6.4.6. Others
- 6.1. Market Analysis, Insights and Forecast - by Type
- 7. North America PropTech Analysis, Insights and Forecast, 2020-2032
- 7.1. Market Analysis, Insights and Forecast - by Type
- 7.1.1. ConTech
- 7.1.2. Smart Real Estate
- 7.1.3. Shared Economy Real Estate
- 7.1.4. FinTech
- 7.2. Market Analysis, Insights and Forecast - by Property Type
- 7.2.1. Residential Property
- 7.2.2. Commercial Property
- 7.3. Market Analysis, Insights and Forecast - by Deployment
- 7.3.1. Cloud-Based
- 7.3.2. On-Premises
- 7.4. Market Analysis, Insights and Forecast - by End User
- 7.4.1. Property Managers
- 7.4.2. Real Estate Agents/Brokers
- 7.4.3. Real Estate Investors
- 7.4.4. Landlords
- 7.4.5. Tenants
- 7.4.6. Others
- 7.1. Market Analysis, Insights and Forecast - by Type
- 8. South America PropTech Analysis, Insights and Forecast, 2020-2032
- 8.1. Market Analysis, Insights and Forecast - by Type
- 8.1.1. ConTech
- 8.1.2. Smart Real Estate
- 8.1.3. Shared Economy Real Estate
- 8.1.4. FinTech
- 8.2. Market Analysis, Insights and Forecast - by Property Type
- 8.2.1. Residential Property
- 8.2.2. Commercial Property
- 8.3. Market Analysis, Insights and Forecast - by Deployment
- 8.3.1. Cloud-Based
- 8.3.2. On-Premises
- 8.4. Market Analysis, Insights and Forecast - by End User
- 8.4.1. Property Managers
- 8.4.2. Real Estate Agents/Brokers
- 8.4.3. Real Estate Investors
- 8.4.4. Landlords
- 8.4.5. Tenants
- 8.4.6. Others
- 8.1. Market Analysis, Insights and Forecast - by Type
- 9. Europe PropTech Analysis, Insights and Forecast, 2020-2032
- 9.1. Market Analysis, Insights and Forecast - by Type
- 9.1.1. ConTech
- 9.1.2. Smart Real Estate
- 9.1.3. Shared Economy Real Estate
- 9.1.4. FinTech
- 9.2. Market Analysis, Insights and Forecast - by Property Type
- 9.2.1. Residential Property
- 9.2.2. Commercial Property
- 9.3. Market Analysis, Insights and Forecast - by Deployment
- 9.3.1. Cloud-Based
- 9.3.2. On-Premises
- 9.4. Market Analysis, Insights and Forecast - by End User
- 9.4.1. Property Managers
- 9.4.2. Real Estate Agents/Brokers
- 9.4.3. Real Estate Investors
- 9.4.4. Landlords
- 9.4.5. Tenants
- 9.4.6. Others
- 9.1. Market Analysis, Insights and Forecast - by Type
- 10. Middle East & Africa PropTech Analysis, Insights and Forecast, 2020-2032
- 10.1. Market Analysis, Insights and Forecast - by Type
- 10.1.1. ConTech
- 10.1.2. Smart Real Estate
- 10.1.3. Shared Economy Real Estate
- 10.1.4. FinTech
- 10.2. Market Analysis, Insights and Forecast - by Property Type
- 10.2.1. Residential Property
- 10.2.2. Commercial Property
- 10.3. Market Analysis, Insights and Forecast - by Deployment
- 10.3.1. Cloud-Based
- 10.3.2. On-Premises
- 10.4. Market Analysis, Insights and Forecast - by End User
- 10.4.1. Property Managers
- 10.4.2. Real Estate Agents/Brokers
- 10.4.3. Real Estate Investors
- 10.4.4. Landlords
- 10.4.5. Tenants
- 10.4.6. Others
- 10.1. Market Analysis, Insights and Forecast - by Type
- 11. Asia Pacific PropTech Analysis, Insights and Forecast, 2020-2032
- 11.1. Market Analysis, Insights and Forecast - by Type
- 11.1.1. ConTech
- 11.1.2. Smart Real Estate
- 11.1.3. Shared Economy Real Estate
- 11.1.4. FinTech
- 11.2. Market Analysis, Insights and Forecast - by Property Type
- 11.2.1. Residential Property
- 11.2.2. Commercial Property
- 11.3. Market Analysis, Insights and Forecast - by Deployment
- 11.3.1. Cloud-Based
- 11.3.2. On-Premises
- 11.4. Market Analysis, Insights and Forecast - by End User
- 11.4.1. Property Managers
- 11.4.2. Real Estate Agents/Brokers
- 11.4.3. Real Estate Investors
- 11.4.4. Landlords
- 11.4.5. Tenants
- 11.4.6. Others
- 11.1. Market Analysis, Insights and Forecast - by Type
- 12. Competitive Analysis
- 12.1. Company Profiles
- 12.1.1 eSelf AI
- 12.1.1.1. Company Overview
- 12.1.1.2. Products
- 12.1.1.3. Company Financials
- 12.1.1.4. SWOT Analysis
- 12.1.2 VuHome.ai
- 12.1.2.1. Company Overview
- 12.1.2.2. Products
- 12.1.2.3. Company Financials
- 12.1.2.4. SWOT Analysis
- 12.1.3 Structurely
- 12.1.3.1. Company Overview
- 12.1.3.2. Products
- 12.1.3.3. Company Financials
- 12.1.3.4. SWOT Analysis
- 12.1.4 Ask the Agent
- 12.1.4.1. Company Overview
- 12.1.4.2. Products
- 12.1.4.3. Company Financials
- 12.1.4.4. SWOT Analysis
- 12.1.5 EliseAI
- 12.1.5.1. Company Overview
- 12.1.5.2. Products
- 12.1.5.3. Company Financials
- 12.1.5.4. SWOT Analysis
- 12.1.6 Placeform
- 12.1.6.1. Company Overview
- 12.1.6.2. Products
- 12.1.6.3. Company Financials
- 12.1.6.4. SWOT Analysis
- 12.1.7 Loft47
- 12.1.7.1. Company Overview
- 12.1.7.2. Products
- 12.1.7.3. Company Financials
- 12.1.7.4. SWOT Analysis
- 12.1.8 Matterport
- 12.1.8.1. Company Overview
- 12.1.8.2. Products
- 12.1.8.3. Company Financials
- 12.1.8.4. SWOT Analysis
- 12.1.9 Soul Machines
- 12.1.9.1. Company Overview
- 12.1.9.2. Products
- 12.1.9.3. Company Financials
- 12.1.9.4. SWOT Analysis
- 12.1.10 UneeQ
- 12.1.10.1. Company Overview
- 12.1.10.2. Products
- 12.1.10.3. Company Financials
- 12.1.10.4. SWOT Analysis
- 12.1.11 Others
- 12.1.11.1. Company Overview
- 12.1.11.2. Products
- 12.1.11.3. Company Financials
- 12.1.11.4. SWOT Analysis
- 12.1.1 eSelf AI
- 12.2. Market Entropy
- 12.2.1 Company's Key Areas Served
- 12.2.2 Recent Developments
- 12.3. Company Market Share Analysis 2025
- 12.3.1 Top 5 Companies Market Share Analysis
- 12.3.2 Top 3 Companies Market Share Analysis
- 12.4. List of Potential Customers
- 13. Research Methodology
List of Figures
- Figure 1: Global PropTech Revenue Breakdown (billion, %) by Region 2025 & 2033
- Figure 2: North America PropTech Revenue (billion), by Type 2025 & 2033
- Figure 3: North America PropTech Revenue Share (%), by Type 2025 & 2033
- Figure 4: North America PropTech Revenue (billion), by Property Type 2025 & 2033
- Figure 5: North America PropTech Revenue Share (%), by Property Type 2025 & 2033
- Figure 6: North America PropTech Revenue (billion), by Deployment 2025 & 2033
- Figure 7: North America PropTech Revenue Share (%), by Deployment 2025 & 2033
- Figure 8: North America PropTech Revenue (billion), by End User 2025 & 2033
- Figure 9: North America PropTech Revenue Share (%), by End User 2025 & 2033
- Figure 10: North America PropTech Revenue (billion), by Country 2025 & 2033
- Figure 11: North America PropTech Revenue Share (%), by Country 2025 & 2033
- Figure 12: South America PropTech Revenue (billion), by Type 2025 & 2033
- Figure 13: South America PropTech Revenue Share (%), by Type 2025 & 2033
- Figure 14: South America PropTech Revenue (billion), by Property Type 2025 & 2033
- Figure 15: South America PropTech Revenue Share (%), by Property Type 2025 & 2033
- Figure 16: South America PropTech Revenue (billion), by Deployment 2025 & 2033
- Figure 17: South America PropTech Revenue Share (%), by Deployment 2025 & 2033
- Figure 18: South America PropTech Revenue (billion), by End User 2025 & 2033
- Figure 19: South America PropTech Revenue Share (%), by End User 2025 & 2033
- Figure 20: South America PropTech Revenue (billion), by Country 2025 & 2033
- Figure 21: South America PropTech Revenue Share (%), by Country 2025 & 2033
- Figure 22: Europe PropTech Revenue (billion), by Type 2025 & 2033
- Figure 23: Europe PropTech Revenue Share (%), by Type 2025 & 2033
- Figure 24: Europe PropTech Revenue (billion), by Property Type 2025 & 2033
- Figure 25: Europe PropTech Revenue Share (%), by Property Type 2025 & 2033
- Figure 26: Europe PropTech Revenue (billion), by Deployment 2025 & 2033
- Figure 27: Europe PropTech Revenue Share (%), by Deployment 2025 & 2033
- Figure 28: Europe PropTech Revenue (billion), by End User 2025 & 2033
- Figure 29: Europe PropTech Revenue Share (%), by End User 2025 & 2033
- Figure 30: Europe PropTech Revenue (billion), by Country 2025 & 2033
- Figure 31: Europe PropTech Revenue Share (%), by Country 2025 & 2033
- Figure 32: Middle East & Africa PropTech Revenue (billion), by Type 2025 & 2033
- Figure 33: Middle East & Africa PropTech Revenue Share (%), by Type 2025 & 2033
- Figure 34: Middle East & Africa PropTech Revenue (billion), by Property Type 2025 & 2033
- Figure 35: Middle East & Africa PropTech Revenue Share (%), by Property Type 2025 & 2033
- Figure 36: Middle East & Africa PropTech Revenue (billion), by Deployment 2025 & 2033
- Figure 37: Middle East & Africa PropTech Revenue Share (%), by Deployment 2025 & 2033
- Figure 38: Middle East & Africa PropTech Revenue (billion), by End User 2025 & 2033
- Figure 39: Middle East & Africa PropTech Revenue Share (%), by End User 2025 & 2033
- Figure 40: Middle East & Africa PropTech Revenue (billion), by Country 2025 & 2033
- Figure 41: Middle East & Africa PropTech Revenue Share (%), by Country 2025 & 2033
- Figure 42: Asia Pacific PropTech Revenue (billion), by Type 2025 & 2033
- Figure 43: Asia Pacific PropTech Revenue Share (%), by Type 2025 & 2033
- Figure 44: Asia Pacific PropTech Revenue (billion), by Property Type 2025 & 2033
- Figure 45: Asia Pacific PropTech Revenue Share (%), by Property Type 2025 & 2033
- Figure 46: Asia Pacific PropTech Revenue (billion), by Deployment 2025 & 2033
- Figure 47: Asia Pacific PropTech Revenue Share (%), by Deployment 2025 & 2033
- Figure 48: Asia Pacific PropTech Revenue (billion), by End User 2025 & 2033
- Figure 49: Asia Pacific PropTech Revenue Share (%), by End User 2025 & 2033
- Figure 50: Asia Pacific PropTech Revenue (billion), by Country 2025 & 2033
- Figure 51: Asia Pacific PropTech Revenue Share (%), by Country 2025 & 2033
List of Tables
- Table 1: Global PropTech Revenue billion Forecast, by Type 2020 & 2033
- Table 2: Global PropTech Revenue billion Forecast, by Property Type 2020 & 2033
- Table 3: Global PropTech Revenue billion Forecast, by Deployment 2020 & 2033
- Table 4: Global PropTech Revenue billion Forecast, by End User 2020 & 2033
- Table 5: Global PropTech Revenue billion Forecast, by Region 2020 & 2033
- Table 6: Global PropTech Revenue billion Forecast, by Type 2020 & 2033
- Table 7: Global PropTech Revenue billion Forecast, by Property Type 2020 & 2033
- Table 8: Global PropTech Revenue billion Forecast, by Deployment 2020 & 2033
- Table 9: Global PropTech Revenue billion Forecast, by End User 2020 & 2033
- Table 10: Global PropTech Revenue billion Forecast, by Country 2020 & 2033
- Table 11: United States PropTech Revenue (billion) Forecast, by Application 2020 & 2033
- Table 12: Canada PropTech Revenue (billion) Forecast, by Application 2020 & 2033
- Table 13: Mexico PropTech Revenue (billion) Forecast, by Application 2020 & 2033
- Table 14: Global PropTech Revenue billion Forecast, by Type 2020 & 2033
- Table 15: Global PropTech Revenue billion Forecast, by Property Type 2020 & 2033
- Table 16: Global PropTech Revenue billion Forecast, by Deployment 2020 & 2033
- Table 17: Global PropTech Revenue billion Forecast, by End User 2020 & 2033
- Table 18: Global PropTech Revenue billion Forecast, by Country 2020 & 2033
- Table 19: Brazil PropTech Revenue (billion) Forecast, by Application 2020 & 2033
- Table 20: Argentina PropTech Revenue (billion) Forecast, by Application 2020 & 2033
- Table 21: Rest of South America PropTech Revenue (billion) Forecast, by Application 2020 & 2033
- Table 22: Global PropTech Revenue billion Forecast, by Type 2020 & 2033
- Table 23: Global PropTech Revenue billion Forecast, by Property Type 2020 & 2033
- Table 24: Global PropTech Revenue billion Forecast, by Deployment 2020 & 2033
- Table 25: Global PropTech Revenue billion Forecast, by End User 2020 & 2033
- Table 26: Global PropTech Revenue billion Forecast, by Country 2020 & 2033
- Table 27: United Kingdom PropTech Revenue (billion) Forecast, by Application 2020 & 2033
- Table 28: Germany PropTech Revenue (billion) Forecast, by Application 2020 & 2033
- Table 29: France PropTech Revenue (billion) Forecast, by Application 2020 & 2033
- Table 30: Italy PropTech Revenue (billion) Forecast, by Application 2020 & 2033
- Table 31: Spain PropTech Revenue (billion) Forecast, by Application 2020 & 2033
- Table 32: Russia PropTech Revenue (billion) Forecast, by Application 2020 & 2033
- Table 33: Benelux PropTech Revenue (billion) Forecast, by Application 2020 & 2033
- Table 34: Nordics PropTech Revenue (billion) Forecast, by Application 2020 & 2033
- Table 35: Rest of Europe PropTech Revenue (billion) Forecast, by Application 2020 & 2033
- Table 36: Global PropTech Revenue billion Forecast, by Type 2020 & 2033
- Table 37: Global PropTech Revenue billion Forecast, by Property Type 2020 & 2033
- Table 38: Global PropTech Revenue billion Forecast, by Deployment 2020 & 2033
- Table 39: Global PropTech Revenue billion Forecast, by End User 2020 & 2033
- Table 40: Global PropTech Revenue billion Forecast, by Country 2020 & 2033
- Table 41: Turkey PropTech Revenue (billion) Forecast, by Application 2020 & 2033
- Table 42: Israel PropTech Revenue (billion) Forecast, by Application 2020 & 2033
- Table 43: GCC PropTech Revenue (billion) Forecast, by Application 2020 & 2033
- Table 44: North Africa PropTech Revenue (billion) Forecast, by Application 2020 & 2033
- Table 45: South Africa PropTech Revenue (billion) Forecast, by Application 2020 & 2033
- Table 46: Rest of Middle East & Africa PropTech Revenue (billion) Forecast, by Application 2020 & 2033
- Table 47: Global PropTech Revenue billion Forecast, by Type 2020 & 2033
- Table 48: Global PropTech Revenue billion Forecast, by Property Type 2020 & 2033
- Table 49: Global PropTech Revenue billion Forecast, by Deployment 2020 & 2033
- Table 50: Global PropTech Revenue billion Forecast, by End User 2020 & 2033
- Table 51: Global PropTech Revenue billion Forecast, by Country 2020 & 2033
- Table 52: China PropTech Revenue (billion) Forecast, by Application 2020 & 2033
- Table 53: India PropTech Revenue (billion) Forecast, by Application 2020 & 2033
- Table 54: Japan PropTech Revenue (billion) Forecast, by Application 2020 & 2033
- Table 55: South Korea PropTech Revenue (billion) Forecast, by Application 2020 & 2033
- Table 56: ASEAN PropTech Revenue (billion) Forecast, by Application 2020 & 2033
- Table 57: Oceania PropTech Revenue (billion) Forecast, by Application 2020 & 2033
- Table 58: Rest of Asia Pacific PropTech Revenue (billion) Forecast, by Application 2020 & 2033
Frequently Asked Questions
1. What is the projected Compound Annual Growth Rate (CAGR) of the PropTech?
The projected CAGR is approximately 16.1%.
2. Which companies are prominent players in the PropTech?
Key companies in the market include eSelf AI, VuHome.ai, Structurely, Ask the Agent, EliseAI, Placeform, Loft47, Matterport, Soul Machines, UneeQ, Others.
3. What are the main segments of the PropTech?
The market segments include Type, Property Type, Deployment, End User.
4. Can you provide details about the market size?
The market size is estimated to be USD 47.08 billion as of 2022.
5. What are some drivers contributing to market growth?
N/A
6. What are the notable trends driving market growth?
N/A
7. Are there any restraints impacting market growth?
N/A
8. Can you provide examples of recent developments in the market?
N/A
9. What pricing options are available for accessing the report?
Pricing options include single-user, multi-user, and enterprise licenses priced at USD 3350.00, USD 5025.00, and USD 6700.00 respectively.
10. Is the market size provided in terms of value or volume?
The market size is provided in terms of value, measured in billion.
11. Are there any specific market keywords associated with the report?
Yes, the market keyword associated with the report is "PropTech," which aids in identifying and referencing the specific market segment covered.
12. How do I determine which pricing option suits my needs best?
The pricing options vary based on user requirements and access needs. Individual users may opt for single-user licenses, while businesses requiring broader access may choose multi-user or enterprise licenses for cost-effective access to the report.
13. Are there any additional resources or data provided in the PropTech report?
While the report offers comprehensive insights, it's advisable to review the specific contents or supplementary materials provided to ascertain if additional resources or data are available.
14. How can I stay updated on further developments or reports in the PropTech?
To stay informed about further developments, trends, and reports in the PropTech, consider subscribing to industry newsletters, following relevant companies and organizations, or regularly checking reputable industry news sources and publications.
Methodology
Step 1 - Identification of Relevant Samples Size from Population Database


Step 2 - Approaches for Defining Global Market Size (Value, Volume* & Price*)

Note*: In applicable scenarios
Step 3 - Data Sources
Primary Research
- Web Analytics
- Survey Reports
- Research Institute
- Latest Research Reports
- Opinion Leaders
Secondary Research
- Annual Reports
- White Paper
- Latest Press Release
- Industry Association
- Paid Database
- Investor Presentations

Step 4 - Data Triangulation
Involves using different sources of information in order to increase the validity of a study
These sources are likely to be stakeholders in a program - participants, other researchers, program staff, other community members, and so on.
Then we put all data in single framework & apply various statistical tools to find out the dynamic on the market.
During the analysis stage, feedback from the stakeholder groups would be compared to determine areas of agreement as well as areas of divergence