

Key Insights
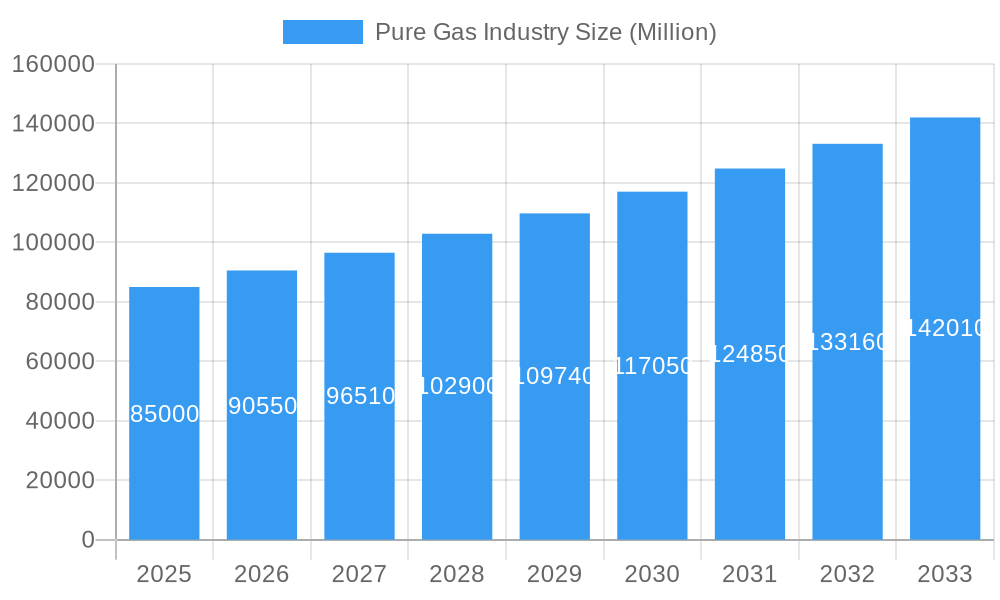
The global Pure Gas market is projected to reach 119.11 billion by 2025, exhibiting a Compound Annual Growth Rate (CAGR) of 4.4%. This expansion is driven by escalating demand from high-tech industries like electronics and healthcare, where ultra-pure gases are essential for advanced manufacturing, diagnostics, and life support. The electronics sector, crucial for semiconductor fabrication and device production, benefits from digital transformation. Simultaneously, the healthcare industry's increasing need for medical-grade gases for therapies and surgical procedures fuels market growth.
Pure Gas Industry Market Size (In Billion)
Further market expansion is attributed to the growing adoption of cryogenic technologies in research and specialized preservation, alongside the energy sector's focus on cleaner energy solutions, including battery manufacturing and fuel cell technology. Challenges include the high production and transportation costs of pure gases, stringent regulatory compliance, and the emergence of alternative technologies. Nevertheless, the indispensable role of pure gases in technological innovation secures a robust future for the global market.
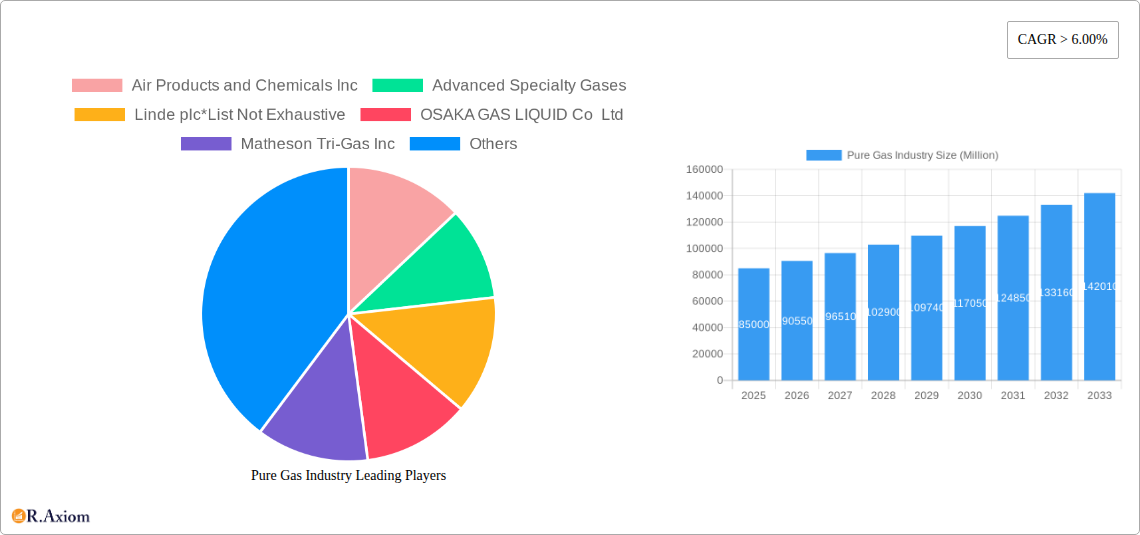
Pure Gas Industry Company Market Share
This report provides an in-depth analysis of the global Pure Gas industry, covering the period from 2019 to 2033, with 2025 as the base year.
Pure Gas Industry Market Concentration & Innovation
The Pure Gas Industry exhibits a moderate to high market concentration, with a few key players dominating global supply. Innovation is a significant driver, spurred by the increasing demand for high-purity gases in advanced applications within the electronics, medical, and aerospace sectors. Key innovation areas include advanced purification techniques, novel gas mixtures for specialized industrial processes, and sustainable production methods. Regulatory frameworks, such as those governing emissions and industrial safety, play a crucial role in shaping market practices and driving investment in compliance technologies. The threat of product substitutes is generally low for high-purity gases, given their unique chemical properties and essential roles in critical processes. End-user trends, such as the miniaturization of electronic components and the growing demand for specialized medical treatments, are directly influencing product development and market expansion. Mergers and acquisitions (M&A) activity, valued at an estimated $15 Billion over the historical period, is a key strategy for consolidation, market access, and technological integration. For instance, Air Products and Chemicals Inc. and Linde plc have been historically active in strategic acquisitions to expand their global footprint and product portfolios.
Pure Gas Industry Industry Trends & Insights
The Pure Gas Industry is poised for substantial growth, driven by an escalating demand for high-purity gases across diverse end-user sectors. The market is projected to experience a Compound Annual Growth Rate (CAGR) of approximately 6.8% during the forecast period. Technological advancements are at the forefront, with the development of more efficient gas separation and purification technologies, leading to higher purity levels and cost-effectiveness. This, in turn, facilitates wider adoption in sensitive applications like semiconductor manufacturing and advanced medical diagnostics. Consumer preferences are evolving towards sustainability and eco-friendly solutions, pushing manufacturers to invest in greener production processes and reduce the carbon footprint associated with gas production and distribution. Competitive dynamics are characterized by intense innovation, strategic partnerships, and a focus on customer-centric solutions. Companies are investing heavily in R&D to develop specialized gas mixtures tailored to specific industry needs, such as those required for advanced welding techniques or cryogenic applications in the food and beverage industry. Market penetration for specialized gases is expected to rise as emerging economies industrialize and adopt advanced technologies. The increasing reliance on automation and digitalization within manufacturing processes also fuels the demand for precise gas formulations to ensure quality and efficiency. The development of more compact and efficient on-site gas generation systems is another significant trend, offering cost savings and enhanced supply chain reliability for large consumers.
Dominant Markets & Segments in Pure Gas Industry
The global Pure Gas Industry is segmented by product type, application, and end-user industry, with significant regional variations influencing market dominance.
Product Type Dominance:
- High-Purity Atmospheric Gases: This segment, including oxygen, nitrogen, and argon, remains dominant due to their widespread use across numerous industries, particularly metal production, chemicals, and medical applications. Their essential role in industrial processes and life support systems ensures consistent high demand.
- Noble Gases: Helium, neon, krypton, and xenon are crucial for specialized applications like semiconductor manufacturing, advanced lighting, and medical imaging. Their unique properties drive growth, albeit from a smaller market share compared to atmospheric gases.
- Carbon Gases: Carbon dioxide and carbon monoxide find extensive use in the chemical industry, food and beverage (preservation and carbonation), and welding.
- Other Product Types: This includes specialty gases and mixtures tailored for specific research, analytical, and industrial purposes.
Application Dominance:
- Insulation: While not a primary direct application, the production of specialized gases used in cryogenic insulation for industries like aerospace and energy is a significant contributor.
- Lighting: Noble gases are critical for various lighting applications, from efficient fluorescent lamps to specialized industrial and medical lighting.
- Coolant: Cryogenic gases like liquid nitrogen and helium are essential coolants in research, medical imaging (MRI), and superconductivity applications.
- Other Applications: This broad category encompasses welding, metal fabrication, food processing, medical treatments, laboratory analysis, and semiconductor fabrication, which collectively represent the largest application segments.
End-user Industry Dominance:
- Electronics: This sector is a leading driver of demand for high-purity gases, particularly for semiconductor fabrication, where ultra-pure gases are essential for etching, deposition, and cleaning processes.
- Metal Production: Large volumes of atmospheric gases (oxygen, nitrogen) are consumed in steelmaking, welding, and other metal processing applications.
- Chemicals: Various pure gases are used as reactants, inerting agents, and process aids in the chemical manufacturing industry.
- Energy and Power: Gases are utilized in power generation, fuel cell technology, and for inerting in oil and gas operations.
- Medical and Healthcare: Medical-grade oxygen, nitrogen, and other specialty gases are indispensable for patient care, diagnostic equipment, and pharmaceutical manufacturing.
- Food and Beverages: Carbon dioxide for carbonation and nitrogen for modified atmosphere packaging (MAP) are key applications.
The dominance of these segments is influenced by global economic policies supporting industrial growth, infrastructure development in emerging economies, and stringent quality control requirements in advanced manufacturing and healthcare. The Asia-Pacific region, with its robust manufacturing base, particularly in electronics and metals, is expected to continue leading market growth.
Pure Gas Industry Product Developments
Product innovation in the Pure Gas Industry is centered on enhancing purity levels, developing novel gas mixtures for emerging applications, and improving delivery and handling systems. Companies are focusing on developing ultra-high purity gases for advanced semiconductor lithography and for use in next-generation computing technologies. Innovations in cryogenic technologies are enabling more efficient and cost-effective cooling solutions for superconducting magnets in medical imaging and scientific research. The development of portable and on-site gas generation systems addresses the need for localized and on-demand supply, particularly for remote or specialized operations. These developments aim to provide customers with enhanced process efficiency, improved product quality, and greater operational flexibility, thereby securing competitive advantages.
Report Scope & Segmentation Analysis
This report meticulously segments the Pure Gas Industry across three primary dimensions to provide a granular market view. The Product Type segmentation includes High-Purity Atmospheric Gases, Noble Gases, Carbon Gases, and Other Product Types, each with distinct market drivers and growth trajectories. The Application segmentation covers Insulation, Lighting, Coolant, and a broad Other Applications category, reflecting the diverse utility of pure gases. Finally, the End-user Industry segmentation analyzes the market penetration and demand from Electronics, Metal Production, Chemicals, Energy and Power, Medical and Healthcare, Food and Beverages, and Other End-user Industries. Growth projections and market sizes are detailed for each segment, with an estimated market size of $250 Billion for the base year 2025, and a forecast size of $420 Billion by 2033, indicating robust expansion across all identified segments.
Key Drivers of Pure Gas Industry Growth
The Pure Gas Industry's growth is propelled by several interconnected factors. Technological advancements in the electronics sector, particularly in semiconductor manufacturing, necessitate increasingly higher purity gases. The expansion of the medical and healthcare industry, with its growing reliance on diagnostic equipment and life support systems, is a significant driver. Furthermore, the increasing industrialization in emerging economies fuels demand for gases in metal production, chemicals, and manufacturing processes. Government initiatives supporting clean energy technologies and advancements in sustainable manufacturing practices also contribute to market expansion. The need for specialized gases in research and development across various scientific disciplines further underpins consistent growth.
Challenges in the Pure Gas Industry Sector
Despite robust growth, the Pure Gas Industry faces several challenges. Stringent regulatory requirements related to safety, handling, and environmental impact can increase operational costs and compliance burdens. Supply chain disruptions, particularly for gases like helium, can impact availability and price stability. The high energy consumption associated with gas production and purification poses environmental concerns and cost pressures. Intense competition among established players and the emergence of new entrants can lead to price sensitivity in certain market segments. Furthermore, the specialized infrastructure and logistical complexities associated with transporting and storing certain gases present ongoing operational hurdles.
Emerging Opportunities in Pure Gas Industry
The Pure Gas Industry is ripe with emerging opportunities. The burgeoning semiconductor industry, driven by AI and 5G technologies, presents a significant demand for ultra-high purity specialty gases. The rapid growth of the medical and healthcare sector, including advancements in personalized medicine and advanced imaging, creates new avenues for specialized medical gases. The increasing adoption of renewable energy technologies, such as hydrogen fuel cells, necessitates specialized gas infrastructure and supply chains. Furthermore, the expanding food and beverage industry's focus on shelf-life extension through modified atmosphere packaging offers a growing market for inert gases. Opportunities also lie in developing more sustainable and energy-efficient gas production methods and innovative gas delivery systems.
Leading Players in the Pure Gas Industry Market
- Air Products and Chemicals Inc.
- Advanced Specialty Gases
- Linde plc
- OSAKA GAS LIQUID Co Ltd
- Matheson Tri-Gas Inc.
- Iwatani Corporation
- American Welding & Gas
- Messer Group
- Air Liquide
- Airgas Inc.
Key Developments in Pure Gas Industry Industry
- 2023 August: Air Liquide announced a significant investment in expanding its production capacity for high-purity gases to meet growing demand from the semiconductor industry in Asia.
- 2023 June: Linde plc unveiled a new on-site hydrogen generation facility, enhancing its offerings for the growing clean energy sector in Europe.
- 2022 December: Air Products and Chemicals Inc. completed the acquisition of a specialty gas distributor, strengthening its market presence in North America.
- 2022 October: Osaka Gas Liquid Co Ltd introduced a new range of high-purity noble gases tailored for advanced display manufacturing.
- 2021 November: Matheson Tri-Gas Inc. launched an innovative gas purification system designed to reduce environmental impact and operational costs.
Strategic Outlook for Pure Gas Industry Market
The strategic outlook for the Pure Gas Industry is exceptionally positive, driven by sustained demand from key growth sectors and continuous technological innovation. Key growth catalysts include the escalating needs of the electronics industry for next-generation semiconductors, the expanding medical and healthcare landscape, and the global push towards cleaner energy solutions. Companies are expected to focus on strategic partnerships, capacity expansions, and investments in R&D to cater to niche applications and develop sustainable production methods. The market's trajectory indicates robust growth, presenting significant opportunities for stakeholders to capitalize on evolving industrial and technological landscapes.
Pure Gas Industry Segmentation
-
1. Product Type
- 1.1. High-Purity Atmospheric Gases
- 1.2. Noble Gases
- 1.3. Carbon Gases
- 1.4. Other Product Types
-
2. Application
- 2.1. Insulation
- 2.2. Lighting
- 2.3. Coolant
- 2.4. Other Applications
-
3. End-user Industry
- 3.1. Electronics
- 3.2. Metal Production
- 3.3. Chemicals
- 3.4. Energy and Power
- 3.5. Medical and Healthcare
- 3.6. Food and Beverages
- 3.7. Other End-user Industries
Pure Gas Industry Segmentation By Geography
-
1. Asia Pacific
- 1.1. China
- 1.2. India
- 1.3. Japan
- 1.4. South Korea
- 1.5. ASEAN Countries
- 1.6. Rest of Asia Pacific
-
2. North America
- 2.1. United States
- 2.2. Canada
- 2.3. Mexico
-
3. Europe
- 3.1. Germany
- 3.2. United Kingdom
- 3.3. Italy
- 3.4. France
- 3.5. Rest of Europe
-
4. South America
- 4.1. Brazil
- 4.2. Argentina
- 4.3. Rest of South America
-
5. Middle East and Africa
- 5.1. Saudi Arabia
- 5.2. South Africa
- 5.3. Rest of Middle East and Africa
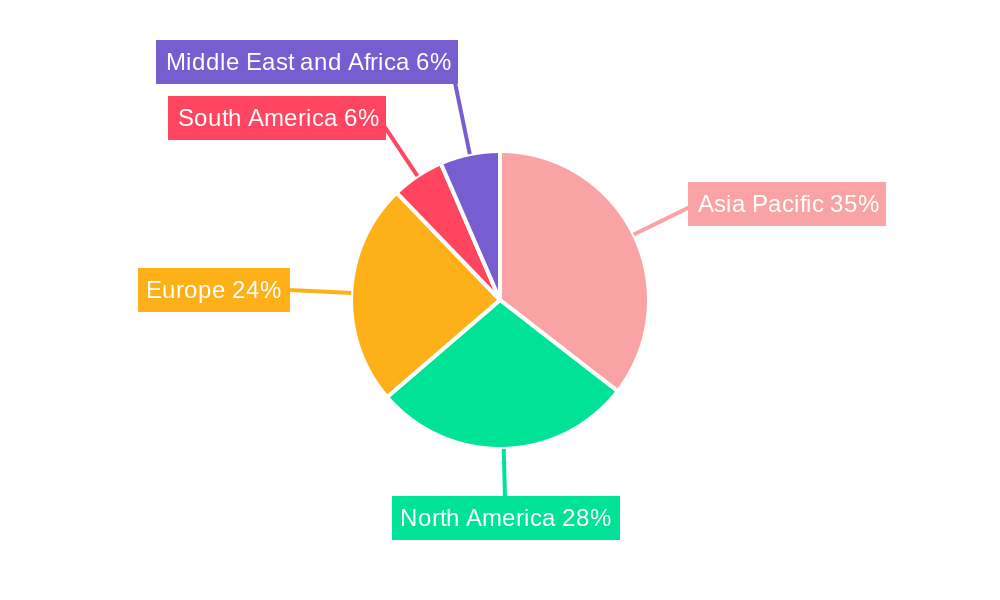
Pure Gas Industry Regional Market Share
Geographic Coverage of Pure Gas Industry
Pure Gas Industry REPORT HIGHLIGHTS
| Aspects | Details |
|---|---|
| Study Period | 2020-2034 |
| Base Year | 2025 |
| Estimated Year | 2026 |
| Forecast Period | 2026-2034 |
| Historical Period | 2020-2025 |
| Growth Rate | CAGR of 4.4% from 2020-2034 |
| Segmentation |
|
Table of Contents
- 1. Introduction
- 1.1. Research Scope
- 1.2. Market Segmentation
- 1.3. Research Objective
- 1.4. Definitions and Assumptions
- 2. Executive Summary
- 2.1. Market Snapshot
- 3. Market Dynamics
- 3.1. Market Drivers
- 3.2. Market Restrains
- 3.3. Market Trends
- 3.4. Market Opportunities
- 4. Market Factor Analysis
- 4.1. Porters Five Forces
- 4.1.1. Bargaining Power of Suppliers
- 4.1.2. Bargaining Power of Buyers
- 4.1.3. Threat of New Entrants
- 4.1.4. Threat of Substitutes
- 4.1.5. Competitive Rivalry
- 4.2. PESTEL analysis
- 4.3. BCG Analysis
- 4.3.1. Stars (High Growth, High Market Share)
- 4.3.2. Cash Cows (Low Growth, High Market Share)
- 4.3.3. Question Mark (High Growth, Low Market Share)
- 4.3.4. Dogs (Low Growth, Low Market Share)
- 4.4. Ansoff Matrix Analysis
- 4.5. Supply Chain Analysis
- 4.6. Regulatory Landscape
- 4.7. Current Market Potential and Opportunity Assessment (TAM–SAM–SOM Framework)
- 4.8. RAX Analyst Note
- 4.1. Porters Five Forces
- 5. Market Analysis, Insights and Forecast 2021-2033
- 5.1. Market Analysis, Insights and Forecast - by Product Type
- 5.1.1. High-Purity Atmospheric Gases
- 5.1.2. Noble Gases
- 5.1.3. Carbon Gases
- 5.1.4. Other Product Types
- 5.2. Market Analysis, Insights and Forecast - by Application
- 5.2.1. Insulation
- 5.2.2. Lighting
- 5.2.3. Coolant
- 5.2.4. Other Applications
- 5.3. Market Analysis, Insights and Forecast - by End-user Industry
- 5.3.1. Electronics
- 5.3.2. Metal Production
- 5.3.3. Chemicals
- 5.3.4. Energy and Power
- 5.3.5. Medical and Healthcare
- 5.3.6. Food and Beverages
- 5.3.7. Other End-user Industries
- 5.4. Market Analysis, Insights and Forecast - by Region
- 5.4.1. Asia Pacific
- 5.4.2. North America
- 5.4.3. Europe
- 5.4.4. South America
- 5.4.5. Middle East and Africa
- 5.1. Market Analysis, Insights and Forecast - by Product Type
- 6. Global Pure Gas Industry Analysis, Insights and Forecast, 2021-2033
- 6.1. Market Analysis, Insights and Forecast - by Product Type
- 6.1.1. High-Purity Atmospheric Gases
- 6.1.2. Noble Gases
- 6.1.3. Carbon Gases
- 6.1.4. Other Product Types
- 6.2. Market Analysis, Insights and Forecast - by Application
- 6.2.1. Insulation
- 6.2.2. Lighting
- 6.2.3. Coolant
- 6.2.4. Other Applications
- 6.3. Market Analysis, Insights and Forecast - by End-user Industry
- 6.3.1. Electronics
- 6.3.2. Metal Production
- 6.3.3. Chemicals
- 6.3.4. Energy and Power
- 6.3.5. Medical and Healthcare
- 6.3.6. Food and Beverages
- 6.3.7. Other End-user Industries
- 6.1. Market Analysis, Insights and Forecast - by Product Type
- 7. Asia Pacific Pure Gas Industry Analysis, Insights and Forecast, 2020-2032
- 7.1. Market Analysis, Insights and Forecast - by Product Type
- 7.1.1. High-Purity Atmospheric Gases
- 7.1.2. Noble Gases
- 7.1.3. Carbon Gases
- 7.1.4. Other Product Types
- 7.2. Market Analysis, Insights and Forecast - by Application
- 7.2.1. Insulation
- 7.2.2. Lighting
- 7.2.3. Coolant
- 7.2.4. Other Applications
- 7.3. Market Analysis, Insights and Forecast - by End-user Industry
- 7.3.1. Electronics
- 7.3.2. Metal Production
- 7.3.3. Chemicals
- 7.3.4. Energy and Power
- 7.3.5. Medical and Healthcare
- 7.3.6. Food and Beverages
- 7.3.7. Other End-user Industries
- 7.1. Market Analysis, Insights and Forecast - by Product Type
- 8. North America Pure Gas Industry Analysis, Insights and Forecast, 2020-2032
- 8.1. Market Analysis, Insights and Forecast - by Product Type
- 8.1.1. High-Purity Atmospheric Gases
- 8.1.2. Noble Gases
- 8.1.3. Carbon Gases
- 8.1.4. Other Product Types
- 8.2. Market Analysis, Insights and Forecast - by Application
- 8.2.1. Insulation
- 8.2.2. Lighting
- 8.2.3. Coolant
- 8.2.4. Other Applications
- 8.3. Market Analysis, Insights and Forecast - by End-user Industry
- 8.3.1. Electronics
- 8.3.2. Metal Production
- 8.3.3. Chemicals
- 8.3.4. Energy and Power
- 8.3.5. Medical and Healthcare
- 8.3.6. Food and Beverages
- 8.3.7. Other End-user Industries
- 8.1. Market Analysis, Insights and Forecast - by Product Type
- 9. Europe Pure Gas Industry Analysis, Insights and Forecast, 2020-2032
- 9.1. Market Analysis, Insights and Forecast - by Product Type
- 9.1.1. High-Purity Atmospheric Gases
- 9.1.2. Noble Gases
- 9.1.3. Carbon Gases
- 9.1.4. Other Product Types
- 9.2. Market Analysis, Insights and Forecast - by Application
- 9.2.1. Insulation
- 9.2.2. Lighting
- 9.2.3. Coolant
- 9.2.4. Other Applications
- 9.3. Market Analysis, Insights and Forecast - by End-user Industry
- 9.3.1. Electronics
- 9.3.2. Metal Production
- 9.3.3. Chemicals
- 9.3.4. Energy and Power
- 9.3.5. Medical and Healthcare
- 9.3.6. Food and Beverages
- 9.3.7. Other End-user Industries
- 9.1. Market Analysis, Insights and Forecast - by Product Type
- 10. South America Pure Gas Industry Analysis, Insights and Forecast, 2020-2032
- 10.1. Market Analysis, Insights and Forecast - by Product Type
- 10.1.1. High-Purity Atmospheric Gases
- 10.1.2. Noble Gases
- 10.1.3. Carbon Gases
- 10.1.4. Other Product Types
- 10.2. Market Analysis, Insights and Forecast - by Application
- 10.2.1. Insulation
- 10.2.2. Lighting
- 10.2.3. Coolant
- 10.2.4. Other Applications
- 10.3. Market Analysis, Insights and Forecast - by End-user Industry
- 10.3.1. Electronics
- 10.3.2. Metal Production
- 10.3.3. Chemicals
- 10.3.4. Energy and Power
- 10.3.5. Medical and Healthcare
- 10.3.6. Food and Beverages
- 10.3.7. Other End-user Industries
- 10.1. Market Analysis, Insights and Forecast - by Product Type
- 11. Middle East and Africa Pure Gas Industry Analysis, Insights and Forecast, 2020-2032
- 11.1. Market Analysis, Insights and Forecast - by Product Type
- 11.1.1. High-Purity Atmospheric Gases
- 11.1.2. Noble Gases
- 11.1.3. Carbon Gases
- 11.1.4. Other Product Types
- 11.2. Market Analysis, Insights and Forecast - by Application
- 11.2.1. Insulation
- 11.2.2. Lighting
- 11.2.3. Coolant
- 11.2.4. Other Applications
- 11.3. Market Analysis, Insights and Forecast - by End-user Industry
- 11.3.1. Electronics
- 11.3.2. Metal Production
- 11.3.3. Chemicals
- 11.3.4. Energy and Power
- 11.3.5. Medical and Healthcare
- 11.3.6. Food and Beverages
- 11.3.7. Other End-user Industries
- 11.1. Market Analysis, Insights and Forecast - by Product Type
- 12. Competitive Analysis
- 12.1. Company Profiles
- 12.1.1 Air Products and Chemicals Inc
- 12.1.1.1. Company Overview
- 12.1.1.2. Products
- 12.1.1.3. Company Financials
- 12.1.1.4. SWOT Analysis
- 12.1.2 Advanced Specialty Gases
- 12.1.2.1. Company Overview
- 12.1.2.2. Products
- 12.1.2.3. Company Financials
- 12.1.2.4. SWOT Analysis
- 12.1.3 Linde plc*List Not Exhaustive
- 12.1.3.1. Company Overview
- 12.1.3.2. Products
- 12.1.3.3. Company Financials
- 12.1.3.4. SWOT Analysis
- 12.1.4 OSAKA GAS LIQUID Co Ltd
- 12.1.4.1. Company Overview
- 12.1.4.2. Products
- 12.1.4.3. Company Financials
- 12.1.4.4. SWOT Analysis
- 12.1.5 Matheson Tri-Gas Inc
- 12.1.5.1. Company Overview
- 12.1.5.2. Products
- 12.1.5.3. Company Financials
- 12.1.5.4. SWOT Analysis
- 12.1.6 Iwatani Corporation
- 12.1.6.1. Company Overview
- 12.1.6.2. Products
- 12.1.6.3. Company Financials
- 12.1.6.4. SWOT Analysis
- 12.1.7 American Welding & Gas
- 12.1.7.1. Company Overview
- 12.1.7.2. Products
- 12.1.7.3. Company Financials
- 12.1.7.4. SWOT Analysis
- 12.1.8 Messer Group
- 12.1.8.1. Company Overview
- 12.1.8.2. Products
- 12.1.8.3. Company Financials
- 12.1.8.4. SWOT Analysis
- 12.1.9 Air Liquide
- 12.1.9.1. Company Overview
- 12.1.9.2. Products
- 12.1.9.3. Company Financials
- 12.1.9.4. SWOT Analysis
- 12.1.10 Airgas Inc
- 12.1.10.1. Company Overview
- 12.1.10.2. Products
- 12.1.10.3. Company Financials
- 12.1.10.4. SWOT Analysis
- 12.1.1 Air Products and Chemicals Inc
- 12.2. Market Entropy
- 12.2.1 Company's Key Areas Served
- 12.2.2 Recent Developments
- 12.3. Company Market Share Analysis 2025
- 12.3.1 Top 5 Companies Market Share Analysis
- 12.3.2 Top 3 Companies Market Share Analysis
- 12.4. List of Potential Customers
- 13. Research Methodology
List of Figures
- Figure 1: Global Pure Gas Industry Revenue Breakdown (billion, %) by Region 2025 & 2033
- Figure 2: Asia Pacific Pure Gas Industry Revenue (billion), by Product Type 2025 & 2033
- Figure 3: Asia Pacific Pure Gas Industry Revenue Share (%), by Product Type 2025 & 2033
- Figure 4: Asia Pacific Pure Gas Industry Revenue (billion), by Application 2025 & 2033
- Figure 5: Asia Pacific Pure Gas Industry Revenue Share (%), by Application 2025 & 2033
- Figure 6: Asia Pacific Pure Gas Industry Revenue (billion), by End-user Industry 2025 & 2033
- Figure 7: Asia Pacific Pure Gas Industry Revenue Share (%), by End-user Industry 2025 & 2033
- Figure 8: Asia Pacific Pure Gas Industry Revenue (billion), by Country 2025 & 2033
- Figure 9: Asia Pacific Pure Gas Industry Revenue Share (%), by Country 2025 & 2033
- Figure 10: North America Pure Gas Industry Revenue (billion), by Product Type 2025 & 2033
- Figure 11: North America Pure Gas Industry Revenue Share (%), by Product Type 2025 & 2033
- Figure 12: North America Pure Gas Industry Revenue (billion), by Application 2025 & 2033
- Figure 13: North America Pure Gas Industry Revenue Share (%), by Application 2025 & 2033
- Figure 14: North America Pure Gas Industry Revenue (billion), by End-user Industry 2025 & 2033
- Figure 15: North America Pure Gas Industry Revenue Share (%), by End-user Industry 2025 & 2033
- Figure 16: North America Pure Gas Industry Revenue (billion), by Country 2025 & 2033
- Figure 17: North America Pure Gas Industry Revenue Share (%), by Country 2025 & 2033
- Figure 18: Europe Pure Gas Industry Revenue (billion), by Product Type 2025 & 2033
- Figure 19: Europe Pure Gas Industry Revenue Share (%), by Product Type 2025 & 2033
- Figure 20: Europe Pure Gas Industry Revenue (billion), by Application 2025 & 2033
- Figure 21: Europe Pure Gas Industry Revenue Share (%), by Application 2025 & 2033
- Figure 22: Europe Pure Gas Industry Revenue (billion), by End-user Industry 2025 & 2033
- Figure 23: Europe Pure Gas Industry Revenue Share (%), by End-user Industry 2025 & 2033
- Figure 24: Europe Pure Gas Industry Revenue (billion), by Country 2025 & 2033
- Figure 25: Europe Pure Gas Industry Revenue Share (%), by Country 2025 & 2033
- Figure 26: South America Pure Gas Industry Revenue (billion), by Product Type 2025 & 2033
- Figure 27: South America Pure Gas Industry Revenue Share (%), by Product Type 2025 & 2033
- Figure 28: South America Pure Gas Industry Revenue (billion), by Application 2025 & 2033
- Figure 29: South America Pure Gas Industry Revenue Share (%), by Application 2025 & 2033
- Figure 30: South America Pure Gas Industry Revenue (billion), by End-user Industry 2025 & 2033
- Figure 31: South America Pure Gas Industry Revenue Share (%), by End-user Industry 2025 & 2033
- Figure 32: South America Pure Gas Industry Revenue (billion), by Country 2025 & 2033
- Figure 33: South America Pure Gas Industry Revenue Share (%), by Country 2025 & 2033
- Figure 34: Middle East and Africa Pure Gas Industry Revenue (billion), by Product Type 2025 & 2033
- Figure 35: Middle East and Africa Pure Gas Industry Revenue Share (%), by Product Type 2025 & 2033
- Figure 36: Middle East and Africa Pure Gas Industry Revenue (billion), by Application 2025 & 2033
- Figure 37: Middle East and Africa Pure Gas Industry Revenue Share (%), by Application 2025 & 2033
- Figure 38: Middle East and Africa Pure Gas Industry Revenue (billion), by End-user Industry 2025 & 2033
- Figure 39: Middle East and Africa Pure Gas Industry Revenue Share (%), by End-user Industry 2025 & 2033
- Figure 40: Middle East and Africa Pure Gas Industry Revenue (billion), by Country 2025 & 2033
- Figure 41: Middle East and Africa Pure Gas Industry Revenue Share (%), by Country 2025 & 2033
List of Tables
- Table 1: Global Pure Gas Industry Revenue billion Forecast, by Product Type 2020 & 2033
- Table 2: Global Pure Gas Industry Revenue billion Forecast, by Application 2020 & 2033
- Table 3: Global Pure Gas Industry Revenue billion Forecast, by End-user Industry 2020 & 2033
- Table 4: Global Pure Gas Industry Revenue billion Forecast, by Region 2020 & 2033
- Table 5: Global Pure Gas Industry Revenue billion Forecast, by Product Type 2020 & 2033
- Table 6: Global Pure Gas Industry Revenue billion Forecast, by Application 2020 & 2033
- Table 7: Global Pure Gas Industry Revenue billion Forecast, by End-user Industry 2020 & 2033
- Table 8: Global Pure Gas Industry Revenue billion Forecast, by Country 2020 & 2033
- Table 9: China Pure Gas Industry Revenue (billion) Forecast, by Application 2020 & 2033
- Table 10: India Pure Gas Industry Revenue (billion) Forecast, by Application 2020 & 2033
- Table 11: Japan Pure Gas Industry Revenue (billion) Forecast, by Application 2020 & 2033
- Table 12: South Korea Pure Gas Industry Revenue (billion) Forecast, by Application 2020 & 2033
- Table 13: ASEAN Countries Pure Gas Industry Revenue (billion) Forecast, by Application 2020 & 2033
- Table 14: Rest of Asia Pacific Pure Gas Industry Revenue (billion) Forecast, by Application 2020 & 2033
- Table 15: Global Pure Gas Industry Revenue billion Forecast, by Product Type 2020 & 2033
- Table 16: Global Pure Gas Industry Revenue billion Forecast, by Application 2020 & 2033
- Table 17: Global Pure Gas Industry Revenue billion Forecast, by End-user Industry 2020 & 2033
- Table 18: Global Pure Gas Industry Revenue billion Forecast, by Country 2020 & 2033
- Table 19: United States Pure Gas Industry Revenue (billion) Forecast, by Application 2020 & 2033
- Table 20: Canada Pure Gas Industry Revenue (billion) Forecast, by Application 2020 & 2033
- Table 21: Mexico Pure Gas Industry Revenue (billion) Forecast, by Application 2020 & 2033
- Table 22: Global Pure Gas Industry Revenue billion Forecast, by Product Type 2020 & 2033
- Table 23: Global Pure Gas Industry Revenue billion Forecast, by Application 2020 & 2033
- Table 24: Global Pure Gas Industry Revenue billion Forecast, by End-user Industry 2020 & 2033
- Table 25: Global Pure Gas Industry Revenue billion Forecast, by Country 2020 & 2033
- Table 26: Germany Pure Gas Industry Revenue (billion) Forecast, by Application 2020 & 2033
- Table 27: United Kingdom Pure Gas Industry Revenue (billion) Forecast, by Application 2020 & 2033
- Table 28: Italy Pure Gas Industry Revenue (billion) Forecast, by Application 2020 & 2033
- Table 29: France Pure Gas Industry Revenue (billion) Forecast, by Application 2020 & 2033
- Table 30: Rest of Europe Pure Gas Industry Revenue (billion) Forecast, by Application 2020 & 2033
- Table 31: Global Pure Gas Industry Revenue billion Forecast, by Product Type 2020 & 2033
- Table 32: Global Pure Gas Industry Revenue billion Forecast, by Application 2020 & 2033
- Table 33: Global Pure Gas Industry Revenue billion Forecast, by End-user Industry 2020 & 2033
- Table 34: Global Pure Gas Industry Revenue billion Forecast, by Country 2020 & 2033
- Table 35: Brazil Pure Gas Industry Revenue (billion) Forecast, by Application 2020 & 2033
- Table 36: Argentina Pure Gas Industry Revenue (billion) Forecast, by Application 2020 & 2033
- Table 37: Rest of South America Pure Gas Industry Revenue (billion) Forecast, by Application 2020 & 2033
- Table 38: Global Pure Gas Industry Revenue billion Forecast, by Product Type 2020 & 2033
- Table 39: Global Pure Gas Industry Revenue billion Forecast, by Application 2020 & 2033
- Table 40: Global Pure Gas Industry Revenue billion Forecast, by End-user Industry 2020 & 2033
- Table 41: Global Pure Gas Industry Revenue billion Forecast, by Country 2020 & 2033
- Table 42: Saudi Arabia Pure Gas Industry Revenue (billion) Forecast, by Application 2020 & 2033
- Table 43: South Africa Pure Gas Industry Revenue (billion) Forecast, by Application 2020 & 2033
- Table 44: Rest of Middle East and Africa Pure Gas Industry Revenue (billion) Forecast, by Application 2020 & 2033
Frequently Asked Questions
1. What is the projected Compound Annual Growth Rate (CAGR) of the Pure Gas Industry?
The projected CAGR is approximately 4.4%.
2. Which companies are prominent players in the Pure Gas Industry?
Key companies in the market include Air Products and Chemicals Inc, Advanced Specialty Gases, Linde plc*List Not Exhaustive, OSAKA GAS LIQUID Co Ltd, Matheson Tri-Gas Inc, Iwatani Corporation, American Welding & Gas, Messer Group, Air Liquide, Airgas Inc.
3. What are the main segments of the Pure Gas Industry?
The market segments include Product Type, Application, End-user Industry.
4. Can you provide details about the market size?
The market size is estimated to be USD 119.11 billion as of 2022.
5. What are some drivers contributing to market growth?
; Increasing Demand from Electronics Industry; Rising Demand for Solar PV Production.
6. What are the notable trends driving market growth?
Noble Gas Product Type to Dominate the Market.
7. Are there any restraints impacting market growth?
; High Cost of Indium Tin Oxide; Other Restraints.
8. Can you provide examples of recent developments in the market?
N/A
9. What pricing options are available for accessing the report?
Pricing options include single-user, multi-user, and enterprise licenses priced at USD 4750, USD 5250, and USD 8750 respectively.
10. Is the market size provided in terms of value or volume?
The market size is provided in terms of value, measured in billion.
11. Are there any specific market keywords associated with the report?
Yes, the market keyword associated with the report is "Pure Gas Industry," which aids in identifying and referencing the specific market segment covered.
12. How do I determine which pricing option suits my needs best?
The pricing options vary based on user requirements and access needs. Individual users may opt for single-user licenses, while businesses requiring broader access may choose multi-user or enterprise licenses for cost-effective access to the report.
13. Are there any additional resources or data provided in the Pure Gas Industry report?
While the report offers comprehensive insights, it's advisable to review the specific contents or supplementary materials provided to ascertain if additional resources or data are available.
14. How can I stay updated on further developments or reports in the Pure Gas Industry?
To stay informed about further developments, trends, and reports in the Pure Gas Industry, consider subscribing to industry newsletters, following relevant companies and organizations, or regularly checking reputable industry news sources and publications.
Methodology
Step 1 - Identification of Relevant Samples Size from Population Database


Step 2 - Approaches for Defining Global Market Size (Value, Volume* & Price*)

Note*: In applicable scenarios
Step 3 - Data Sources
Primary Research
- Web Analytics
- Survey Reports
- Research Institute
- Latest Research Reports
- Opinion Leaders
Secondary Research
- Annual Reports
- White Paper
- Latest Press Release
- Industry Association
- Paid Database
- Investor Presentations

Step 4 - Data Triangulation
Involves using different sources of information in order to increase the validity of a study
These sources are likely to be stakeholders in a program - participants, other researchers, program staff, other community members, and so on.
Then we put all data in single framework & apply various statistical tools to find out the dynamic on the market.
During the analysis stage, feedback from the stakeholder groups would be compared to determine areas of agreement as well as areas of divergence