


Key Insights
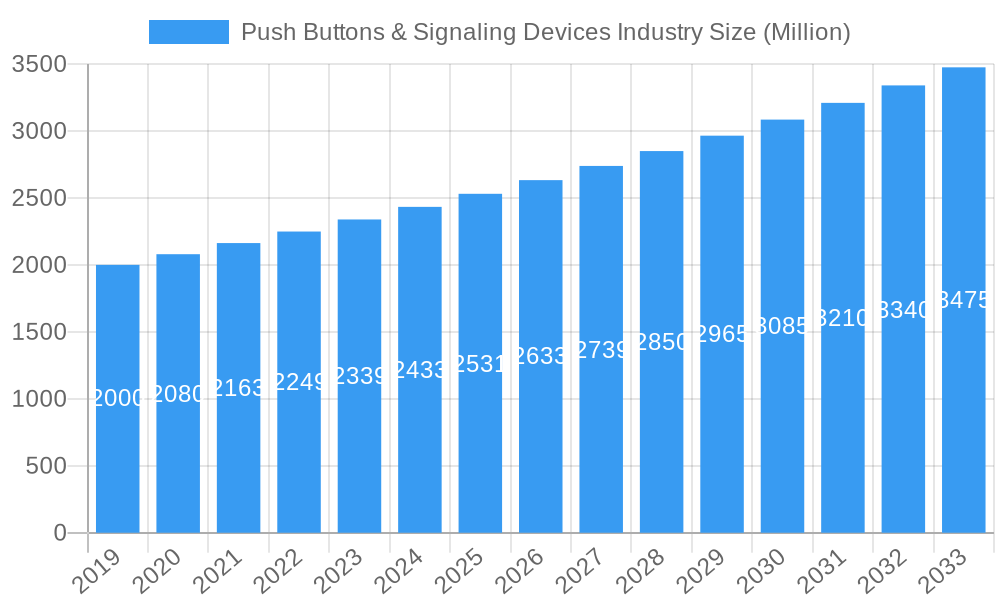
The global Push Buttons & Signaling Devices market is projected to reach approximately $2.5 billion by 2025, with a Compound Annual Growth Rate (CAGR) of 4.9% through 2033. This expansion is fueled by the growing demand for industrial automation across manufacturing, automotive, and energy sectors, driven by the need for enhanced operational safety, efficient monitoring, and streamlined control systems. Technological advancements, including integrated smart signaling, touch-sensitive interfaces, and energy-efficient LED indicators, are accelerating market adoption. The rise of predictive maintenance and the Industrial Internet of Things (IIoT) presents new growth opportunities as these devices are vital for real-time operational data transmission.
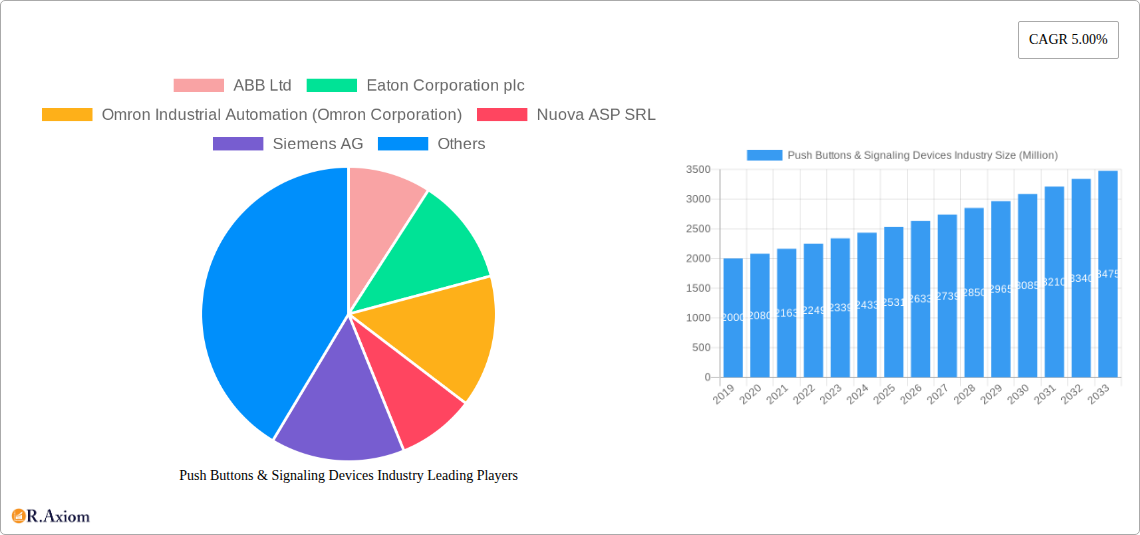
Push Buttons & Signaling Devices Industry Market Size (In Billion)

Market trends indicate a shift towards integrating advanced functionalities beyond basic operations to complex signaling sequences and data communication. While established segments like "Round or Square Body Type" and "Non-lighted Push Button" remain significant, the "Other Products" segment, encompassing advanced signaling towers and multi-function control units, is poised for dynamic growth. Similarly, within signaling types, "Audible" and "Visible" devices are standard, but "Other Types," including intelligent and networked solutions, will drive innovation. Geographically, the Asia Pacific region leads due to its robust manufacturing base and rapid industrialization. North America and Europe remain key markets, focusing on upgrading existing infrastructure with smart technologies. Potential restraints, such as the initial cost of advanced automation and component supply chain disruptions, are being addressed through strategic investments and diversified sourcing.
Push Buttons & Signaling Devices Industry Company Market Share
Push Buttons & Signaling Devices Industry Market Concentration & Innovation
The global Push Buttons & Signaling Devices Industry exhibits a moderate to high market concentration, with key players like Siemens AG, Eaton Corporation plc, ABB Ltd, and Schneider Electric dominating a significant portion of the market share. These multinational corporations leverage their extensive product portfolios, robust distribution networks, and continuous investment in research and development to maintain their competitive edge. Innovation drivers within the industry are primarily fueled by the increasing demand for automation, smart manufacturing (Industry 4.0), and enhanced safety systems across various end-user sectors. The development of advanced signaling devices with integrated connectivity, remote monitoring capabilities, and sophisticated diagnostic features is a testament to this innovation push. Regulatory frameworks, particularly concerning industrial safety standards and environmental compliance, play a crucial role in shaping product development and market entry strategies. The presence of product substitutes, such as human-machine interface (HMI) panels and advanced control systems, necessitates a constant focus on cost-effectiveness and specialized functionalities for push buttons and signaling devices. End-user trends, including the electrification of industries and the growing adoption of IoT in industrial environments, are further influencing the product roadmap and market demand. Merger and acquisition (M&A) activities, while not as frequent as in some other industrial sectors, often involve strategic consolidations to expand product offerings or gain access to new technological capabilities or regional markets. The overall value of M&A deals is estimated to be in the range of tens to hundreds of million dollars annually, reflecting the strategic importance of acquiring niche technologies or market positions.
Push Buttons & Signaling Devices Industry Industry Trends & Insights
The Push Buttons & Signaling Devices Industry is poised for significant growth, driven by a confluence of technological advancements, expanding industrial automation, and increasing emphasis on operational safety and efficiency. The market is experiencing robust expansion, with an estimated Compound Annual Growth Rate (CAGR) of XX% during the forecast period of 2025–2033. This growth trajectory is largely underpinned by the accelerating adoption of Industry 4.0 principles, where intelligent signaling devices are integral to the seamless operation of smart factories. The demand for highly reliable and intuitive push buttons and signaling devices is escalating as manufacturers strive to optimize production processes, reduce downtime, and enhance worker safety. Technological disruptions, such as the integration of AI for predictive maintenance in signaling systems and the widespread adoption of wireless connectivity for remote monitoring and control, are reshaping the competitive landscape. Furthermore, the development of energy-efficient signaling solutions and the miniaturization of components are catering to a broader range of applications, including those in space-constrained environments. Consumer preferences are evolving towards more user-friendly interfaces, customizable signaling solutions, and devices that offer advanced diagnostics and fault detection capabilities. The competitive dynamics are characterized by a strategic interplay between established global players and emerging regional manufacturers, each vying for market share through product differentiation, pricing strategies, and strategic partnerships. The increasing penetration of automated systems across diverse sectors like automotive manufacturing, food and beverage processing, and energy infrastructure is a primary market penetration driver, projected to reach XX% by 2033. The ongoing digitalization trend across industries necessitates sophisticated and interconnected signaling solutions, further bolstering market expansion. The shift towards more sustainable manufacturing practices also influences product development, with an emphasis on durable and energy-efficient signaling devices. The market is witnessing a continuous evolution in product features, moving beyond basic functionality to offer advanced intelligence and connectivity.
Dominant Markets & Segments in Push Buttons & Signaling Devices Industry
The global Push Buttons & Signaling Devices Industry is characterized by the dominance of specific regions, countries, and product segments, driven by robust industrial activity, technological adoption rates, and economic policies.
Leading Region: North America and Europe currently lead the market, owing to their well-established manufacturing bases, high adoption of automation technologies, and stringent safety regulations. Asia Pacific, particularly China, is emerging as a rapidly growing market, fueled by massive industrialization and increasing investments in smart manufacturing.
Dominant Product Segments:
- Product Type: The Round or Square Body Type segment holds a substantial market share due to its versatility and widespread application across various industrial settings. Non-lighted push buttons continue to be a staple, particularly in basic control applications, but the demand for illuminated and advanced push buttons is rapidly increasing.
- Types: Visible signaling devices, such as stack lights and beacons, are crucial for conveying operational status and alerts in noisy or complex industrial environments. Audible signaling devices, like buzzers and sirens, also play a critical role in emergency situations and process notifications. The "Other Types" category encompasses advanced signaling solutions with integrated communication capabilities.
Dominant End-User Industries:
- Manufacturing: This sector is the largest consumer of push buttons and signaling devices, driven by the continuous need for automation, process control, and worker safety in assembly lines, production facilities, and material handling systems.
- Automotive: The automotive industry's transition to advanced manufacturing techniques and the increasing complexity of vehicle assembly lines necessitate a high volume of signaling components for machine control and operator feedback.
- Energy and Power: This sector utilizes robust signaling devices for the safe and efficient operation of power generation plants, substations, and renewable energy installations, where reliable status indication and emergency signaling are paramount.
- Food and Beverage: Strict hygiene and safety regulations in this industry drive the demand for specialized, easy-to-clean signaling devices that can withstand harsh environmental conditions.
Key drivers for the dominance of these segments include government initiatives promoting industrial automation, significant capital expenditure in manufacturing infrastructure, and the growing awareness of workplace safety protocols. For instance, economic policies encouraging domestic manufacturing and investments in Industry 4.0 in countries like Germany and the United States significantly boost the demand for sophisticated push buttons and signaling devices. The increasing complexity of industrial machinery and the need for precise operational feedback further propel the growth of specialized product types.
Push Buttons & Signaling Devices Industry Product Developments
Product development in the Push Buttons & Signaling Devices Industry is sharply focused on enhancing functionality, connectivity, and user experience. Innovations include the integration of IoT capabilities for remote monitoring and data analytics, enabling predictive maintenance and proactive issue resolution. The development of more compact and robust designs caters to space-constrained applications and harsh industrial environments. Advancements in LED technology have led to more energy-efficient and brighter illuminated signaling devices with customizable color options. Furthermore, the incorporation of advanced materials ensures increased durability and resistance to chemicals and extreme temperatures, providing a competitive advantage in demanding sectors.
Report Scope & Segmentation Analysis
This report provides a comprehensive analysis of the global Push Buttons & Signaling Devices Industry from 2019 to 2033, with a base year of 2025 and a forecast period of 2025–2033. The market is segmented across key dimensions to offer detailed insights.
- Product Type: Analysis includes the Round or Square Body Type, Non-lighted Push Button, and Other Products segments, examining their respective market sizes, growth projections, and competitive dynamics.
- Types: The report covers Audible, Visible, and Other Types of signaling devices, detailing their adoption trends and market penetration across various industries.
- End-user Industry: Key end-user industries such as Automotive, Energy and Power, Manufacturing, Food and Beverage, and Other End-user Industries are analyzed, with a focus on their unique demand patterns and growth potential.
Key Drivers of Push Buttons & Signaling Devices Industry Growth
The growth of the Push Buttons & Signaling Devices Industry is propelled by several pivotal factors. The accelerating pace of industrial automation and the widespread adoption of Industry 4.0 principles are creating an unprecedented demand for sophisticated signaling and control components. Enhanced safety regulations across global industries are also a significant driver, necessitating reliable alert and control systems to prevent accidents and ensure compliance. Furthermore, the increasing digitalization of manufacturing processes and the integration of IoT technologies require intelligent signaling devices that can provide real-time data and connectivity. The ongoing electrification of various sectors, from transportation to industrial machinery, further expands the application base for these critical components.
Challenges in the Push Buttons & Signaling Devices Industry Sector
Despite the positive growth outlook, the Push Buttons & Signaling Devices Industry faces several challenges. Intense competition from both established players and emerging manufacturers leads to price pressures and the need for continuous innovation to maintain market share. Supply chain disruptions, particularly those impacting the availability of raw materials and electronic components, can affect production timelines and costs. Evolving regulatory landscapes, especially regarding cybersecurity for connected devices, require significant investment in compliance and product development. The high initial cost of advanced automation solutions can also be a barrier for smaller enterprises, slowing down adoption rates in certain segments.
Emerging Opportunities in Push Buttons & Signaling Devices Industry
The Push Buttons & Signaling Devices Industry is ripe with emerging opportunities. The growing demand for smart factory solutions and the Internet of Things (IoT) integration presents a significant avenue for growth, with opportunities in developing connected and intelligent signaling devices. The expansion of renewable energy infrastructure globally creates a substantial market for robust and reliable signaling systems. Furthermore, the increasing focus on worker safety in developing economies and the need for advanced emergency alert systems offer untapped potential. The development of AI-powered signaling devices capable of predictive analytics and anomaly detection also represents a promising area for future innovation and market penetration.
Leading Players in the Push Buttons & Signaling Devices Industry Market
- ABB Ltd
- Eaton Corporation plc
- Omron Industrial Automation (Omron Corporation)
- Nuova ASP SRL
- Siemens AG
- Oslo Switch Inc
- Schneider Electric
- Switronic Industrial Corp
- Rockwell Automation Inc
- BACO Controls Inc
Key Developments in Push Buttons & Signaling Devices Industry Industry
- September 2022 - The Blue Valley School District announced a new crisis alert system that allows Blue Valley staff members to call for help by pushing a button with a specialized badge. This system will be added to schools during the 2022-23 school year.
Strategic Outlook for Push Buttons & Signaling Devices Industry Market
The strategic outlook for the Push Buttons & Signaling Devices Industry is exceptionally promising, driven by the relentless march of industrial automation and digitalization. Future growth will be characterized by an increased emphasis on smart, connected, and predictive signaling solutions. Companies that invest in R&D for IoT integration, AI capabilities, and advanced materials will be well-positioned to capture market share. Strategic partnerships and collaborations will be crucial for expanding product portfolios and market reach. The growing global awareness of workplace safety and the increasing adoption of automation in emerging economies present significant opportunities for sustained revenue growth and market leadership.
Push Buttons & Signaling Devices Industry Segmentation
-
1. Product
- 1.1. Round or Square Body Type
- 1.2. Non-lighted Push Button
- 1.3. Other Products
-
2. Types
- 2.1. Audible
- 2.2. Visible
- 2.3. Other Types
-
3. End-user Industry
- 3.1. Automotive
- 3.2. Energy and Power
- 3.3. Manufacturing
- 3.4. Food and Beverage
- 3.5. Other End-user Industries
Push Buttons & Signaling Devices Industry Segmentation By Geography
- 1. North America
- 2. Europe
- 3. Asia Pacific
- 4. Latin America
- 5. Middle East and Africa
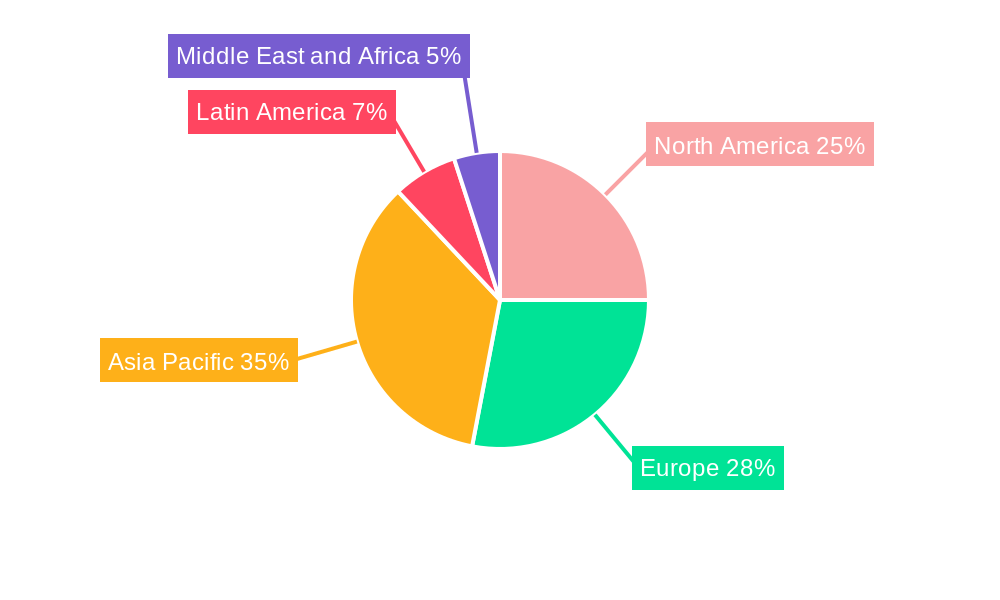
Push Buttons & Signaling Devices Industry Regional Market Share
Geographic Coverage of Push Buttons & Signaling Devices Industry
Push Buttons & Signaling Devices Industry REPORT HIGHLIGHTS
| Aspects | Details |
|---|---|
| Study Period | 2020-2034 |
| Base Year | 2025 |
| Estimated Year | 2026 |
| Forecast Period | 2026-2034 |
| Historical Period | 2020-2025 |
| Growth Rate | CAGR of 4.9% from 2020-2034 |
| Segmentation |
|
Table of Contents
- 1. Introduction
- 1.1. Research Scope
- 1.2. Market Segmentation
- 1.3. Research Methodology
- 1.4. Definitions and Assumptions
- 2. Executive Summary
- 2.1. Introduction
- 3. Market Dynamics
- 3.1. Introduction
- 3.2. Market Drivers
- 3.2.1. Creating Safe Working Environment For The Industrial Workers; Favorable Government Regulations For Industrial Safety
- 3.3. Market Restrains
- 3.3.1. High Initial Investment in Creating Supporting Infrastructure and Automation
- 3.4. Market Trends
- 3.4.1. Automotive Industry to Drive the Market Growth
- 4. Market Factor Analysis
- 4.1. Porters Five Forces
- 4.2. Supply/Value Chain
- 4.3. PESTEL analysis
- 4.4. Market Entropy
- 4.5. Patent/Trademark Analysis
- 5. Global Push Buttons & Signaling Devices Industry Analysis, Insights and Forecast, 2020-2032
- 5.1. Market Analysis, Insights and Forecast - by Product
- 5.1.1. Round or Square Body Type
- 5.1.2. Non-lighted Push Button
- 5.1.3. Other Products
- 5.2. Market Analysis, Insights and Forecast - by Types
- 5.2.1. Audible
- 5.2.2. Visible
- 5.2.3. Other Types
- 5.3. Market Analysis, Insights and Forecast - by End-user Industry
- 5.3.1. Automotive
- 5.3.2. Energy and Power
- 5.3.3. Manufacturing
- 5.3.4. Food and Beverage
- 5.3.5. Other End-user Industries
- 5.4. Market Analysis, Insights and Forecast - by Region
- 5.4.1. North America
- 5.4.2. Europe
- 5.4.3. Asia Pacific
- 5.4.4. Latin America
- 5.4.5. Middle East and Africa
- 5.1. Market Analysis, Insights and Forecast - by Product
- 6. North America Push Buttons & Signaling Devices Industry Analysis, Insights and Forecast, 2020-2032
- 6.1. Market Analysis, Insights and Forecast - by Product
- 6.1.1. Round or Square Body Type
- 6.1.2. Non-lighted Push Button
- 6.1.3. Other Products
- 6.2. Market Analysis, Insights and Forecast - by Types
- 6.2.1. Audible
- 6.2.2. Visible
- 6.2.3. Other Types
- 6.3. Market Analysis, Insights and Forecast - by End-user Industry
- 6.3.1. Automotive
- 6.3.2. Energy and Power
- 6.3.3. Manufacturing
- 6.3.4. Food and Beverage
- 6.3.5. Other End-user Industries
- 6.1. Market Analysis, Insights and Forecast - by Product
- 7. Europe Push Buttons & Signaling Devices Industry Analysis, Insights and Forecast, 2020-2032
- 7.1. Market Analysis, Insights and Forecast - by Product
- 7.1.1. Round or Square Body Type
- 7.1.2. Non-lighted Push Button
- 7.1.3. Other Products
- 7.2. Market Analysis, Insights and Forecast - by Types
- 7.2.1. Audible
- 7.2.2. Visible
- 7.2.3. Other Types
- 7.3. Market Analysis, Insights and Forecast - by End-user Industry
- 7.3.1. Automotive
- 7.3.2. Energy and Power
- 7.3.3. Manufacturing
- 7.3.4. Food and Beverage
- 7.3.5. Other End-user Industries
- 7.1. Market Analysis, Insights and Forecast - by Product
- 8. Asia Pacific Push Buttons & Signaling Devices Industry Analysis, Insights and Forecast, 2020-2032
- 8.1. Market Analysis, Insights and Forecast - by Product
- 8.1.1. Round or Square Body Type
- 8.1.2. Non-lighted Push Button
- 8.1.3. Other Products
- 8.2. Market Analysis, Insights and Forecast - by Types
- 8.2.1. Audible
- 8.2.2. Visible
- 8.2.3. Other Types
- 8.3. Market Analysis, Insights and Forecast - by End-user Industry
- 8.3.1. Automotive
- 8.3.2. Energy and Power
- 8.3.3. Manufacturing
- 8.3.4. Food and Beverage
- 8.3.5. Other End-user Industries
- 8.1. Market Analysis, Insights and Forecast - by Product
- 9. Latin America Push Buttons & Signaling Devices Industry Analysis, Insights and Forecast, 2020-2032
- 9.1. Market Analysis, Insights and Forecast - by Product
- 9.1.1. Round or Square Body Type
- 9.1.2. Non-lighted Push Button
- 9.1.3. Other Products
- 9.2. Market Analysis, Insights and Forecast - by Types
- 9.2.1. Audible
- 9.2.2. Visible
- 9.2.3. Other Types
- 9.3. Market Analysis, Insights and Forecast - by End-user Industry
- 9.3.1. Automotive
- 9.3.2. Energy and Power
- 9.3.3. Manufacturing
- 9.3.4. Food and Beverage
- 9.3.5. Other End-user Industries
- 9.1. Market Analysis, Insights and Forecast - by Product
- 10. Middle East and Africa Push Buttons & Signaling Devices Industry Analysis, Insights and Forecast, 2020-2032
- 10.1. Market Analysis, Insights and Forecast - by Product
- 10.1.1. Round or Square Body Type
- 10.1.2. Non-lighted Push Button
- 10.1.3. Other Products
- 10.2. Market Analysis, Insights and Forecast - by Types
- 10.2.1. Audible
- 10.2.2. Visible
- 10.2.3. Other Types
- 10.3. Market Analysis, Insights and Forecast - by End-user Industry
- 10.3.1. Automotive
- 10.3.2. Energy and Power
- 10.3.3. Manufacturing
- 10.3.4. Food and Beverage
- 10.3.5. Other End-user Industries
- 10.1. Market Analysis, Insights and Forecast - by Product
- 11. Competitive Analysis
- 11.1. Global Market Share Analysis 2025
- 11.2. Company Profiles
- 11.2.1 ABB Ltd
- 11.2.1.1. Overview
- 11.2.1.2. Products
- 11.2.1.3. SWOT Analysis
- 11.2.1.4. Recent Developments
- 11.2.1.5. Financials (Based on Availability)
- 11.2.2 Eaton Corporation plc
- 11.2.2.1. Overview
- 11.2.2.2. Products
- 11.2.2.3. SWOT Analysis
- 11.2.2.4. Recent Developments
- 11.2.2.5. Financials (Based on Availability)
- 11.2.3 Omron Industrial Automation (Omron Corporation)
- 11.2.3.1. Overview
- 11.2.3.2. Products
- 11.2.3.3. SWOT Analysis
- 11.2.3.4. Recent Developments
- 11.2.3.5. Financials (Based on Availability)
- 11.2.4 Nuova ASP SRL
- 11.2.4.1. Overview
- 11.2.4.2. Products
- 11.2.4.3. SWOT Analysis
- 11.2.4.4. Recent Developments
- 11.2.4.5. Financials (Based on Availability)
- 11.2.5 Siemens AG
- 11.2.5.1. Overview
- 11.2.5.2. Products
- 11.2.5.3. SWOT Analysis
- 11.2.5.4. Recent Developments
- 11.2.5.5. Financials (Based on Availability)
- 11.2.6 Oslo Switch Inc *List Not Exhaustive
- 11.2.6.1. Overview
- 11.2.6.2. Products
- 11.2.6.3. SWOT Analysis
- 11.2.6.4. Recent Developments
- 11.2.6.5. Financials (Based on Availability)
- 11.2.7 Schneider Electric
- 11.2.7.1. Overview
- 11.2.7.2. Products
- 11.2.7.3. SWOT Analysis
- 11.2.7.4. Recent Developments
- 11.2.7.5. Financials (Based on Availability)
- 11.2.8 Switronic Industrial Corp
- 11.2.8.1. Overview
- 11.2.8.2. Products
- 11.2.8.3. SWOT Analysis
- 11.2.8.4. Recent Developments
- 11.2.8.5. Financials (Based on Availability)
- 11.2.9 Rockwell Automation Inc
- 11.2.9.1. Overview
- 11.2.9.2. Products
- 11.2.9.3. SWOT Analysis
- 11.2.9.4. Recent Developments
- 11.2.9.5. Financials (Based on Availability)
- 11.2.10 BACO Controls Inc
- 11.2.10.1. Overview
- 11.2.10.2. Products
- 11.2.10.3. SWOT Analysis
- 11.2.10.4. Recent Developments
- 11.2.10.5. Financials (Based on Availability)
- 11.2.1 ABB Ltd
List of Figures
- Figure 1: Global Push Buttons & Signaling Devices Industry Revenue Breakdown (billion, %) by Region 2025 & 2033
- Figure 2: North America Push Buttons & Signaling Devices Industry Revenue (billion), by Product 2025 & 2033
- Figure 3: North America Push Buttons & Signaling Devices Industry Revenue Share (%), by Product 2025 & 2033
- Figure 4: North America Push Buttons & Signaling Devices Industry Revenue (billion), by Types 2025 & 2033
- Figure 5: North America Push Buttons & Signaling Devices Industry Revenue Share (%), by Types 2025 & 2033
- Figure 6: North America Push Buttons & Signaling Devices Industry Revenue (billion), by End-user Industry 2025 & 2033
- Figure 7: North America Push Buttons & Signaling Devices Industry Revenue Share (%), by End-user Industry 2025 & 2033
- Figure 8: North America Push Buttons & Signaling Devices Industry Revenue (billion), by Country 2025 & 2033
- Figure 9: North America Push Buttons & Signaling Devices Industry Revenue Share (%), by Country 2025 & 2033
- Figure 10: Europe Push Buttons & Signaling Devices Industry Revenue (billion), by Product 2025 & 2033
- Figure 11: Europe Push Buttons & Signaling Devices Industry Revenue Share (%), by Product 2025 & 2033
- Figure 12: Europe Push Buttons & Signaling Devices Industry Revenue (billion), by Types 2025 & 2033
- Figure 13: Europe Push Buttons & Signaling Devices Industry Revenue Share (%), by Types 2025 & 2033
- Figure 14: Europe Push Buttons & Signaling Devices Industry Revenue (billion), by End-user Industry 2025 & 2033
- Figure 15: Europe Push Buttons & Signaling Devices Industry Revenue Share (%), by End-user Industry 2025 & 2033
- Figure 16: Europe Push Buttons & Signaling Devices Industry Revenue (billion), by Country 2025 & 2033
- Figure 17: Europe Push Buttons & Signaling Devices Industry Revenue Share (%), by Country 2025 & 2033
- Figure 18: Asia Pacific Push Buttons & Signaling Devices Industry Revenue (billion), by Product 2025 & 2033
- Figure 19: Asia Pacific Push Buttons & Signaling Devices Industry Revenue Share (%), by Product 2025 & 2033
- Figure 20: Asia Pacific Push Buttons & Signaling Devices Industry Revenue (billion), by Types 2025 & 2033
- Figure 21: Asia Pacific Push Buttons & Signaling Devices Industry Revenue Share (%), by Types 2025 & 2033
- Figure 22: Asia Pacific Push Buttons & Signaling Devices Industry Revenue (billion), by End-user Industry 2025 & 2033
- Figure 23: Asia Pacific Push Buttons & Signaling Devices Industry Revenue Share (%), by End-user Industry 2025 & 2033
- Figure 24: Asia Pacific Push Buttons & Signaling Devices Industry Revenue (billion), by Country 2025 & 2033
- Figure 25: Asia Pacific Push Buttons & Signaling Devices Industry Revenue Share (%), by Country 2025 & 2033
- Figure 26: Latin America Push Buttons & Signaling Devices Industry Revenue (billion), by Product 2025 & 2033
- Figure 27: Latin America Push Buttons & Signaling Devices Industry Revenue Share (%), by Product 2025 & 2033
- Figure 28: Latin America Push Buttons & Signaling Devices Industry Revenue (billion), by Types 2025 & 2033
- Figure 29: Latin America Push Buttons & Signaling Devices Industry Revenue Share (%), by Types 2025 & 2033
- Figure 30: Latin America Push Buttons & Signaling Devices Industry Revenue (billion), by End-user Industry 2025 & 2033
- Figure 31: Latin America Push Buttons & Signaling Devices Industry Revenue Share (%), by End-user Industry 2025 & 2033
- Figure 32: Latin America Push Buttons & Signaling Devices Industry Revenue (billion), by Country 2025 & 2033
- Figure 33: Latin America Push Buttons & Signaling Devices Industry Revenue Share (%), by Country 2025 & 2033
- Figure 34: Middle East and Africa Push Buttons & Signaling Devices Industry Revenue (billion), by Product 2025 & 2033
- Figure 35: Middle East and Africa Push Buttons & Signaling Devices Industry Revenue Share (%), by Product 2025 & 2033
- Figure 36: Middle East and Africa Push Buttons & Signaling Devices Industry Revenue (billion), by Types 2025 & 2033
- Figure 37: Middle East and Africa Push Buttons & Signaling Devices Industry Revenue Share (%), by Types 2025 & 2033
- Figure 38: Middle East and Africa Push Buttons & Signaling Devices Industry Revenue (billion), by End-user Industry 2025 & 2033
- Figure 39: Middle East and Africa Push Buttons & Signaling Devices Industry Revenue Share (%), by End-user Industry 2025 & 2033
- Figure 40: Middle East and Africa Push Buttons & Signaling Devices Industry Revenue (billion), by Country 2025 & 2033
- Figure 41: Middle East and Africa Push Buttons & Signaling Devices Industry Revenue Share (%), by Country 2025 & 2033
List of Tables
- Table 1: Global Push Buttons & Signaling Devices Industry Revenue billion Forecast, by Product 2020 & 2033
- Table 2: Global Push Buttons & Signaling Devices Industry Revenue billion Forecast, by Types 2020 & 2033
- Table 3: Global Push Buttons & Signaling Devices Industry Revenue billion Forecast, by End-user Industry 2020 & 2033
- Table 4: Global Push Buttons & Signaling Devices Industry Revenue billion Forecast, by Region 2020 & 2033
- Table 5: Global Push Buttons & Signaling Devices Industry Revenue billion Forecast, by Product 2020 & 2033
- Table 6: Global Push Buttons & Signaling Devices Industry Revenue billion Forecast, by Types 2020 & 2033
- Table 7: Global Push Buttons & Signaling Devices Industry Revenue billion Forecast, by End-user Industry 2020 & 2033
- Table 8: Global Push Buttons & Signaling Devices Industry Revenue billion Forecast, by Country 2020 & 2033
- Table 9: Global Push Buttons & Signaling Devices Industry Revenue billion Forecast, by Product 2020 & 2033
- Table 10: Global Push Buttons & Signaling Devices Industry Revenue billion Forecast, by Types 2020 & 2033
- Table 11: Global Push Buttons & Signaling Devices Industry Revenue billion Forecast, by End-user Industry 2020 & 2033
- Table 12: Global Push Buttons & Signaling Devices Industry Revenue billion Forecast, by Country 2020 & 2033
- Table 13: Global Push Buttons & Signaling Devices Industry Revenue billion Forecast, by Product 2020 & 2033
- Table 14: Global Push Buttons & Signaling Devices Industry Revenue billion Forecast, by Types 2020 & 2033
- Table 15: Global Push Buttons & Signaling Devices Industry Revenue billion Forecast, by End-user Industry 2020 & 2033
- Table 16: Global Push Buttons & Signaling Devices Industry Revenue billion Forecast, by Country 2020 & 2033
- Table 17: Global Push Buttons & Signaling Devices Industry Revenue billion Forecast, by Product 2020 & 2033
- Table 18: Global Push Buttons & Signaling Devices Industry Revenue billion Forecast, by Types 2020 & 2033
- Table 19: Global Push Buttons & Signaling Devices Industry Revenue billion Forecast, by End-user Industry 2020 & 2033
- Table 20: Global Push Buttons & Signaling Devices Industry Revenue billion Forecast, by Country 2020 & 2033
- Table 21: Global Push Buttons & Signaling Devices Industry Revenue billion Forecast, by Product 2020 & 2033
- Table 22: Global Push Buttons & Signaling Devices Industry Revenue billion Forecast, by Types 2020 & 2033
- Table 23: Global Push Buttons & Signaling Devices Industry Revenue billion Forecast, by End-user Industry 2020 & 2033
- Table 24: Global Push Buttons & Signaling Devices Industry Revenue billion Forecast, by Country 2020 & 2033
Frequently Asked Questions
1. What is the projected Compound Annual Growth Rate (CAGR) of the Push Buttons & Signaling Devices Industry?
The projected CAGR is approximately 4.9%.
2. Which companies are prominent players in the Push Buttons & Signaling Devices Industry?
Key companies in the market include ABB Ltd, Eaton Corporation plc, Omron Industrial Automation (Omron Corporation), Nuova ASP SRL, Siemens AG, Oslo Switch Inc *List Not Exhaustive, Schneider Electric, Switronic Industrial Corp, Rockwell Automation Inc, BACO Controls Inc.
3. What are the main segments of the Push Buttons & Signaling Devices Industry?
The market segments include Product, Types, End-user Industry.
4. Can you provide details about the market size?
The market size is estimated to be USD 2.59 billion as of 2022.
5. What are some drivers contributing to market growth?
Creating Safe Working Environment For The Industrial Workers; Favorable Government Regulations For Industrial Safety.
6. What are the notable trends driving market growth?
Automotive Industry to Drive the Market Growth.
7. Are there any restraints impacting market growth?
High Initial Investment in Creating Supporting Infrastructure and Automation.
8. Can you provide examples of recent developments in the market?
September 2022 - The Blue Valley School District announced a new crisis alert system that allows Blue Valley staff members to call for help by pushing a button with a specialized badge. This system will be added to schools during the 2022-23 school year.
9. What pricing options are available for accessing the report?
Pricing options include single-user, multi-user, and enterprise licenses priced at USD 4750, USD 5250, and USD 8750 respectively.
10. Is the market size provided in terms of value or volume?
The market size is provided in terms of value, measured in billion.
11. Are there any specific market keywords associated with the report?
Yes, the market keyword associated with the report is "Push Buttons & Signaling Devices Industry," which aids in identifying and referencing the specific market segment covered.
12. How do I determine which pricing option suits my needs best?
The pricing options vary based on user requirements and access needs. Individual users may opt for single-user licenses, while businesses requiring broader access may choose multi-user or enterprise licenses for cost-effective access to the report.
13. Are there any additional resources or data provided in the Push Buttons & Signaling Devices Industry report?
While the report offers comprehensive insights, it's advisable to review the specific contents or supplementary materials provided to ascertain if additional resources or data are available.
14. How can I stay updated on further developments or reports in the Push Buttons & Signaling Devices Industry?
To stay informed about further developments, trends, and reports in the Push Buttons & Signaling Devices Industry, consider subscribing to industry newsletters, following relevant companies and organizations, or regularly checking reputable industry news sources and publications.
Methodology
Step 1 - Identification of Relevant Samples Size from Population Database


Step 2 - Approaches for Defining Global Market Size (Value, Volume* & Price*)

Note*: In applicable scenarios
Step 3 - Data Sources
Primary Research
- Web Analytics
- Survey Reports
- Research Institute
- Latest Research Reports
- Opinion Leaders
Secondary Research
- Annual Reports
- White Paper
- Latest Press Release
- Industry Association
- Paid Database
- Investor Presentations

Step 4 - Data Triangulation
Involves using different sources of information in order to increase the validity of a study
These sources are likely to be stakeholders in a program - participants, other researchers, program staff, other community members, and so on.
Then we put all data in single framework & apply various statistical tools to find out the dynamic on the market.
During the analysis stage, feedback from the stakeholder groups would be compared to determine areas of agreement as well as areas of divergence