

Key Insights
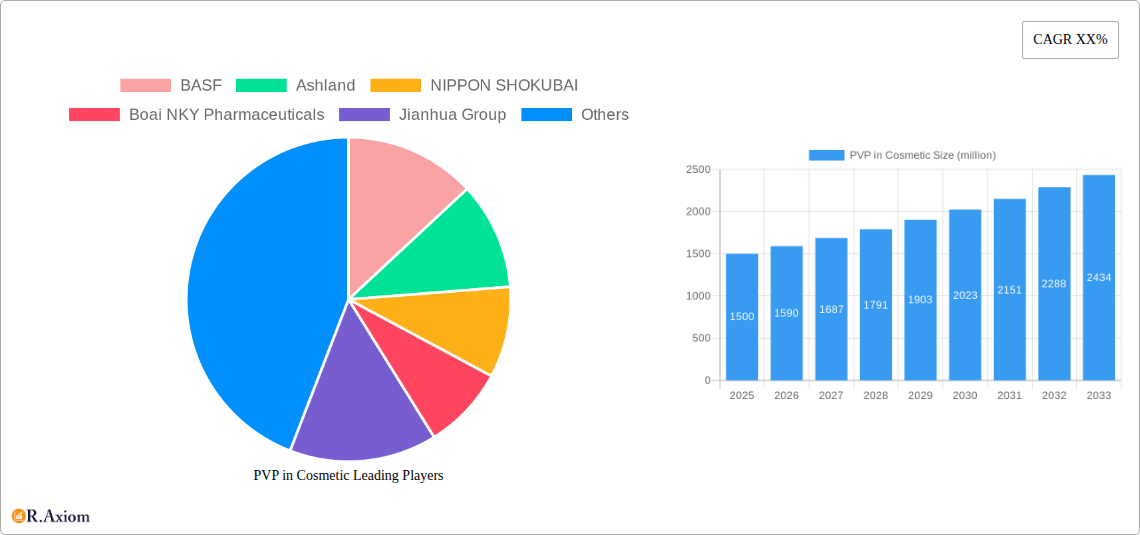
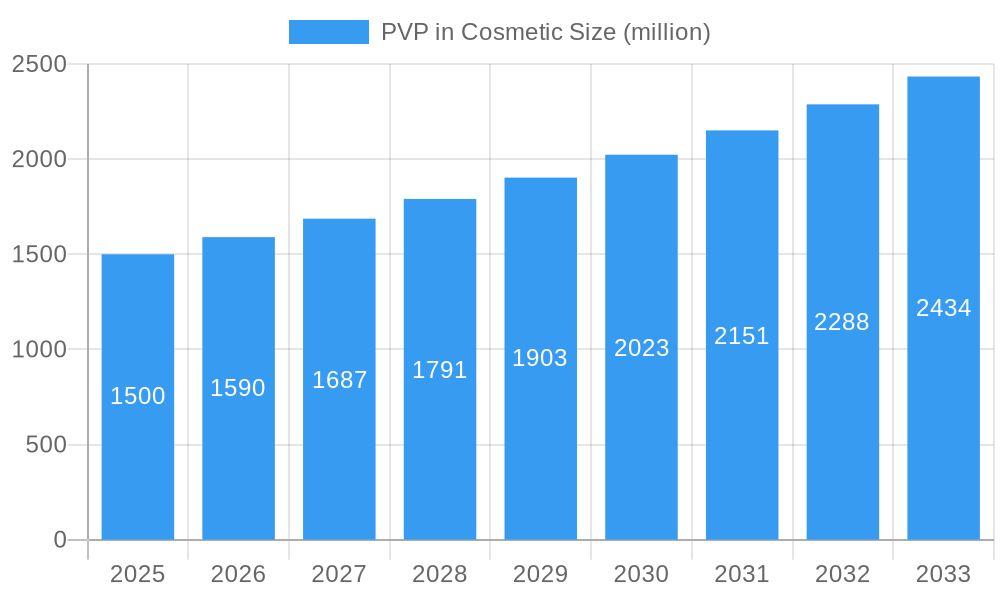
The global Polyvinylpyrrolidone (PVP) in Cosmetics market is experiencing robust growth, driven by increasing demand for advanced hair care and skin care products. The market, valued at approximately $1.5 billion in 2025, is projected to exhibit a Compound Annual Growth Rate (CAGR) of 6% from 2025 to 2033, reaching an estimated $2.5 billion by 2033. This growth is fueled by several key factors. Firstly, the rising consumer preference for natural and organic cosmetics is driving innovation in formulations, with PVP playing a crucial role as a versatile binder, film-former, and stabilizer. Secondly, the expanding market for premium and specialized cosmetic products, such as anti-aging creams and hair styling gels, further boosts demand for PVP due to its ability to enhance product texture and performance. Finally, advances in PVP manufacturing techniques are leading to higher-quality, more cost-effective materials, contributing to its widespread adoption across the cosmetics industry. Major players like BASF and Ashland are actively investing in research and development, further solidifying PVP's position as a key ingredient.
PVP in Cosmetic Market Size (In Billion)
However, certain restraints exist. Fluctuations in raw material prices and stringent regulatory requirements for cosmetic ingredients can impact market growth. Furthermore, the emergence of alternative binding agents and film-formers could pose a challenge. Despite these constraints, the market's positive trajectory is projected to continue due to the inherent advantages of PVP in cosmetic applications—its biocompatibility, versatility, and effectiveness in improving product efficacy and sensory properties. Regional market variations are anticipated, with North America and Europe leading in consumption due to established cosmetics industries and high consumer spending. Asia-Pacific is expected to witness substantial growth owing to increasing disposable income and rising demand for high-quality cosmetic products. The market is segmented based on product type (e.g., PVP K-series, PVP K30, PVP K90), application (hair care, skin care, makeup), and geographic region.
PVP in Cosmetic Company Market Share
PVP in Cosmetic Market: A Comprehensive Report (2019-2033)
This comprehensive report provides a detailed analysis of the global PVP in cosmetic market, offering invaluable insights for industry stakeholders. The report covers the period from 2019 to 2033, with a focus on the forecast period of 2025-2033 and a base year of 2025. The study meticulously examines market dynamics, competitive landscapes, and future growth trajectories, enabling informed decision-making. Expected market value figures are provided in millions of dollars.
PVP in Cosmetic Market Concentration & Innovation
The global PVP in cosmetic market exhibits a moderately concentrated structure, with key players like BASF, Ashland, and NIPPON SHOKUBAI holding significant market share. The exact market share distribution for 2025 is estimated at: BASF (xx%), Ashland (xx%), NIPPON SHOKUBAI (xx%), with the remaining share distributed among other players including Boai NKY Pharmaceuticals, Jianhua Group, Jiaozuo Zhongwei, Special Products Pharmaceutical, Huangshan Bonsun Pharmaceuticals, Meida Fine Chemical, and Sichuan Tianhua. Innovation in the sector is driven by the demand for higher-performance, eco-friendly, and multifunctional PVP-based cosmetic ingredients. Regulatory frameworks, such as those concerning ingredient safety and environmental impact, heavily influence product development. Substitute products, like other film-forming polymers, present competitive challenges. End-user trends, such as the increasing preference for natural and sustainable cosmetics, are shaping the market.
M&A Activity: The past five years have witnessed xx million dollars in M&A activity within the PVP in cosmetic market, primarily focused on expanding product portfolios and market reach.
- Innovation Drivers: Sustainability, enhanced performance characteristics (e.g., improved film formation, better viscosity control), and multi-functional ingredient development.
- Regulatory Frameworks: Stringent safety and environmental regulations impacting ingredient selection and formulation.
- Product Substitutes: Competition from other film-forming polymers and natural alternatives.
- End-User Trends: Growing demand for natural, organic, and sustainable cosmetics.
PVP in Cosmetic Industry Trends & Insights
The PVP in cosmetic market is projected to experience robust growth throughout the forecast period (2025-2033), with an estimated CAGR of xx%. This growth is fueled by several factors. Firstly, the rising demand for cosmetic products globally, particularly in developing economies, is significantly boosting market expansion. Secondly, technological advancements are enabling the development of novel PVP formulations with enhanced properties. Consumer preferences are shifting towards products with improved efficacy, safety, and sustainability, driving innovation and shaping market trends. Competitive dynamics are characterized by intense rivalry among established players and the emergence of new entrants, prompting continuous innovation and improvement in product offerings. Market penetration of PVP in various cosmetic applications, like hair care and skincare, is steadily increasing.
Dominant Markets & Segments in PVP in Cosmetic
The Asia-Pacific region is currently the dominant market for PVP in cosmetics, driven by factors such as:
- Rapid economic growth: Increased disposable incomes are fuelling higher spending on cosmetic products.
- Growing middle class: A burgeoning middle class with rising aspirations for personal care and beauty.
- Favorable demographic trends: A large and young population base with a strong interest in beauty and personal care.
- Favorable government policies: Supportive regulations and infrastructure development in the cosmetic industry.
- Strong domestic production: A significant manufacturing base in countries such as China and India.
Within the Asia-Pacific region, China and India stand out as the leading national markets due to their immense population size and rapid growth in the cosmetic industry. The hair care segment holds the largest share of the PVP in cosmetic market, followed by skincare and makeup. These segments' dominance is attributed to the extensive use of PVP in various formulations to enhance product performance and texture.
PVP in Cosmetic Product Developments
Recent product innovations focus on developing bio-based and sustainable PVP variants to meet growing consumer demand for eco-friendly cosmetics. These new formulations offer enhanced performance characteristics, such as improved film formation, better viscosity control, and superior stability. The focus is on developing multifunctional PVP ingredients that combine multiple benefits, such as conditioning, film-forming, and emulsification properties, thereby increasing their appeal to cosmetic manufacturers. This innovation contributes significantly to the improved efficacy, safety, and sustainability of the products.
Report Scope & Segmentation Analysis
This report segments the PVP in cosmetic market based on:
- Type: This segment covers different grades of PVP, considering their molecular weight and applications. The market size for each type varies, with xx million for high-molecular-weight PVP, and xx million for low-molecular-weight PVP. Market growth varies due to the unique characteristics and specific applications of each type.
- Application: This includes hair care (projected to reach xx million by 2033), skin care (xx million by 2033), makeup (xx million by 2033), and others. The competitive dynamics within each application segment are influenced by factors like specific performance requirements and consumer preferences.
- Region: This analysis includes North America, Europe, Asia-Pacific, the Middle East & Africa, and South America. Each region displays different growth rates, based on their respective economic conditions and consumer behavior.
Key Drivers of PVP in Cosmetic Growth
The growth of the PVP in cosmetic market is fueled by several key drivers: the rising demand for cosmetic products globally; advancements in PVP technology leading to enhanced product performance; and shifting consumer preferences towards natural, organic, and sustainable cosmetic formulations. Favorable regulatory policies in some regions promote industry growth. The increasing use of PVP in various cosmetic applications like hair care, skincare, and makeup also contributes to the market's expansion.
Challenges in the PVP in Cosmetic Sector
The PVP in cosmetic sector faces challenges like fluctuating raw material prices, stringent regulatory requirements concerning ingredient safety and environmental impact, and intense competition from substitute products. Supply chain disruptions can also affect the availability and price of PVP, impacting overall market dynamics. The cumulative effect of these challenges can influence market growth trajectories.
Emerging Opportunities in PVP in Cosmetic
Emerging opportunities include the development of biodegradable and sustainable PVP variants, catering to the rising demand for eco-friendly cosmetics. Expansion into new markets, particularly in developing economies, presents significant growth potential. Innovations in PVP technology, offering enhanced functionalities and improved performance characteristics, continue to open new avenues for market penetration. The development of advanced formulations for specific cosmetic applications creates further opportunities.
Leading Players in the PVP in Cosmetic Market
- BASF
- Ashland
- NIPPON SHOKUBAI
- Boai NKY Pharmaceuticals
- Jianhua Group
- Jiaozuo Zhongwei
- Special Products Pharmaceutical
- Huangshan Bonsun Pharmaceuticals
- Meida Fine Chemical
- Sichuan Tianhua
Key Developments in PVP in Cosmetic Industry
- 2021 Q3: BASF launched a new sustainable PVP grade for cosmetic applications.
- 2022 Q1: Ashland acquired a smaller PVP manufacturer, expanding its product portfolio.
- 2023 Q2: NIPPON SHOKUBAI invested in R&D for a novel biodegradable PVP.
- (Add further developments with year and month as they become available)
Strategic Outlook for PVP in Cosmetic Market
The future of the PVP in cosmetic market looks promising, driven by sustained growth in the cosmetic industry, increasing consumer demand for high-performance and sustainable products, and ongoing innovations in PVP technology. The market is poised for expansion, with significant opportunities in emerging markets and in the development of new applications for PVP. Strategic partnerships and investments in R&D will play a crucial role in shaping the competitive landscape and driving future market growth.
PVP in Cosmetic Segmentation
-
1. Application
- 1.1. Skincare
- 1.2. Hair Care
- 1.3. Make-up
- 1.4. Perfumes
- 1.5. Other
-
2. Types
- 2.1. PVP K-15
- 2.2. PVP K-30
- 2.3. PVP K-60
- 2.4. PVP K-90
- 2.5. Other
PVP in Cosmetic Segmentation By Geography
-
1. North America
- 1.1. United States
- 1.2. Canada
- 1.3. Mexico
-
2. South America
- 2.1. Brazil
- 2.2. Argentina
- 2.3. Rest of South America
-
3. Europe
- 3.1. United Kingdom
- 3.2. Germany
- 3.3. France
- 3.4. Italy
- 3.5. Spain
- 3.6. Russia
- 3.7. Benelux
- 3.8. Nordics
- 3.9. Rest of Europe
-
4. Middle East & Africa
- 4.1. Turkey
- 4.2. Israel
- 4.3. GCC
- 4.4. North Africa
- 4.5. South Africa
- 4.6. Rest of Middle East & Africa
-
5. Asia Pacific
- 5.1. China
- 5.2. India
- 5.3. Japan
- 5.4. South Korea
- 5.5. ASEAN
- 5.6. Oceania
- 5.7. Rest of Asia Pacific

PVP in Cosmetic Regional Market Share
Geographic Coverage of PVP in Cosmetic
PVP in Cosmetic REPORT HIGHLIGHTS
| Aspects | Details |
|---|---|
| Study Period | 2020-2034 |
| Base Year | 2025 |
| Estimated Year | 2026 |
| Forecast Period | 2026-2034 |
| Historical Period | 2020-2025 |
| Growth Rate | CAGR of XX% from 2020-2034 |
| Segmentation |
|
Table of Contents
- 1. Introduction
- 1.1. Research Scope
- 1.2. Market Segmentation
- 1.3. Research Objective
- 1.4. Definitions and Assumptions
- 2. Executive Summary
- 2.1. Market Snapshot
- 3. Market Dynamics
- 3.1. Market Drivers
- 3.2. Market Restrains
- 3.3. Market Trends
- 3.4. Market Opportunities
- 4. Market Factor Analysis
- 4.1. Porters Five Forces
- 4.1.1. Bargaining Power of Suppliers
- 4.1.2. Bargaining Power of Buyers
- 4.1.3. Threat of New Entrants
- 4.1.4. Threat of Substitutes
- 4.1.5. Competitive Rivalry
- 4.2. PESTEL analysis
- 4.3. BCG Analysis
- 4.3.1. Stars (High Growth, High Market Share)
- 4.3.2. Cash Cows (Low Growth, High Market Share)
- 4.3.3. Question Mark (High Growth, Low Market Share)
- 4.3.4. Dogs (Low Growth, Low Market Share)
- 4.4. Ansoff Matrix Analysis
- 4.5. Supply Chain Analysis
- 4.6. Regulatory Landscape
- 4.7. Current Market Potential and Opportunity Assessment (TAM–SAM–SOM Framework)
- 4.8. RAX Analyst Note
- 4.1. Porters Five Forces
- 5. Market Analysis, Insights and Forecast 2021-2033
- 5.1. Market Analysis, Insights and Forecast - by Application
- 5.1.1. Skincare
- 5.1.2. Hair Care
- 5.1.3. Make-up
- 5.1.4. Perfumes
- 5.1.5. Other
- 5.2. Market Analysis, Insights and Forecast - by Types
- 5.2.1. PVP K-15
- 5.2.2. PVP K-30
- 5.2.3. PVP K-60
- 5.2.4. PVP K-90
- 5.2.5. Other
- 5.3. Market Analysis, Insights and Forecast - by Region
- 5.3.1. North America
- 5.3.2. South America
- 5.3.3. Europe
- 5.3.4. Middle East & Africa
- 5.3.5. Asia Pacific
- 5.1. Market Analysis, Insights and Forecast - by Application
- 6. Global PVP in Cosmetic Analysis, Insights and Forecast, 2021-2033
- 6.1. Market Analysis, Insights and Forecast - by Application
- 6.1.1. Skincare
- 6.1.2. Hair Care
- 6.1.3. Make-up
- 6.1.4. Perfumes
- 6.1.5. Other
- 6.2. Market Analysis, Insights and Forecast - by Types
- 6.2.1. PVP K-15
- 6.2.2. PVP K-30
- 6.2.3. PVP K-60
- 6.2.4. PVP K-90
- 6.2.5. Other
- 6.1. Market Analysis, Insights and Forecast - by Application
- 7. North America PVP in Cosmetic Analysis, Insights and Forecast, 2020-2032
- 7.1. Market Analysis, Insights and Forecast - by Application
- 7.1.1. Skincare
- 7.1.2. Hair Care
- 7.1.3. Make-up
- 7.1.4. Perfumes
- 7.1.5. Other
- 7.2. Market Analysis, Insights and Forecast - by Types
- 7.2.1. PVP K-15
- 7.2.2. PVP K-30
- 7.2.3. PVP K-60
- 7.2.4. PVP K-90
- 7.2.5. Other
- 7.1. Market Analysis, Insights and Forecast - by Application
- 8. South America PVP in Cosmetic Analysis, Insights and Forecast, 2020-2032
- 8.1. Market Analysis, Insights and Forecast - by Application
- 8.1.1. Skincare
- 8.1.2. Hair Care
- 8.1.3. Make-up
- 8.1.4. Perfumes
- 8.1.5. Other
- 8.2. Market Analysis, Insights and Forecast - by Types
- 8.2.1. PVP K-15
- 8.2.2. PVP K-30
- 8.2.3. PVP K-60
- 8.2.4. PVP K-90
- 8.2.5. Other
- 8.1. Market Analysis, Insights and Forecast - by Application
- 9. Europe PVP in Cosmetic Analysis, Insights and Forecast, 2020-2032
- 9.1. Market Analysis, Insights and Forecast - by Application
- 9.1.1. Skincare
- 9.1.2. Hair Care
- 9.1.3. Make-up
- 9.1.4. Perfumes
- 9.1.5. Other
- 9.2. Market Analysis, Insights and Forecast - by Types
- 9.2.1. PVP K-15
- 9.2.2. PVP K-30
- 9.2.3. PVP K-60
- 9.2.4. PVP K-90
- 9.2.5. Other
- 9.1. Market Analysis, Insights and Forecast - by Application
- 10. Middle East & Africa PVP in Cosmetic Analysis, Insights and Forecast, 2020-2032
- 10.1. Market Analysis, Insights and Forecast - by Application
- 10.1.1. Skincare
- 10.1.2. Hair Care
- 10.1.3. Make-up
- 10.1.4. Perfumes
- 10.1.5. Other
- 10.2. Market Analysis, Insights and Forecast - by Types
- 10.2.1. PVP K-15
- 10.2.2. PVP K-30
- 10.2.3. PVP K-60
- 10.2.4. PVP K-90
- 10.2.5. Other
- 10.1. Market Analysis, Insights and Forecast - by Application
- 11. Asia Pacific PVP in Cosmetic Analysis, Insights and Forecast, 2020-2032
- 11.1. Market Analysis, Insights and Forecast - by Application
- 11.1.1. Skincare
- 11.1.2. Hair Care
- 11.1.3. Make-up
- 11.1.4. Perfumes
- 11.1.5. Other
- 11.2. Market Analysis, Insights and Forecast - by Types
- 11.2.1. PVP K-15
- 11.2.2. PVP K-30
- 11.2.3. PVP K-60
- 11.2.4. PVP K-90
- 11.2.5. Other
- 11.1. Market Analysis, Insights and Forecast - by Application
- 12. Competitive Analysis
- 12.1. Company Profiles
- 12.1.1 BASF
- 12.1.1.1. Company Overview
- 12.1.1.2. Products
- 12.1.1.3. Company Financials
- 12.1.1.4. SWOT Analysis
- 12.1.2 Ashland
- 12.1.2.1. Company Overview
- 12.1.2.2. Products
- 12.1.2.3. Company Financials
- 12.1.2.4. SWOT Analysis
- 12.1.3 NIPPON SHOKUBAI
- 12.1.3.1. Company Overview
- 12.1.3.2. Products
- 12.1.3.3. Company Financials
- 12.1.3.4. SWOT Analysis
- 12.1.4 Boai NKY Pharmaceuticals
- 12.1.4.1. Company Overview
- 12.1.4.2. Products
- 12.1.4.3. Company Financials
- 12.1.4.4. SWOT Analysis
- 12.1.5 Jianhua Group
- 12.1.5.1. Company Overview
- 12.1.5.2. Products
- 12.1.5.3. Company Financials
- 12.1.5.4. SWOT Analysis
- 12.1.6 Jiaozuo Zhongwei
- 12.1.6.1. Company Overview
- 12.1.6.2. Products
- 12.1.6.3. Company Financials
- 12.1.6.4. SWOT Analysis
- 12.1.7 Special Products Pharmaceutical
- 12.1.7.1. Company Overview
- 12.1.7.2. Products
- 12.1.7.3. Company Financials
- 12.1.7.4. SWOT Analysis
- 12.1.8 Huangshan Bonsun Pharmaceuticals
- 12.1.8.1. Company Overview
- 12.1.8.2. Products
- 12.1.8.3. Company Financials
- 12.1.8.4. SWOT Analysis
- 12.1.9 Meida Fine Chemical
- 12.1.9.1. Company Overview
- 12.1.9.2. Products
- 12.1.9.3. Company Financials
- 12.1.9.4. SWOT Analysis
- 12.1.10 Sichuan Tianhua
- 12.1.10.1. Company Overview
- 12.1.10.2. Products
- 12.1.10.3. Company Financials
- 12.1.10.4. SWOT Analysis
- 12.1.1 BASF
- 12.2. Market Entropy
- 12.2.1 Company's Key Areas Served
- 12.2.2 Recent Developments
- 12.3. Company Market Share Analysis 2025
- 12.3.1 Top 5 Companies Market Share Analysis
- 12.3.2 Top 3 Companies Market Share Analysis
- 12.4. List of Potential Customers
- 13. Research Methodology
List of Figures
- Figure 1: Global PVP in Cosmetic Revenue Breakdown (million, %) by Region 2025 & 2033
- Figure 2: Global PVP in Cosmetic Volume Breakdown (K, %) by Region 2025 & 2033
- Figure 3: North America PVP in Cosmetic Revenue (million), by Application 2025 & 2033
- Figure 4: North America PVP in Cosmetic Volume (K), by Application 2025 & 2033
- Figure 5: North America PVP in Cosmetic Revenue Share (%), by Application 2025 & 2033
- Figure 6: North America PVP in Cosmetic Volume Share (%), by Application 2025 & 2033
- Figure 7: North America PVP in Cosmetic Revenue (million), by Types 2025 & 2033
- Figure 8: North America PVP in Cosmetic Volume (K), by Types 2025 & 2033
- Figure 9: North America PVP in Cosmetic Revenue Share (%), by Types 2025 & 2033
- Figure 10: North America PVP in Cosmetic Volume Share (%), by Types 2025 & 2033
- Figure 11: North America PVP in Cosmetic Revenue (million), by Country 2025 & 2033
- Figure 12: North America PVP in Cosmetic Volume (K), by Country 2025 & 2033
- Figure 13: North America PVP in Cosmetic Revenue Share (%), by Country 2025 & 2033
- Figure 14: North America PVP in Cosmetic Volume Share (%), by Country 2025 & 2033
- Figure 15: South America PVP in Cosmetic Revenue (million), by Application 2025 & 2033
- Figure 16: South America PVP in Cosmetic Volume (K), by Application 2025 & 2033
- Figure 17: South America PVP in Cosmetic Revenue Share (%), by Application 2025 & 2033
- Figure 18: South America PVP in Cosmetic Volume Share (%), by Application 2025 & 2033
- Figure 19: South America PVP in Cosmetic Revenue (million), by Types 2025 & 2033
- Figure 20: South America PVP in Cosmetic Volume (K), by Types 2025 & 2033
- Figure 21: South America PVP in Cosmetic Revenue Share (%), by Types 2025 & 2033
- Figure 22: South America PVP in Cosmetic Volume Share (%), by Types 2025 & 2033
- Figure 23: South America PVP in Cosmetic Revenue (million), by Country 2025 & 2033
- Figure 24: South America PVP in Cosmetic Volume (K), by Country 2025 & 2033
- Figure 25: South America PVP in Cosmetic Revenue Share (%), by Country 2025 & 2033
- Figure 26: South America PVP in Cosmetic Volume Share (%), by Country 2025 & 2033
- Figure 27: Europe PVP in Cosmetic Revenue (million), by Application 2025 & 2033
- Figure 28: Europe PVP in Cosmetic Volume (K), by Application 2025 & 2033
- Figure 29: Europe PVP in Cosmetic Revenue Share (%), by Application 2025 & 2033
- Figure 30: Europe PVP in Cosmetic Volume Share (%), by Application 2025 & 2033
- Figure 31: Europe PVP in Cosmetic Revenue (million), by Types 2025 & 2033
- Figure 32: Europe PVP in Cosmetic Volume (K), by Types 2025 & 2033
- Figure 33: Europe PVP in Cosmetic Revenue Share (%), by Types 2025 & 2033
- Figure 34: Europe PVP in Cosmetic Volume Share (%), by Types 2025 & 2033
- Figure 35: Europe PVP in Cosmetic Revenue (million), by Country 2025 & 2033
- Figure 36: Europe PVP in Cosmetic Volume (K), by Country 2025 & 2033
- Figure 37: Europe PVP in Cosmetic Revenue Share (%), by Country 2025 & 2033
- Figure 38: Europe PVP in Cosmetic Volume Share (%), by Country 2025 & 2033
- Figure 39: Middle East & Africa PVP in Cosmetic Revenue (million), by Application 2025 & 2033
- Figure 40: Middle East & Africa PVP in Cosmetic Volume (K), by Application 2025 & 2033
- Figure 41: Middle East & Africa PVP in Cosmetic Revenue Share (%), by Application 2025 & 2033
- Figure 42: Middle East & Africa PVP in Cosmetic Volume Share (%), by Application 2025 & 2033
- Figure 43: Middle East & Africa PVP in Cosmetic Revenue (million), by Types 2025 & 2033
- Figure 44: Middle East & Africa PVP in Cosmetic Volume (K), by Types 2025 & 2033
- Figure 45: Middle East & Africa PVP in Cosmetic Revenue Share (%), by Types 2025 & 2033
- Figure 46: Middle East & Africa PVP in Cosmetic Volume Share (%), by Types 2025 & 2033
- Figure 47: Middle East & Africa PVP in Cosmetic Revenue (million), by Country 2025 & 2033
- Figure 48: Middle East & Africa PVP in Cosmetic Volume (K), by Country 2025 & 2033
- Figure 49: Middle East & Africa PVP in Cosmetic Revenue Share (%), by Country 2025 & 2033
- Figure 50: Middle East & Africa PVP in Cosmetic Volume Share (%), by Country 2025 & 2033
- Figure 51: Asia Pacific PVP in Cosmetic Revenue (million), by Application 2025 & 2033
- Figure 52: Asia Pacific PVP in Cosmetic Volume (K), by Application 2025 & 2033
- Figure 53: Asia Pacific PVP in Cosmetic Revenue Share (%), by Application 2025 & 2033
- Figure 54: Asia Pacific PVP in Cosmetic Volume Share (%), by Application 2025 & 2033
- Figure 55: Asia Pacific PVP in Cosmetic Revenue (million), by Types 2025 & 2033
- Figure 56: Asia Pacific PVP in Cosmetic Volume (K), by Types 2025 & 2033
- Figure 57: Asia Pacific PVP in Cosmetic Revenue Share (%), by Types 2025 & 2033
- Figure 58: Asia Pacific PVP in Cosmetic Volume Share (%), by Types 2025 & 2033
- Figure 59: Asia Pacific PVP in Cosmetic Revenue (million), by Country 2025 & 2033
- Figure 60: Asia Pacific PVP in Cosmetic Volume (K), by Country 2025 & 2033
- Figure 61: Asia Pacific PVP in Cosmetic Revenue Share (%), by Country 2025 & 2033
- Figure 62: Asia Pacific PVP in Cosmetic Volume Share (%), by Country 2025 & 2033
List of Tables
- Table 1: Global PVP in Cosmetic Revenue million Forecast, by Application 2020 & 2033
- Table 2: Global PVP in Cosmetic Volume K Forecast, by Application 2020 & 2033
- Table 3: Global PVP in Cosmetic Revenue million Forecast, by Types 2020 & 2033
- Table 4: Global PVP in Cosmetic Volume K Forecast, by Types 2020 & 2033
- Table 5: Global PVP in Cosmetic Revenue million Forecast, by Region 2020 & 2033
- Table 6: Global PVP in Cosmetic Volume K Forecast, by Region 2020 & 2033
- Table 7: Global PVP in Cosmetic Revenue million Forecast, by Application 2020 & 2033
- Table 8: Global PVP in Cosmetic Volume K Forecast, by Application 2020 & 2033
- Table 9: Global PVP in Cosmetic Revenue million Forecast, by Types 2020 & 2033
- Table 10: Global PVP in Cosmetic Volume K Forecast, by Types 2020 & 2033
- Table 11: Global PVP in Cosmetic Revenue million Forecast, by Country 2020 & 2033
- Table 12: Global PVP in Cosmetic Volume K Forecast, by Country 2020 & 2033
- Table 13: United States PVP in Cosmetic Revenue (million) Forecast, by Application 2020 & 2033
- Table 14: United States PVP in Cosmetic Volume (K) Forecast, by Application 2020 & 2033
- Table 15: Canada PVP in Cosmetic Revenue (million) Forecast, by Application 2020 & 2033
- Table 16: Canada PVP in Cosmetic Volume (K) Forecast, by Application 2020 & 2033
- Table 17: Mexico PVP in Cosmetic Revenue (million) Forecast, by Application 2020 & 2033
- Table 18: Mexico PVP in Cosmetic Volume (K) Forecast, by Application 2020 & 2033
- Table 19: Global PVP in Cosmetic Revenue million Forecast, by Application 2020 & 2033
- Table 20: Global PVP in Cosmetic Volume K Forecast, by Application 2020 & 2033
- Table 21: Global PVP in Cosmetic Revenue million Forecast, by Types 2020 & 2033
- Table 22: Global PVP in Cosmetic Volume K Forecast, by Types 2020 & 2033
- Table 23: Global PVP in Cosmetic Revenue million Forecast, by Country 2020 & 2033
- Table 24: Global PVP in Cosmetic Volume K Forecast, by Country 2020 & 2033
- Table 25: Brazil PVP in Cosmetic Revenue (million) Forecast, by Application 2020 & 2033
- Table 26: Brazil PVP in Cosmetic Volume (K) Forecast, by Application 2020 & 2033
- Table 27: Argentina PVP in Cosmetic Revenue (million) Forecast, by Application 2020 & 2033
- Table 28: Argentina PVP in Cosmetic Volume (K) Forecast, by Application 2020 & 2033
- Table 29: Rest of South America PVP in Cosmetic Revenue (million) Forecast, by Application 2020 & 2033
- Table 30: Rest of South America PVP in Cosmetic Volume (K) Forecast, by Application 2020 & 2033
- Table 31: Global PVP in Cosmetic Revenue million Forecast, by Application 2020 & 2033
- Table 32: Global PVP in Cosmetic Volume K Forecast, by Application 2020 & 2033
- Table 33: Global PVP in Cosmetic Revenue million Forecast, by Types 2020 & 2033
- Table 34: Global PVP in Cosmetic Volume K Forecast, by Types 2020 & 2033
- Table 35: Global PVP in Cosmetic Revenue million Forecast, by Country 2020 & 2033
- Table 36: Global PVP in Cosmetic Volume K Forecast, by Country 2020 & 2033
- Table 37: United Kingdom PVP in Cosmetic Revenue (million) Forecast, by Application 2020 & 2033
- Table 38: United Kingdom PVP in Cosmetic Volume (K) Forecast, by Application 2020 & 2033
- Table 39: Germany PVP in Cosmetic Revenue (million) Forecast, by Application 2020 & 2033
- Table 40: Germany PVP in Cosmetic Volume (K) Forecast, by Application 2020 & 2033
- Table 41: France PVP in Cosmetic Revenue (million) Forecast, by Application 2020 & 2033
- Table 42: France PVP in Cosmetic Volume (K) Forecast, by Application 2020 & 2033
- Table 43: Italy PVP in Cosmetic Revenue (million) Forecast, by Application 2020 & 2033
- Table 44: Italy PVP in Cosmetic Volume (K) Forecast, by Application 2020 & 2033
- Table 45: Spain PVP in Cosmetic Revenue (million) Forecast, by Application 2020 & 2033
- Table 46: Spain PVP in Cosmetic Volume (K) Forecast, by Application 2020 & 2033
- Table 47: Russia PVP in Cosmetic Revenue (million) Forecast, by Application 2020 & 2033
- Table 48: Russia PVP in Cosmetic Volume (K) Forecast, by Application 2020 & 2033
- Table 49: Benelux PVP in Cosmetic Revenue (million) Forecast, by Application 2020 & 2033
- Table 50: Benelux PVP in Cosmetic Volume (K) Forecast, by Application 2020 & 2033
- Table 51: Nordics PVP in Cosmetic Revenue (million) Forecast, by Application 2020 & 2033
- Table 52: Nordics PVP in Cosmetic Volume (K) Forecast, by Application 2020 & 2033
- Table 53: Rest of Europe PVP in Cosmetic Revenue (million) Forecast, by Application 2020 & 2033
- Table 54: Rest of Europe PVP in Cosmetic Volume (K) Forecast, by Application 2020 & 2033
- Table 55: Global PVP in Cosmetic Revenue million Forecast, by Application 2020 & 2033
- Table 56: Global PVP in Cosmetic Volume K Forecast, by Application 2020 & 2033
- Table 57: Global PVP in Cosmetic Revenue million Forecast, by Types 2020 & 2033
- Table 58: Global PVP in Cosmetic Volume K Forecast, by Types 2020 & 2033
- Table 59: Global PVP in Cosmetic Revenue million Forecast, by Country 2020 & 2033
- Table 60: Global PVP in Cosmetic Volume K Forecast, by Country 2020 & 2033
- Table 61: Turkey PVP in Cosmetic Revenue (million) Forecast, by Application 2020 & 2033
- Table 62: Turkey PVP in Cosmetic Volume (K) Forecast, by Application 2020 & 2033
- Table 63: Israel PVP in Cosmetic Revenue (million) Forecast, by Application 2020 & 2033
- Table 64: Israel PVP in Cosmetic Volume (K) Forecast, by Application 2020 & 2033
- Table 65: GCC PVP in Cosmetic Revenue (million) Forecast, by Application 2020 & 2033
- Table 66: GCC PVP in Cosmetic Volume (K) Forecast, by Application 2020 & 2033
- Table 67: North Africa PVP in Cosmetic Revenue (million) Forecast, by Application 2020 & 2033
- Table 68: North Africa PVP in Cosmetic Volume (K) Forecast, by Application 2020 & 2033
- Table 69: South Africa PVP in Cosmetic Revenue (million) Forecast, by Application 2020 & 2033
- Table 70: South Africa PVP in Cosmetic Volume (K) Forecast, by Application 2020 & 2033
- Table 71: Rest of Middle East & Africa PVP in Cosmetic Revenue (million) Forecast, by Application 2020 & 2033
- Table 72: Rest of Middle East & Africa PVP in Cosmetic Volume (K) Forecast, by Application 2020 & 2033
- Table 73: Global PVP in Cosmetic Revenue million Forecast, by Application 2020 & 2033
- Table 74: Global PVP in Cosmetic Volume K Forecast, by Application 2020 & 2033
- Table 75: Global PVP in Cosmetic Revenue million Forecast, by Types 2020 & 2033
- Table 76: Global PVP in Cosmetic Volume K Forecast, by Types 2020 & 2033
- Table 77: Global PVP in Cosmetic Revenue million Forecast, by Country 2020 & 2033
- Table 78: Global PVP in Cosmetic Volume K Forecast, by Country 2020 & 2033
- Table 79: China PVP in Cosmetic Revenue (million) Forecast, by Application 2020 & 2033
- Table 80: China PVP in Cosmetic Volume (K) Forecast, by Application 2020 & 2033
- Table 81: India PVP in Cosmetic Revenue (million) Forecast, by Application 2020 & 2033
- Table 82: India PVP in Cosmetic Volume (K) Forecast, by Application 2020 & 2033
- Table 83: Japan PVP in Cosmetic Revenue (million) Forecast, by Application 2020 & 2033
- Table 84: Japan PVP in Cosmetic Volume (K) Forecast, by Application 2020 & 2033
- Table 85: South Korea PVP in Cosmetic Revenue (million) Forecast, by Application 2020 & 2033
- Table 86: South Korea PVP in Cosmetic Volume (K) Forecast, by Application 2020 & 2033
- Table 87: ASEAN PVP in Cosmetic Revenue (million) Forecast, by Application 2020 & 2033
- Table 88: ASEAN PVP in Cosmetic Volume (K) Forecast, by Application 2020 & 2033
- Table 89: Oceania PVP in Cosmetic Revenue (million) Forecast, by Application 2020 & 2033
- Table 90: Oceania PVP in Cosmetic Volume (K) Forecast, by Application 2020 & 2033
- Table 91: Rest of Asia Pacific PVP in Cosmetic Revenue (million) Forecast, by Application 2020 & 2033
- Table 92: Rest of Asia Pacific PVP in Cosmetic Volume (K) Forecast, by Application 2020 & 2033
Frequently Asked Questions
1. What is the projected Compound Annual Growth Rate (CAGR) of the PVP in Cosmetic?
The projected CAGR is approximately XX%.
2. Which companies are prominent players in the PVP in Cosmetic?
Key companies in the market include BASF, Ashland, NIPPON SHOKUBAI, Boai NKY Pharmaceuticals, Jianhua Group, Jiaozuo Zhongwei, Special Products Pharmaceutical, Huangshan Bonsun Pharmaceuticals, Meida Fine Chemical, Sichuan Tianhua.
3. What are the main segments of the PVP in Cosmetic?
The market segments include Application, Types.
4. Can you provide details about the market size?
The market size is estimated to be USD XXX million as of 2022.
5. What are some drivers contributing to market growth?
N/A
6. What are the notable trends driving market growth?
N/A
7. Are there any restraints impacting market growth?
N/A
8. Can you provide examples of recent developments in the market?
N/A
9. What pricing options are available for accessing the report?
Pricing options include single-user, multi-user, and enterprise licenses priced at USD 3350.00, USD 5025.00, and USD 6700.00 respectively.
10. Is the market size provided in terms of value or volume?
The market size is provided in terms of value, measured in million and volume, measured in K.
11. Are there any specific market keywords associated with the report?
Yes, the market keyword associated with the report is "PVP in Cosmetic," which aids in identifying and referencing the specific market segment covered.
12. How do I determine which pricing option suits my needs best?
The pricing options vary based on user requirements and access needs. Individual users may opt for single-user licenses, while businesses requiring broader access may choose multi-user or enterprise licenses for cost-effective access to the report.
13. Are there any additional resources or data provided in the PVP in Cosmetic report?
While the report offers comprehensive insights, it's advisable to review the specific contents or supplementary materials provided to ascertain if additional resources or data are available.
14. How can I stay updated on further developments or reports in the PVP in Cosmetic?
To stay informed about further developments, trends, and reports in the PVP in Cosmetic, consider subscribing to industry newsletters, following relevant companies and organizations, or regularly checking reputable industry news sources and publications.
Methodology
Step 1 - Identification of Relevant Samples Size from Population Database


Step 2 - Approaches for Defining Global Market Size (Value, Volume* & Price*)

Note*: In applicable scenarios
Step 3 - Data Sources
Primary Research
- Web Analytics
- Survey Reports
- Research Institute
- Latest Research Reports
- Opinion Leaders
Secondary Research
- Annual Reports
- White Paper
- Latest Press Release
- Industry Association
- Paid Database
- Investor Presentations

Step 4 - Data Triangulation
Involves using different sources of information in order to increase the validity of a study
These sources are likely to be stakeholders in a program - participants, other researchers, program staff, other community members, and so on.
Then we put all data in single framework & apply various statistical tools to find out the dynamic on the market.
During the analysis stage, feedback from the stakeholder groups would be compared to determine areas of agreement as well as areas of divergence