


Key Insights
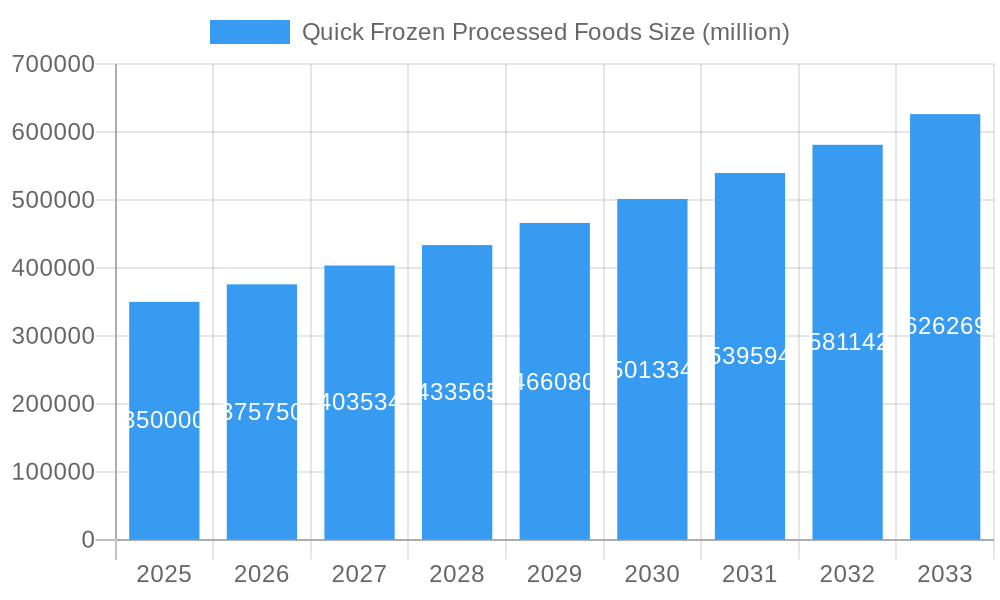
The Quick Frozen Processed Foods market is poised for significant expansion, projected to reach an estimated USD 350,000 million by 2025 and is expected to grow at a robust Compound Annual Growth Rate (CAGR) of 7.5% through 2033. This growth is primarily propelled by evolving consumer lifestyles, a growing demand for convenience, and increasing disposable incomes across key regions. The convenience factor offered by pre-prepared frozen meals, which significantly reduce cooking time and effort, resonates strongly with busy urban populations and individuals seeking quick, yet nutritious meal solutions. Furthermore, advancements in freezing technologies have improved the quality and taste of frozen foods, diminishing previous consumer perceptions and broadening their appeal. The market's expansion is also supported by the growing awareness of food safety and longer shelf life associated with properly frozen products, providing consumers with a reliable option for stocking their pantries.
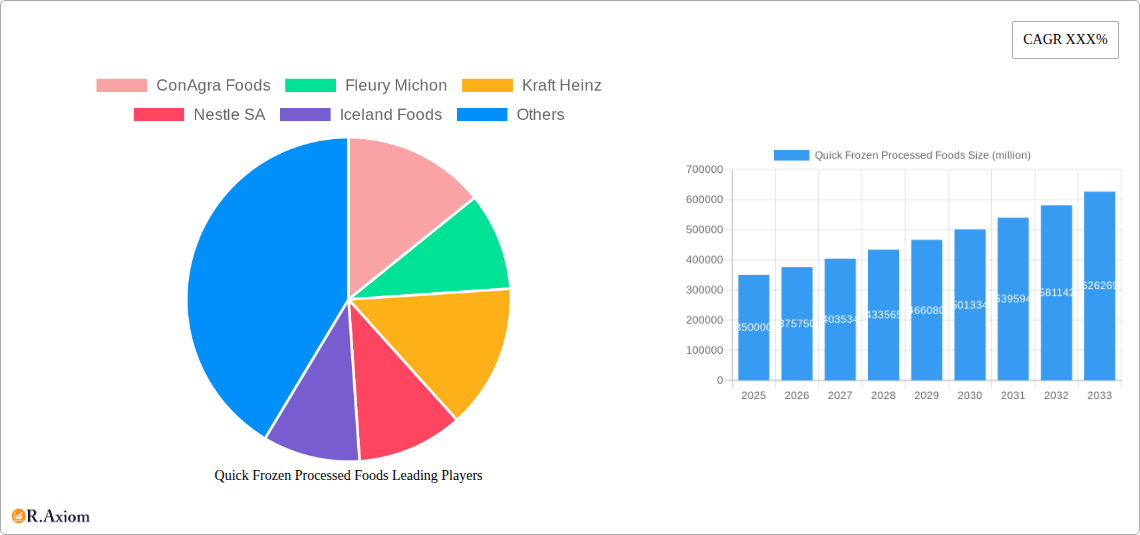
Quick Frozen Processed Foods Market Size (In Billion)

The market segmentation reveals a dynamic landscape driven by diverse applications and product types. Supermarkets and specialist retailers are expected to lead in distribution channels, catering to a broad consumer base seeking a variety of options. Within product types, Fruits and Vegetables, and Meat Products are anticipated to dominate, reflecting their staple nature in daily diets. However, the "Other" segment, encompassing a wide array of ready-to-eat meals, snacks, and desserts, is likely to witness accelerated growth due to innovation and the rising popularity of convenient, on-the-go food solutions. Key market players like ConAgra Foods, Kraft Heinz, and Nestle SA are actively investing in product innovation, expanding their distribution networks, and leveraging marketing strategies to capture a larger market share. Geographically, the Asia Pacific region, driven by burgeoning economies like China and India, is emerging as a critical growth engine, alongside the established markets of North America and Europe. Addressing potential restraints such as fluctuating raw material costs and the need for efficient cold chain logistics will be crucial for sustained market development.
Quick Frozen Processed Foods Company Market Share
This in-depth report provides an exhaustive analysis of the global Quick Frozen Processed Foods market, offering critical insights into its growth trajectory, competitive landscape, and emerging trends. Spanning the Study Period: 2019–2033, with a Base Year: 2025 and Forecast Period: 2025–2033, this research meticulously examines the Historical Period: 2019–2024. Gain a competitive edge with actionable intelligence on market concentration, innovation drivers, industry developments, dominant markets and segments, product innovations, and strategic outlook. This report is an indispensable resource for industry stakeholders seeking to navigate the dynamic quick frozen processed foods industry, from manufacturers and suppliers to retailers and investors.
Quick Frozen Processed Foods Market Concentration & Innovation
The Quick Frozen Processed Foods market exhibits a market share concentration of approximately 70% among the top five players, including Nestle SA, Kraft Heinz, and ConAgra Foods. Innovation is a key differentiator, driven by advancements in freezing technologies, sustainable packaging solutions, and the demand for healthier, plant-based, and ready-to-eat options. Regulatory frameworks, such as food safety standards and labeling requirements, play a significant role in shaping product development and market entry. Product substitutes, including fresh and chilled alternatives, present a constant competitive challenge, necessitating continuous product innovation and value proposition enhancement. End-user trends are heavily influenced by convenience, health consciousness, and budget-friendly options, leading to an increasing demand for quick frozen processed foods. M&A activities are on the rise, with recent deals valued in the hundreds of millions, aimed at consolidating market positions and acquiring innovative technologies. Notable M&A deal values in the historical period reached an estimated $2,500 million.
Quick Frozen Processed Foods Industry Trends & Insights
The Quick Frozen Processed Foods industry is experiencing robust growth, propelled by several interconnected trends. The Compound Annual Growth Rate (CAGR) is projected to be around 6.5% from 2025 to 2033, indicating a sustained expansion. Rising disposable incomes in emerging economies, coupled with an increasing urbanization rate, are significantly boosting market penetration across diverse demographics. Consumers are increasingly seeking convenient meal solutions that align with their busy lifestyles, making quick frozen options an attractive choice. Health and wellness trends are also reshaping the market, with a growing demand for quick frozen processed foods that are perceived as healthier, featuring reduced sodium, lower fat content, and the incorporation of natural ingredients. Technological disruptions in freezing techniques, such as Individual Quick Freezing (IQF) and cryogenic freezing, are enhancing product quality, preserving nutritional value, and extending shelf life, thereby driving consumer acceptance. Furthermore, the expansion of online grocery platforms and direct-to-consumer (DTC) models is creating new avenues for market reach and accessibility, further fueling growth. The competitive dynamics are characterized by product differentiation, strategic partnerships, and aggressive marketing campaigns aimed at capturing market share.
Dominant Markets & Segments in Quick Frozen Processed Foods
The Supermarkets segment is the most dominant application for Quick Frozen Processed Foods, accounting for an estimated 55% of the global market share. This dominance is attributed to the extensive reach and customer traffic of supermarkets, providing a prime channel for product visibility and sales. Within the Type segmentation, Meat Products currently hold the largest market share, driven by consistent consumer demand for convenience and a wide variety of frozen meat options. However, the Fruits and Vegetables segment is exhibiting significant growth, fueled by increasing health consciousness and the demand for convenient access to produce.
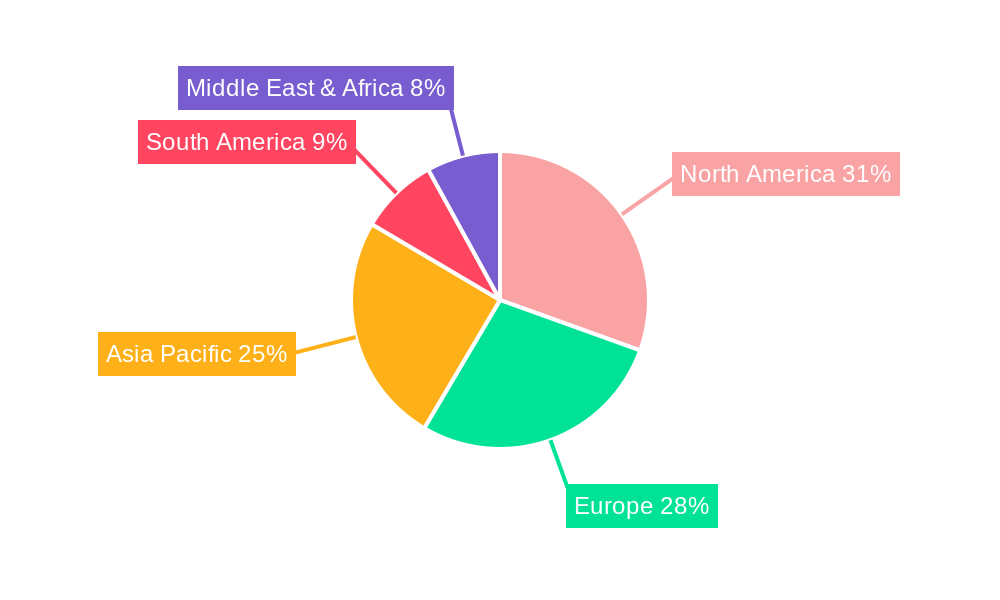
- Regional Dominance: North America and Europe are the leading regions, with a combined market share of approximately 60%. This is due to established consumer preferences for frozen foods, robust retail infrastructure, and higher disposable incomes.
- Application Dominance - Supermarkets: Supermarkets offer vast shelf space, promotional opportunities, and a broad customer base, making them the primary distribution channel. Economic policies supporting food retail and advanced logistics infrastructure further solidify their leading position.
- Type Dominance - Meat Products: The widespread availability and established consumer habits surrounding frozen meat products contribute to their market leadership. The development of innovative frozen meat preparations further enhances their appeal.
- Growth Drivers in Application Segments:
- Specialist Retailers: Growing demand for niche and premium quick frozen products.
- Convenience Stores: Increasing need for quick and easy meal solutions for on-the-go consumers.
- Independent Retailers: Catering to specific local market demands and offering personalized selections.
- Growth Drivers in Type Segments:
- Fruits and Vegetables: Rising health awareness, availability of ready-to-cook options, and longer shelf life.
- Fish and Seafood: Growing popularity of frozen seafood due to convenience and sustainability concerns.
- Other (e.g., Ready Meals, Desserts): Increased demand for convenience and variety in meal options.
Quick Frozen Processed Foods Product Developments
Product innovation in Quick Frozen Processed Foods is centered on enhancing nutritional profiles, convenience, and taste. Key developments include the introduction of plant-based meat alternatives, gluten-free options, and low-sodium formulations to cater to evolving consumer demands. Advanced freezing technologies are being employed to preserve the freshness and texture of fruits, vegetables, and seafood, offering a competitive advantage. The rise of ready-to-eat and heat-and-serve meals, offering diverse culinary experiences, is a significant trend. These product developments are strategically designed to meet specific market needs, capitalize on emerging dietary trends, and secure a stronger market position through superior quality and convenience.
Report Scope & Segmentation Analysis
This report comprehensively segments the Quick Frozen Processed Foods market across various dimensions.
- Application Segmentation: The market is analyzed by Supermarkets, Specialist Retailers, Convenience Stores, and Independent Retailers. Supermarkets are projected to maintain their dominant position with an estimated market share of $25,000 million by 2033. Specialist retailers are expected to witness a CAGR of 7.2% due to the demand for premium and niche products.
- Type Segmentation: The analysis includes Fruits and Vegetables, Meat Products, Fish and Seafood, and Other categories. The Fruits and Vegetables segment is anticipated to grow at a CAGR of 7.5%, driven by health consciousness. Meat Products are expected to reach approximately $30,000 million by 2033. Fish and Seafood will see steady growth, while the 'Other' segment, encompassing ready meals and desserts, will continue to expand due to convenience.
Key Drivers of Quick Frozen Processed Foods Growth
The growth of the Quick Frozen Processed Foods market is propelled by several key factors. Technological advancements in freezing and packaging are enhancing product quality and shelf life, appealing to consumers. The increasing global population and urbanization drive demand for convenient and accessible food solutions. Rising disposable incomes, particularly in emerging economies, enable consumers to opt for value-added frozen products. Shifting consumer preferences towards healthier options, such as plant-based and reduced-sodium foods, are also significant drivers. Furthermore, the expansion of modern retail formats and e-commerce platforms facilitates wider market reach and accessibility.
Challenges in the Quick Frozen Processed Foods Sector
Despite its growth, the Quick Frozen Processed Foods sector faces several challenges. Fluctuations in raw material prices and supply chain disruptions can impact production costs and availability. Stringent regulatory frameworks concerning food safety and labeling require continuous compliance and can pose barriers to entry for smaller players. Intense competition from fresh and chilled food alternatives necessitates constant innovation and aggressive marketing strategies. Consumer perception regarding the nutritional value and processing of frozen foods can also be a challenge, requiring effective communication of product benefits. The energy-intensive nature of cold chain logistics contributes to operational costs.
Emerging Opportunities in Quick Frozen Processed Foods
The Quick Frozen Processed Foods market is ripe with emerging opportunities. The growing demand for ethnic and gourmet frozen meals presents a significant growth avenue. Expansion into untapped emerging markets with burgeoning middle classes offers substantial potential. Innovations in plant-based and alternative protein frozen products cater to evolving dietary trends and sustainability concerns. The development of smart packaging solutions that enhance product visibility and provide detailed nutritional information can also attract consumers. Furthermore, the increasing adoption of direct-to-consumer (DTC) sales models and the integration of advanced technologies like AI for demand forecasting present new avenues for growth and operational efficiency.
Leading Players in the Quick Frozen Processed Foods Market
- ConAgra Foods
- Fleury Michon
- Kraft Heinz
- Nestle SA
- Iceland Foods
- Maple Leaf Foods
- General Mills
- Schwan's Company
- Amy’s Kitchen
- McCain
- The Schwan Food Company
- Tyson Foods
Key Developments in Quick Frozen Processed Foods Industry
- 2024 Q1: Nestle SA launched a new line of plant-based frozen meals targeting health-conscious consumers.
- 2023 Q4: Kraft Heinz acquired a specialty frozen food manufacturer to expand its premium offerings.
- 2023 Q3: McCain Foods invested heavily in innovative freezing technology to enhance produce quality.
- 2023 Q2: Tyson Foods expanded its retail presence for quick frozen meat products through strategic partnerships.
- 2023 Q1: General Mills introduced a range of gluten-free frozen breakfast options.
- 2022 Q4: Iceland Foods focused on sustainable sourcing for its frozen seafood products.
Strategic Outlook for Quick Frozen Processed Foods Market
The strategic outlook for the Quick Frozen Processed Foods market remains exceptionally positive. Continued investment in product innovation, particularly in healthier and plant-based options, will be crucial for sustained growth. Expanding distribution channels, including e-commerce and DTC models, will enhance market reach. Collaborations and strategic alliances will play a vital role in consolidating market positions and accessing new technologies. Addressing consumer concerns regarding nutrition and sustainability through transparent communication and product development will be paramount. The focus on efficiency in cold chain logistics and supply chain management will drive profitability. The market is poised for significant expansion, driven by evolving consumer lifestyles and technological advancements.
Quick Frozen Processed Foods Segmentation
-
1. Application
- 1.1. Supermarkets
- 1.2. Specialist Retailers
- 1.3. Convenience Stores
- 1.4. Independent Retailers
-
2. Type
- 2.1. Fruits and Vegetables
- 2.2. Meat Products
- 2.3. Fish and Seafood
- 2.4. Other
Quick Frozen Processed Foods Segmentation By Geography
-
1. North America
- 1.1. United States
- 1.2. Canada
- 1.3. Mexico
-
2. South America
- 2.1. Brazil
- 2.2. Argentina
- 2.3. Rest of South America
-
3. Europe
- 3.1. United Kingdom
- 3.2. Germany
- 3.3. France
- 3.4. Italy
- 3.5. Spain
- 3.6. Russia
- 3.7. Benelux
- 3.8. Nordics
- 3.9. Rest of Europe
-
4. Middle East & Africa
- 4.1. Turkey
- 4.2. Israel
- 4.3. GCC
- 4.4. North Africa
- 4.5. South Africa
- 4.6. Rest of Middle East & Africa
-
5. Asia Pacific
- 5.1. China
- 5.2. India
- 5.3. Japan
- 5.4. South Korea
- 5.5. ASEAN
- 5.6. Oceania
- 5.7. Rest of Asia Pacific
Quick Frozen Processed Foods Regional Market Share
Geographic Coverage of Quick Frozen Processed Foods
Quick Frozen Processed Foods REPORT HIGHLIGHTS
| Aspects | Details |
|---|---|
| Study Period | 2020-2034 |
| Base Year | 2025 |
| Estimated Year | 2026 |
| Forecast Period | 2026-2034 |
| Historical Period | 2020-2025 |
| Growth Rate | CAGR of XXX% from 2020-2034 |
| Segmentation |
|
Table of Contents
- 1. Introduction
- 1.1. Research Scope
- 1.2. Market Segmentation
- 1.3. Research Methodology
- 1.4. Definitions and Assumptions
- 2. Executive Summary
- 2.1. Introduction
- 3. Market Dynamics
- 3.1. Introduction
- 3.2. Market Drivers
- 3.3. Market Restrains
- 3.4. Market Trends
- 4. Market Factor Analysis
- 4.1. Porters Five Forces
- 4.2. Supply/Value Chain
- 4.3. PESTEL analysis
- 4.4. Market Entropy
- 4.5. Patent/Trademark Analysis
- 5. Global Quick Frozen Processed Foods Analysis, Insights and Forecast, 2020-2032
- 5.1. Market Analysis, Insights and Forecast - by Application
- 5.1.1. Supermarkets
- 5.1.2. Specialist Retailers
- 5.1.3. Convenience Stores
- 5.1.4. Independent Retailers
- 5.2. Market Analysis, Insights and Forecast - by Type
- 5.2.1. Fruits and Vegetables
- 5.2.2. Meat Products
- 5.2.3. Fish and Seafood
- 5.2.4. Other
- 5.3. Market Analysis, Insights and Forecast - by Region
- 5.3.1. North America
- 5.3.2. South America
- 5.3.3. Europe
- 5.3.4. Middle East & Africa
- 5.3.5. Asia Pacific
- 5.1. Market Analysis, Insights and Forecast - by Application
- 6. North America Quick Frozen Processed Foods Analysis, Insights and Forecast, 2020-2032
- 6.1. Market Analysis, Insights and Forecast - by Application
- 6.1.1. Supermarkets
- 6.1.2. Specialist Retailers
- 6.1.3. Convenience Stores
- 6.1.4. Independent Retailers
- 6.2. Market Analysis, Insights and Forecast - by Type
- 6.2.1. Fruits and Vegetables
- 6.2.2. Meat Products
- 6.2.3. Fish and Seafood
- 6.2.4. Other
- 6.1. Market Analysis, Insights and Forecast - by Application
- 7. South America Quick Frozen Processed Foods Analysis, Insights and Forecast, 2020-2032
- 7.1. Market Analysis, Insights and Forecast - by Application
- 7.1.1. Supermarkets
- 7.1.2. Specialist Retailers
- 7.1.3. Convenience Stores
- 7.1.4. Independent Retailers
- 7.2. Market Analysis, Insights and Forecast - by Type
- 7.2.1. Fruits and Vegetables
- 7.2.2. Meat Products
- 7.2.3. Fish and Seafood
- 7.2.4. Other
- 7.1. Market Analysis, Insights and Forecast - by Application
- 8. Europe Quick Frozen Processed Foods Analysis, Insights and Forecast, 2020-2032
- 8.1. Market Analysis, Insights and Forecast - by Application
- 8.1.1. Supermarkets
- 8.1.2. Specialist Retailers
- 8.1.3. Convenience Stores
- 8.1.4. Independent Retailers
- 8.2. Market Analysis, Insights and Forecast - by Type
- 8.2.1. Fruits and Vegetables
- 8.2.2. Meat Products
- 8.2.3. Fish and Seafood
- 8.2.4. Other
- 8.1. Market Analysis, Insights and Forecast - by Application
- 9. Middle East & Africa Quick Frozen Processed Foods Analysis, Insights and Forecast, 2020-2032
- 9.1. Market Analysis, Insights and Forecast - by Application
- 9.1.1. Supermarkets
- 9.1.2. Specialist Retailers
- 9.1.3. Convenience Stores
- 9.1.4. Independent Retailers
- 9.2. Market Analysis, Insights and Forecast - by Type
- 9.2.1. Fruits and Vegetables
- 9.2.2. Meat Products
- 9.2.3. Fish and Seafood
- 9.2.4. Other
- 9.1. Market Analysis, Insights and Forecast - by Application
- 10. Asia Pacific Quick Frozen Processed Foods Analysis, Insights and Forecast, 2020-2032
- 10.1. Market Analysis, Insights and Forecast - by Application
- 10.1.1. Supermarkets
- 10.1.2. Specialist Retailers
- 10.1.3. Convenience Stores
- 10.1.4. Independent Retailers
- 10.2. Market Analysis, Insights and Forecast - by Type
- 10.2.1. Fruits and Vegetables
- 10.2.2. Meat Products
- 10.2.3. Fish and Seafood
- 10.2.4. Other
- 10.1. Market Analysis, Insights and Forecast - by Application
- 11. Competitive Analysis
- 11.1. Global Market Share Analysis 2025
- 11.2. Company Profiles
- 11.2.1 ConAgra Foods
- 11.2.1.1. Overview
- 11.2.1.2. Products
- 11.2.1.3. SWOT Analysis
- 11.2.1.4. Recent Developments
- 11.2.1.5. Financials (Based on Availability)
- 11.2.2 Fleury Michon
- 11.2.2.1. Overview
- 11.2.2.2. Products
- 11.2.2.3. SWOT Analysis
- 11.2.2.4. Recent Developments
- 11.2.2.5. Financials (Based on Availability)
- 11.2.3 Kraft Heinz
- 11.2.3.1. Overview
- 11.2.3.2. Products
- 11.2.3.3. SWOT Analysis
- 11.2.3.4. Recent Developments
- 11.2.3.5. Financials (Based on Availability)
- 11.2.4 Nestle SA
- 11.2.4.1. Overview
- 11.2.4.2. Products
- 11.2.4.3. SWOT Analysis
- 11.2.4.4. Recent Developments
- 11.2.4.5. Financials (Based on Availability)
- 11.2.5 Iceland Foods
- 11.2.5.1. Overview
- 11.2.5.2. Products
- 11.2.5.3. SWOT Analysis
- 11.2.5.4. Recent Developments
- 11.2.5.5. Financials (Based on Availability)
- 11.2.6 Maple Leaf Foods
- 11.2.6.1. Overview
- 11.2.6.2. Products
- 11.2.6.3. SWOT Analysis
- 11.2.6.4. Recent Developments
- 11.2.6.5. Financials (Based on Availability)
- 11.2.7 General Mills
- 11.2.7.1. Overview
- 11.2.7.2. Products
- 11.2.7.3. SWOT Analysis
- 11.2.7.4. Recent Developments
- 11.2.7.5. Financials (Based on Availability)
- 11.2.8 Schwan's Company
- 11.2.8.1. Overview
- 11.2.8.2. Products
- 11.2.8.3. SWOT Analysis
- 11.2.8.4. Recent Developments
- 11.2.8.5. Financials (Based on Availability)
- 11.2.9 Amy’s Kitchen
- 11.2.9.1. Overview
- 11.2.9.2. Products
- 11.2.9.3. SWOT Analysis
- 11.2.9.4. Recent Developments
- 11.2.9.5. Financials (Based on Availability)
- 11.2.10 McCain
- 11.2.10.1. Overview
- 11.2.10.2. Products
- 11.2.10.3. SWOT Analysis
- 11.2.10.4. Recent Developments
- 11.2.10.5. Financials (Based on Availability)
- 11.2.11 The Schwan Food Company
- 11.2.11.1. Overview
- 11.2.11.2. Products
- 11.2.11.3. SWOT Analysis
- 11.2.11.4. Recent Developments
- 11.2.11.5. Financials (Based on Availability)
- 11.2.12 Tyson Foods
- 11.2.12.1. Overview
- 11.2.12.2. Products
- 11.2.12.3. SWOT Analysis
- 11.2.12.4. Recent Developments
- 11.2.12.5. Financials (Based on Availability)
- 11.2.1 ConAgra Foods
List of Figures
- Figure 1: Global Quick Frozen Processed Foods Revenue Breakdown (million, %) by Region 2025 & 2033
- Figure 2: Global Quick Frozen Processed Foods Volume Breakdown (K, %) by Region 2025 & 2033
- Figure 3: North America Quick Frozen Processed Foods Revenue (million), by Application 2025 & 2033
- Figure 4: North America Quick Frozen Processed Foods Volume (K), by Application 2025 & 2033
- Figure 5: North America Quick Frozen Processed Foods Revenue Share (%), by Application 2025 & 2033
- Figure 6: North America Quick Frozen Processed Foods Volume Share (%), by Application 2025 & 2033
- Figure 7: North America Quick Frozen Processed Foods Revenue (million), by Type 2025 & 2033
- Figure 8: North America Quick Frozen Processed Foods Volume (K), by Type 2025 & 2033
- Figure 9: North America Quick Frozen Processed Foods Revenue Share (%), by Type 2025 & 2033
- Figure 10: North America Quick Frozen Processed Foods Volume Share (%), by Type 2025 & 2033
- Figure 11: North America Quick Frozen Processed Foods Revenue (million), by Country 2025 & 2033
- Figure 12: North America Quick Frozen Processed Foods Volume (K), by Country 2025 & 2033
- Figure 13: North America Quick Frozen Processed Foods Revenue Share (%), by Country 2025 & 2033
- Figure 14: North America Quick Frozen Processed Foods Volume Share (%), by Country 2025 & 2033
- Figure 15: South America Quick Frozen Processed Foods Revenue (million), by Application 2025 & 2033
- Figure 16: South America Quick Frozen Processed Foods Volume (K), by Application 2025 & 2033
- Figure 17: South America Quick Frozen Processed Foods Revenue Share (%), by Application 2025 & 2033
- Figure 18: South America Quick Frozen Processed Foods Volume Share (%), by Application 2025 & 2033
- Figure 19: South America Quick Frozen Processed Foods Revenue (million), by Type 2025 & 2033
- Figure 20: South America Quick Frozen Processed Foods Volume (K), by Type 2025 & 2033
- Figure 21: South America Quick Frozen Processed Foods Revenue Share (%), by Type 2025 & 2033
- Figure 22: South America Quick Frozen Processed Foods Volume Share (%), by Type 2025 & 2033
- Figure 23: South America Quick Frozen Processed Foods Revenue (million), by Country 2025 & 2033
- Figure 24: South America Quick Frozen Processed Foods Volume (K), by Country 2025 & 2033
- Figure 25: South America Quick Frozen Processed Foods Revenue Share (%), by Country 2025 & 2033
- Figure 26: South America Quick Frozen Processed Foods Volume Share (%), by Country 2025 & 2033
- Figure 27: Europe Quick Frozen Processed Foods Revenue (million), by Application 2025 & 2033
- Figure 28: Europe Quick Frozen Processed Foods Volume (K), by Application 2025 & 2033
- Figure 29: Europe Quick Frozen Processed Foods Revenue Share (%), by Application 2025 & 2033
- Figure 30: Europe Quick Frozen Processed Foods Volume Share (%), by Application 2025 & 2033
- Figure 31: Europe Quick Frozen Processed Foods Revenue (million), by Type 2025 & 2033
- Figure 32: Europe Quick Frozen Processed Foods Volume (K), by Type 2025 & 2033
- Figure 33: Europe Quick Frozen Processed Foods Revenue Share (%), by Type 2025 & 2033
- Figure 34: Europe Quick Frozen Processed Foods Volume Share (%), by Type 2025 & 2033
- Figure 35: Europe Quick Frozen Processed Foods Revenue (million), by Country 2025 & 2033
- Figure 36: Europe Quick Frozen Processed Foods Volume (K), by Country 2025 & 2033
- Figure 37: Europe Quick Frozen Processed Foods Revenue Share (%), by Country 2025 & 2033
- Figure 38: Europe Quick Frozen Processed Foods Volume Share (%), by Country 2025 & 2033
- Figure 39: Middle East & Africa Quick Frozen Processed Foods Revenue (million), by Application 2025 & 2033
- Figure 40: Middle East & Africa Quick Frozen Processed Foods Volume (K), by Application 2025 & 2033
- Figure 41: Middle East & Africa Quick Frozen Processed Foods Revenue Share (%), by Application 2025 & 2033
- Figure 42: Middle East & Africa Quick Frozen Processed Foods Volume Share (%), by Application 2025 & 2033
- Figure 43: Middle East & Africa Quick Frozen Processed Foods Revenue (million), by Type 2025 & 2033
- Figure 44: Middle East & Africa Quick Frozen Processed Foods Volume (K), by Type 2025 & 2033
- Figure 45: Middle East & Africa Quick Frozen Processed Foods Revenue Share (%), by Type 2025 & 2033
- Figure 46: Middle East & Africa Quick Frozen Processed Foods Volume Share (%), by Type 2025 & 2033
- Figure 47: Middle East & Africa Quick Frozen Processed Foods Revenue (million), by Country 2025 & 2033
- Figure 48: Middle East & Africa Quick Frozen Processed Foods Volume (K), by Country 2025 & 2033
- Figure 49: Middle East & Africa Quick Frozen Processed Foods Revenue Share (%), by Country 2025 & 2033
- Figure 50: Middle East & Africa Quick Frozen Processed Foods Volume Share (%), by Country 2025 & 2033
- Figure 51: Asia Pacific Quick Frozen Processed Foods Revenue (million), by Application 2025 & 2033
- Figure 52: Asia Pacific Quick Frozen Processed Foods Volume (K), by Application 2025 & 2033
- Figure 53: Asia Pacific Quick Frozen Processed Foods Revenue Share (%), by Application 2025 & 2033
- Figure 54: Asia Pacific Quick Frozen Processed Foods Volume Share (%), by Application 2025 & 2033
- Figure 55: Asia Pacific Quick Frozen Processed Foods Revenue (million), by Type 2025 & 2033
- Figure 56: Asia Pacific Quick Frozen Processed Foods Volume (K), by Type 2025 & 2033
- Figure 57: Asia Pacific Quick Frozen Processed Foods Revenue Share (%), by Type 2025 & 2033
- Figure 58: Asia Pacific Quick Frozen Processed Foods Volume Share (%), by Type 2025 & 2033
- Figure 59: Asia Pacific Quick Frozen Processed Foods Revenue (million), by Country 2025 & 2033
- Figure 60: Asia Pacific Quick Frozen Processed Foods Volume (K), by Country 2025 & 2033
- Figure 61: Asia Pacific Quick Frozen Processed Foods Revenue Share (%), by Country 2025 & 2033
- Figure 62: Asia Pacific Quick Frozen Processed Foods Volume Share (%), by Country 2025 & 2033
List of Tables
- Table 1: Global Quick Frozen Processed Foods Revenue million Forecast, by Application 2020 & 2033
- Table 2: Global Quick Frozen Processed Foods Volume K Forecast, by Application 2020 & 2033
- Table 3: Global Quick Frozen Processed Foods Revenue million Forecast, by Type 2020 & 2033
- Table 4: Global Quick Frozen Processed Foods Volume K Forecast, by Type 2020 & 2033
- Table 5: Global Quick Frozen Processed Foods Revenue million Forecast, by Region 2020 & 2033
- Table 6: Global Quick Frozen Processed Foods Volume K Forecast, by Region 2020 & 2033
- Table 7: Global Quick Frozen Processed Foods Revenue million Forecast, by Application 2020 & 2033
- Table 8: Global Quick Frozen Processed Foods Volume K Forecast, by Application 2020 & 2033
- Table 9: Global Quick Frozen Processed Foods Revenue million Forecast, by Type 2020 & 2033
- Table 10: Global Quick Frozen Processed Foods Volume K Forecast, by Type 2020 & 2033
- Table 11: Global Quick Frozen Processed Foods Revenue million Forecast, by Country 2020 & 2033
- Table 12: Global Quick Frozen Processed Foods Volume K Forecast, by Country 2020 & 2033
- Table 13: United States Quick Frozen Processed Foods Revenue (million) Forecast, by Application 2020 & 2033
- Table 14: United States Quick Frozen Processed Foods Volume (K) Forecast, by Application 2020 & 2033
- Table 15: Canada Quick Frozen Processed Foods Revenue (million) Forecast, by Application 2020 & 2033
- Table 16: Canada Quick Frozen Processed Foods Volume (K) Forecast, by Application 2020 & 2033
- Table 17: Mexico Quick Frozen Processed Foods Revenue (million) Forecast, by Application 2020 & 2033
- Table 18: Mexico Quick Frozen Processed Foods Volume (K) Forecast, by Application 2020 & 2033
- Table 19: Global Quick Frozen Processed Foods Revenue million Forecast, by Application 2020 & 2033
- Table 20: Global Quick Frozen Processed Foods Volume K Forecast, by Application 2020 & 2033
- Table 21: Global Quick Frozen Processed Foods Revenue million Forecast, by Type 2020 & 2033
- Table 22: Global Quick Frozen Processed Foods Volume K Forecast, by Type 2020 & 2033
- Table 23: Global Quick Frozen Processed Foods Revenue million Forecast, by Country 2020 & 2033
- Table 24: Global Quick Frozen Processed Foods Volume K Forecast, by Country 2020 & 2033
- Table 25: Brazil Quick Frozen Processed Foods Revenue (million) Forecast, by Application 2020 & 2033
- Table 26: Brazil Quick Frozen Processed Foods Volume (K) Forecast, by Application 2020 & 2033
- Table 27: Argentina Quick Frozen Processed Foods Revenue (million) Forecast, by Application 2020 & 2033
- Table 28: Argentina Quick Frozen Processed Foods Volume (K) Forecast, by Application 2020 & 2033
- Table 29: Rest of South America Quick Frozen Processed Foods Revenue (million) Forecast, by Application 2020 & 2033
- Table 30: Rest of South America Quick Frozen Processed Foods Volume (K) Forecast, by Application 2020 & 2033
- Table 31: Global Quick Frozen Processed Foods Revenue million Forecast, by Application 2020 & 2033
- Table 32: Global Quick Frozen Processed Foods Volume K Forecast, by Application 2020 & 2033
- Table 33: Global Quick Frozen Processed Foods Revenue million Forecast, by Type 2020 & 2033
- Table 34: Global Quick Frozen Processed Foods Volume K Forecast, by Type 2020 & 2033
- Table 35: Global Quick Frozen Processed Foods Revenue million Forecast, by Country 2020 & 2033
- Table 36: Global Quick Frozen Processed Foods Volume K Forecast, by Country 2020 & 2033
- Table 37: United Kingdom Quick Frozen Processed Foods Revenue (million) Forecast, by Application 2020 & 2033
- Table 38: United Kingdom Quick Frozen Processed Foods Volume (K) Forecast, by Application 2020 & 2033
- Table 39: Germany Quick Frozen Processed Foods Revenue (million) Forecast, by Application 2020 & 2033
- Table 40: Germany Quick Frozen Processed Foods Volume (K) Forecast, by Application 2020 & 2033
- Table 41: France Quick Frozen Processed Foods Revenue (million) Forecast, by Application 2020 & 2033
- Table 42: France Quick Frozen Processed Foods Volume (K) Forecast, by Application 2020 & 2033
- Table 43: Italy Quick Frozen Processed Foods Revenue (million) Forecast, by Application 2020 & 2033
- Table 44: Italy Quick Frozen Processed Foods Volume (K) Forecast, by Application 2020 & 2033
- Table 45: Spain Quick Frozen Processed Foods Revenue (million) Forecast, by Application 2020 & 2033
- Table 46: Spain Quick Frozen Processed Foods Volume (K) Forecast, by Application 2020 & 2033
- Table 47: Russia Quick Frozen Processed Foods Revenue (million) Forecast, by Application 2020 & 2033
- Table 48: Russia Quick Frozen Processed Foods Volume (K) Forecast, by Application 2020 & 2033
- Table 49: Benelux Quick Frozen Processed Foods Revenue (million) Forecast, by Application 2020 & 2033
- Table 50: Benelux Quick Frozen Processed Foods Volume (K) Forecast, by Application 2020 & 2033
- Table 51: Nordics Quick Frozen Processed Foods Revenue (million) Forecast, by Application 2020 & 2033
- Table 52: Nordics Quick Frozen Processed Foods Volume (K) Forecast, by Application 2020 & 2033
- Table 53: Rest of Europe Quick Frozen Processed Foods Revenue (million) Forecast, by Application 2020 & 2033
- Table 54: Rest of Europe Quick Frozen Processed Foods Volume (K) Forecast, by Application 2020 & 2033
- Table 55: Global Quick Frozen Processed Foods Revenue million Forecast, by Application 2020 & 2033
- Table 56: Global Quick Frozen Processed Foods Volume K Forecast, by Application 2020 & 2033
- Table 57: Global Quick Frozen Processed Foods Revenue million Forecast, by Type 2020 & 2033
- Table 58: Global Quick Frozen Processed Foods Volume K Forecast, by Type 2020 & 2033
- Table 59: Global Quick Frozen Processed Foods Revenue million Forecast, by Country 2020 & 2033
- Table 60: Global Quick Frozen Processed Foods Volume K Forecast, by Country 2020 & 2033
- Table 61: Turkey Quick Frozen Processed Foods Revenue (million) Forecast, by Application 2020 & 2033
- Table 62: Turkey Quick Frozen Processed Foods Volume (K) Forecast, by Application 2020 & 2033
- Table 63: Israel Quick Frozen Processed Foods Revenue (million) Forecast, by Application 2020 & 2033
- Table 64: Israel Quick Frozen Processed Foods Volume (K) Forecast, by Application 2020 & 2033
- Table 65: GCC Quick Frozen Processed Foods Revenue (million) Forecast, by Application 2020 & 2033
- Table 66: GCC Quick Frozen Processed Foods Volume (K) Forecast, by Application 2020 & 2033
- Table 67: North Africa Quick Frozen Processed Foods Revenue (million) Forecast, by Application 2020 & 2033
- Table 68: North Africa Quick Frozen Processed Foods Volume (K) Forecast, by Application 2020 & 2033
- Table 69: South Africa Quick Frozen Processed Foods Revenue (million) Forecast, by Application 2020 & 2033
- Table 70: South Africa Quick Frozen Processed Foods Volume (K) Forecast, by Application 2020 & 2033
- Table 71: Rest of Middle East & Africa Quick Frozen Processed Foods Revenue (million) Forecast, by Application 2020 & 2033
- Table 72: Rest of Middle East & Africa Quick Frozen Processed Foods Volume (K) Forecast, by Application 2020 & 2033
- Table 73: Global Quick Frozen Processed Foods Revenue million Forecast, by Application 2020 & 2033
- Table 74: Global Quick Frozen Processed Foods Volume K Forecast, by Application 2020 & 2033
- Table 75: Global Quick Frozen Processed Foods Revenue million Forecast, by Type 2020 & 2033
- Table 76: Global Quick Frozen Processed Foods Volume K Forecast, by Type 2020 & 2033
- Table 77: Global Quick Frozen Processed Foods Revenue million Forecast, by Country 2020 & 2033
- Table 78: Global Quick Frozen Processed Foods Volume K Forecast, by Country 2020 & 2033
- Table 79: China Quick Frozen Processed Foods Revenue (million) Forecast, by Application 2020 & 2033
- Table 80: China Quick Frozen Processed Foods Volume (K) Forecast, by Application 2020 & 2033
- Table 81: India Quick Frozen Processed Foods Revenue (million) Forecast, by Application 2020 & 2033
- Table 82: India Quick Frozen Processed Foods Volume (K) Forecast, by Application 2020 & 2033
- Table 83: Japan Quick Frozen Processed Foods Revenue (million) Forecast, by Application 2020 & 2033
- Table 84: Japan Quick Frozen Processed Foods Volume (K) Forecast, by Application 2020 & 2033
- Table 85: South Korea Quick Frozen Processed Foods Revenue (million) Forecast, by Application 2020 & 2033
- Table 86: South Korea Quick Frozen Processed Foods Volume (K) Forecast, by Application 2020 & 2033
- Table 87: ASEAN Quick Frozen Processed Foods Revenue (million) Forecast, by Application 2020 & 2033
- Table 88: ASEAN Quick Frozen Processed Foods Volume (K) Forecast, by Application 2020 & 2033
- Table 89: Oceania Quick Frozen Processed Foods Revenue (million) Forecast, by Application 2020 & 2033
- Table 90: Oceania Quick Frozen Processed Foods Volume (K) Forecast, by Application 2020 & 2033
- Table 91: Rest of Asia Pacific Quick Frozen Processed Foods Revenue (million) Forecast, by Application 2020 & 2033
- Table 92: Rest of Asia Pacific Quick Frozen Processed Foods Volume (K) Forecast, by Application 2020 & 2033
Frequently Asked Questions
1. What is the projected Compound Annual Growth Rate (CAGR) of the Quick Frozen Processed Foods?
The projected CAGR is approximately XXX%.
2. Which companies are prominent players in the Quick Frozen Processed Foods?
Key companies in the market include ConAgra Foods, Fleury Michon, Kraft Heinz, Nestle SA, Iceland Foods, Maple Leaf Foods, General Mills, Schwan's Company, Amy’s Kitchen, McCain, The Schwan Food Company, Tyson Foods.
3. What are the main segments of the Quick Frozen Processed Foods?
The market segments include Application, Type.
4. Can you provide details about the market size?
The market size is estimated to be USD XXX million as of 2022.
5. What are some drivers contributing to market growth?
N/A
6. What are the notable trends driving market growth?
N/A
7. Are there any restraints impacting market growth?
N/A
8. Can you provide examples of recent developments in the market?
N/A
9. What pricing options are available for accessing the report?
Pricing options include single-user, multi-user, and enterprise licenses priced at USD 3950.00, USD 5925.00, and USD 7900.00 respectively.
10. Is the market size provided in terms of value or volume?
The market size is provided in terms of value, measured in million and volume, measured in K.
11. Are there any specific market keywords associated with the report?
Yes, the market keyword associated with the report is "Quick Frozen Processed Foods," which aids in identifying and referencing the specific market segment covered.
12. How do I determine which pricing option suits my needs best?
The pricing options vary based on user requirements and access needs. Individual users may opt for single-user licenses, while businesses requiring broader access may choose multi-user or enterprise licenses for cost-effective access to the report.
13. Are there any additional resources or data provided in the Quick Frozen Processed Foods report?
While the report offers comprehensive insights, it's advisable to review the specific contents or supplementary materials provided to ascertain if additional resources or data are available.
14. How can I stay updated on further developments or reports in the Quick Frozen Processed Foods?
To stay informed about further developments, trends, and reports in the Quick Frozen Processed Foods, consider subscribing to industry newsletters, following relevant companies and organizations, or regularly checking reputable industry news sources and publications.
Methodology
Step 1 - Identification of Relevant Samples Size from Population Database


Step 2 - Approaches for Defining Global Market Size (Value, Volume* & Price*)

Note*: In applicable scenarios
Step 3 - Data Sources
Primary Research
- Web Analytics
- Survey Reports
- Research Institute
- Latest Research Reports
- Opinion Leaders
Secondary Research
- Annual Reports
- White Paper
- Latest Press Release
- Industry Association
- Paid Database
- Investor Presentations

Step 4 - Data Triangulation
Involves using different sources of information in order to increase the validity of a study
These sources are likely to be stakeholders in a program - participants, other researchers, program staff, other community members, and so on.
Then we put all data in single framework & apply various statistical tools to find out the dynamic on the market.
During the analysis stage, feedback from the stakeholder groups would be compared to determine areas of agreement as well as areas of divergence