Key Insights
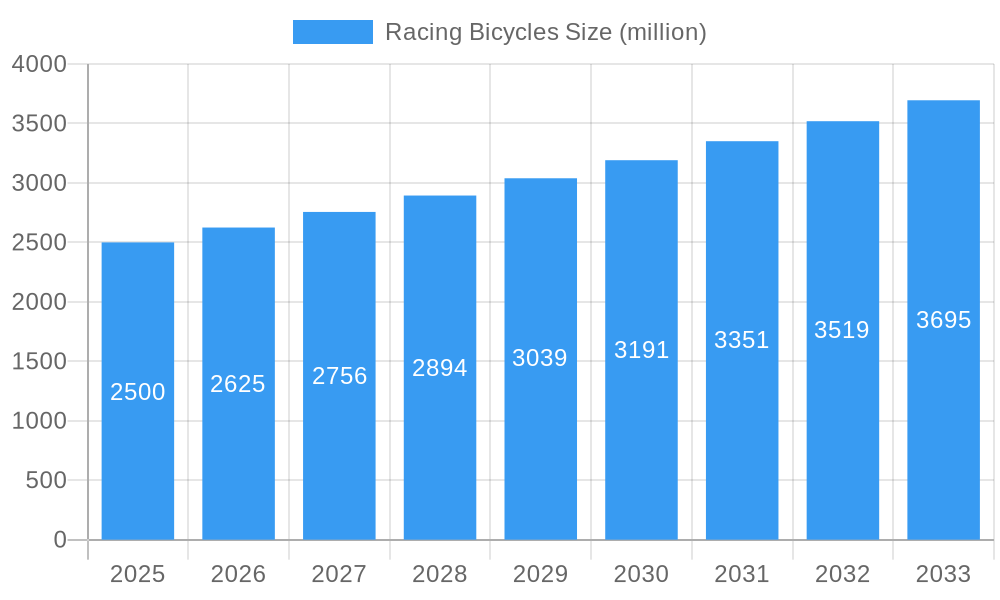
The global racing bicycle market, while experiencing fluctuations, demonstrates consistent growth potential. A robust market size of approximately $2.5 billion in 2025 is projected, with a Compound Annual Growth Rate (CAGR) of around 5% from 2025 to 2033. This growth is fueled by several key drivers. Increasing participation in professional and amateur cycling events worldwide fuels demand for high-performance bicycles. Technological advancements, such as the use of lighter and stronger materials like carbon fiber and improved aerodynamic designs, are attracting both experienced cyclists and newcomers seeking superior performance. Growing health consciousness and a preference for eco-friendly transportation options also contribute to this market's expansion. However, restraints remain, including high initial costs that can be a barrier to entry for many consumers, and the dependence on favorable economic conditions, since discretionary spending on recreational items like racing bicycles is often affected by economic downturns. Segmentation within the market includes various bicycle types (e.g., road bikes, track bikes, cyclo-cross bikes), pricing tiers (entry-level, mid-range, high-end), and materials used (carbon fiber, aluminum, steel).
Racing Bicycles Market Size (In Billion)
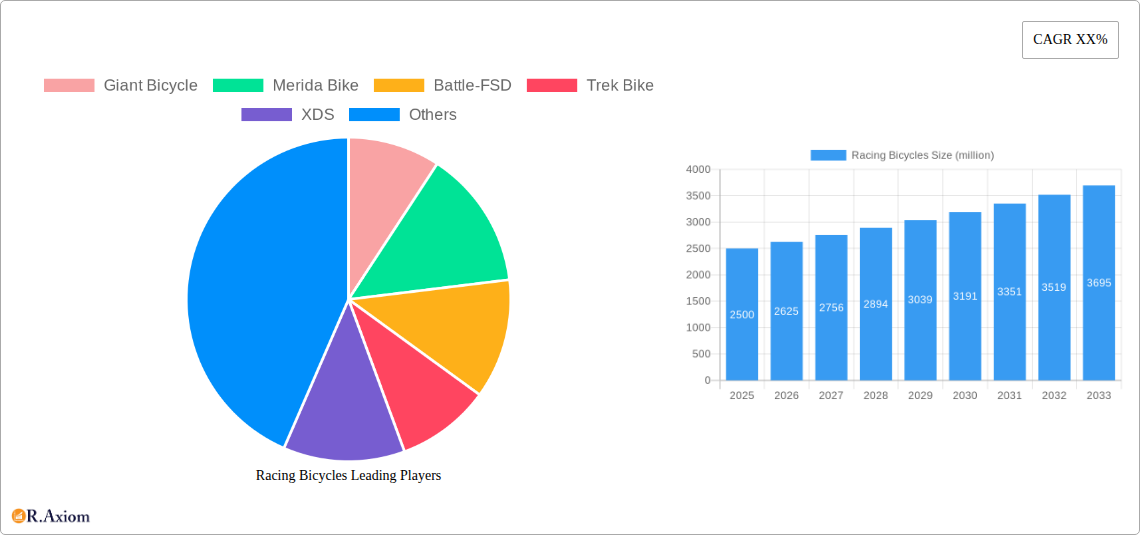
Leading brands such as Giant Bicycle, Merida Bike, Trek Bike, and Canyon dominate the market, leveraging their strong brand recognition, extensive distribution networks, and technological innovations to maintain a competitive edge. The regional breakdown shows significant market penetration in North America and Europe, driven by high disposable incomes and established cycling cultures. However, emerging markets in Asia and Latin America represent promising growth opportunities as cycling infrastructure develops and participation rates increase. The forecast period (2025-2033) anticipates a continued expansion of the racing bicycle market, albeit at a moderate pace, with specific growth rates varying across regions depending on economic factors, infrastructural developments, and the level of cycling participation within each market.
Racing Bicycles Company Market Share
This comprehensive report provides an in-depth analysis of the global racing bicycles market from 2019 to 2033, offering crucial insights for industry stakeholders, investors, and strategic decision-makers. With a focus on market trends, competitive landscapes, and future growth projections, this report is an invaluable resource for understanding this dynamic sector. The report covers a market valued at over $XX million in 2025 and projects significant growth over the forecast period (2025-2033).
Racing Bicycles Market Concentration & Innovation
This section analyzes the competitive landscape of the racing bicycle market, examining market concentration, innovation drivers, regulatory factors, and M&A activities. The study period (2019-2024) reveals a moderately concentrated market with key players holding significant market share. Giant Bicycle, Trek Bike, and Merida Bike, amongst others, consistently feature in the top positions. The historical period showed a $XX million market value growing at a CAGR of XX% during the period of 2019-2024.
- Market Share: Giant Bicycle holds an estimated XX% market share in 2025, followed by Trek Bike at XX% and Merida Bike at XX%. Other significant players include Canyon, Pinarello, and Specialized, each holding a share ranging between XX% and XX%.
- M&A Activity: The report tracks significant mergers and acquisitions (M&As) within the industry during the study period. While specific deal values remain confidential for many transactions, the total estimated value of M&A deals during the 2019-2024 period is estimated at $XX million, reflecting a consolidation trend within the market.
- Innovation Drivers: Key innovation drivers include advancements in materials science (carbon fiber, titanium), aerodynamic improvements, technological integration (smart bike technology), and sustainable manufacturing practices.
- Regulatory Landscape: International and regional regulations impacting product safety, environmental standards, and trade policies are analyzed.
- Product Substitutes: The report examines potential substitutes, including e-bikes and other forms of athletic equipment, and assesses their impact on market demand.
Racing Bicycles Industry Trends & Insights
This section delves into the key trends shaping the racing bicycles market. The market is witnessing significant growth fueled by several factors. The estimated market value in 2025 is $XX million, projected to reach $XX million by 2033, exhibiting a CAGR of XX% during the forecast period.
- Market Growth Drivers: Increased participation in cycling events, rising health consciousness and fitness trends, growing disposable incomes in developing economies, and technological advancements are significant factors driving market expansion.
- Technological Disruptions: The integration of smart technology, including GPS tracking, performance monitoring, and connectivity features, is revolutionizing the racing bicycle market. This is driving demand for higher-priced, technologically advanced bikes.
- Consumer Preferences: Consumer preferences are shifting towards lightweight, aerodynamically efficient bikes with enhanced comfort features and personalized customization options.
- Competitive Dynamics: The market is characterized by intense competition among established players and emerging brands, leading to continuous product innovation, pricing strategies, and expansion into new markets.
Dominant Markets & Segments in Racing Bicycles
This section identifies the leading regions, countries, and market segments within the racing bicycles market.
Dominant Regions: The market shows strong growth in North America and Europe, driven by established cycling cultures and high disposable incomes. However, Asia-Pacific is experiencing rapid expansion due to increasing participation in cycling sports and rising middle-class incomes.
Key Drivers of Regional Dominance:
- North America: Strong cycling culture, well-established cycling infrastructure, high disposable incomes.
- Europe: Established cycling tradition, substantial government support for cycling infrastructure, numerous cycling events.
- Asia-Pacific: Rising middle class, increasing participation in cycling sports, government initiatives promoting cycling infrastructure.
Detailed Dominance Analysis: While North America and Europe currently hold larger market shares, the Asia-Pacific region exhibits the highest growth potential due to its expanding middle class and rapidly developing cycling infrastructure. Further analysis includes specific country-level data within these regions.
Racing Bicycles Product Developments
Recent product innovations include advancements in aerodynamic frame designs, lighter and stronger materials (carbon fiber composites, titanium alloys), improved component technologies (groupsets, wheels, brakes), and the integration of smart bike technologies (GPS, power meters, connectivity). These innovations cater to the demands for enhanced performance, durability, and user experience, shaping competitive advantages for manufacturers.
Report Scope & Segmentation Analysis
This report segments the racing bicycles market based on several factors, including bicycle type (road bikes, track bikes, cyclocross bikes, triathlon bikes), material (carbon fiber, aluminum, steel, titanium), price range (high-end, mid-range, low-end), and distribution channel (online retailers, specialty bicycle shops, mass retailers). Each segment's market size, growth projections, and competitive dynamics are analyzed, with projections extending to 2033.
Key Drivers of Racing Bicycles Growth
Several factors contribute to the growth of the racing bicycles market. Technological advancements leading to lighter, faster, and more efficient bikes, increased health consciousness and fitness trends, rising disposable incomes globally, and growing popularity of cycling events and races all play significant roles. Furthermore, government initiatives promoting cycling infrastructure and sustainable transportation contribute to market expansion.
Challenges in the Racing Bicycles Sector
The racing bicycle industry faces challenges including fluctuating raw material costs, intense competition leading to price pressures, supply chain disruptions, and the need for continuous innovation to maintain a competitive edge. These factors can influence profitability and market share.
Emerging Opportunities in Racing Bicycles
Emerging opportunities lie in the integration of smart technology, expansion into new markets (particularly developing countries with growing middle classes), and customization options catering to individual rider preferences. Sustainable manufacturing practices and eco-friendly materials present further opportunities for growth and brand differentiation.
Leading Players in the Racing Bicycles Market
- Giant Bicycle
- Merida Bike
- Battle-FSD
- Trek Bike
- XDS
- Shen Ying Biking
- Look Cycle
- Marmot Bike
- Cube Bike
- Colnago
- SOLOMO
- Kestrel Bicycles
- Storck Bicycle
- Tyrell Bicycle
- De Rosa
- DAHON
- Pinarello
- Canyon
- Felt Cycles
- Ellsworth Bike
Key Developments in Racing Bicycles Industry
- 2022-Q4: Giant Bicycle launched a new range of aerodynamic road bikes incorporating advanced carbon fiber technology.
- 2023-Q1: Merida Bike announced a strategic partnership with a leading component manufacturer to develop innovative groupsets.
- 2023-Q2: Trek Bike acquired a smaller competitor, expanding its market share and product portfolio. (Further examples would be added here from the source data)
Strategic Outlook for Racing Bicycles Market
The racing bicycle market is poised for continued growth driven by technological advancements, rising health consciousness, and expanding participation in cycling events. Opportunities exist for companies that can innovate effectively, cater to evolving consumer preferences, and establish strong brand recognition. The market's long-term growth trajectory remains positive, with substantial potential for expansion in both established and emerging markets.
Racing Bicycles Segmentation
-
1. Application
- 1.1. Bicycle Racing
- 1.2. Bicycle Touring
- 1.3. Others
-
2. Types
- 2.1. Road Bikes
- 2.2. Mountain Bikes
- 2.3. Others
Racing Bicycles Segmentation By Geography
-
1. North America
- 1.1. United States
- 1.2. Canada
- 1.3. Mexico
-
2. South America
- 2.1. Brazil
- 2.2. Argentina
- 2.3. Rest of South America
-
3. Europe
- 3.1. United Kingdom
- 3.2. Germany
- 3.3. France
- 3.4. Italy
- 3.5. Spain
- 3.6. Russia
- 3.7. Benelux
- 3.8. Nordics
- 3.9. Rest of Europe
-
4. Middle East & Africa
- 4.1. Turkey
- 4.2. Israel
- 4.3. GCC
- 4.4. North Africa
- 4.5. South Africa
- 4.6. Rest of Middle East & Africa
-
5. Asia Pacific
- 5.1. China
- 5.2. India
- 5.3. Japan
- 5.4. South Korea
- 5.5. ASEAN
- 5.6. Oceania
- 5.7. Rest of Asia Pacific

Racing Bicycles Regional Market Share
Geographic Coverage of Racing Bicycles
Racing Bicycles REPORT HIGHLIGHTS
| Aspects | Details |
|---|---|
| Study Period | 2020-2034 |
| Base Year | 2025 |
| Estimated Year | 2026 |
| Forecast Period | 2026-2034 |
| Historical Period | 2020-2025 |
| Growth Rate | CAGR of XX% from 2020-2034 |
| Segmentation |
|
Table of Contents
- 1. Introduction
- 1.1. Research Scope
- 1.2. Market Segmentation
- 1.3. Research Objective
- 1.4. Definitions and Assumptions
- 2. Executive Summary
- 2.1. Market Snapshot
- 3. Market Dynamics
- 3.1. Market Drivers
- 3.2. Market Restrains
- 3.3. Market Trends
- 3.4. Market Opportunities
- 4. Market Factor Analysis
- 4.1. Porters Five Forces
- 4.1.1. Bargaining Power of Suppliers
- 4.1.2. Bargaining Power of Buyers
- 4.1.3. Threat of New Entrants
- 4.1.4. Threat of Substitutes
- 4.1.5. Competitive Rivalry
- 4.2. PESTEL analysis
- 4.3. BCG Analysis
- 4.3.1. Stars (High Growth, High Market Share)
- 4.3.2. Cash Cows (Low Growth, High Market Share)
- 4.3.3. Question Mark (High Growth, Low Market Share)
- 4.3.4. Dogs (Low Growth, Low Market Share)
- 4.4. Ansoff Matrix Analysis
- 4.5. Supply Chain Analysis
- 4.6. Regulatory Landscape
- 4.7. Current Market Potential and Opportunity Assessment (TAM–SAM–SOM Framework)
- 4.8. RAX Analyst Note
- 4.1. Porters Five Forces
- 5. Market Analysis, Insights and Forecast 2021-2033
- 5.1. Market Analysis, Insights and Forecast - by Application
- 5.1.1. Bicycle Racing
- 5.1.2. Bicycle Touring
- 5.1.3. Others
- 5.2. Market Analysis, Insights and Forecast - by Types
- 5.2.1. Road Bikes
- 5.2.2. Mountain Bikes
- 5.2.3. Others
- 5.3. Market Analysis, Insights and Forecast - by Region
- 5.3.1. North America
- 5.3.2. South America
- 5.3.3. Europe
- 5.3.4. Middle East & Africa
- 5.3.5. Asia Pacific
- 5.1. Market Analysis, Insights and Forecast - by Application
- 6. Global Racing Bicycles Analysis, Insights and Forecast, 2021-2033
- 6.1. Market Analysis, Insights and Forecast - by Application
- 6.1.1. Bicycle Racing
- 6.1.2. Bicycle Touring
- 6.1.3. Others
- 6.2. Market Analysis, Insights and Forecast - by Types
- 6.2.1. Road Bikes
- 6.2.2. Mountain Bikes
- 6.2.3. Others
- 6.1. Market Analysis, Insights and Forecast - by Application
- 7. North America Racing Bicycles Analysis, Insights and Forecast, 2020-2032
- 7.1. Market Analysis, Insights and Forecast - by Application
- 7.1.1. Bicycle Racing
- 7.1.2. Bicycle Touring
- 7.1.3. Others
- 7.2. Market Analysis, Insights and Forecast - by Types
- 7.2.1. Road Bikes
- 7.2.2. Mountain Bikes
- 7.2.3. Others
- 7.1. Market Analysis, Insights and Forecast - by Application
- 8. South America Racing Bicycles Analysis, Insights and Forecast, 2020-2032
- 8.1. Market Analysis, Insights and Forecast - by Application
- 8.1.1. Bicycle Racing
- 8.1.2. Bicycle Touring
- 8.1.3. Others
- 8.2. Market Analysis, Insights and Forecast - by Types
- 8.2.1. Road Bikes
- 8.2.2. Mountain Bikes
- 8.2.3. Others
- 8.1. Market Analysis, Insights and Forecast - by Application
- 9. Europe Racing Bicycles Analysis, Insights and Forecast, 2020-2032
- 9.1. Market Analysis, Insights and Forecast - by Application
- 9.1.1. Bicycle Racing
- 9.1.2. Bicycle Touring
- 9.1.3. Others
- 9.2. Market Analysis, Insights and Forecast - by Types
- 9.2.1. Road Bikes
- 9.2.2. Mountain Bikes
- 9.2.3. Others
- 9.1. Market Analysis, Insights and Forecast - by Application
- 10. Middle East & Africa Racing Bicycles Analysis, Insights and Forecast, 2020-2032
- 10.1. Market Analysis, Insights and Forecast - by Application
- 10.1.1. Bicycle Racing
- 10.1.2. Bicycle Touring
- 10.1.3. Others
- 10.2. Market Analysis, Insights and Forecast - by Types
- 10.2.1. Road Bikes
- 10.2.2. Mountain Bikes
- 10.2.3. Others
- 10.1. Market Analysis, Insights and Forecast - by Application
- 11. Asia Pacific Racing Bicycles Analysis, Insights and Forecast, 2020-2032
- 11.1. Market Analysis, Insights and Forecast - by Application
- 11.1.1. Bicycle Racing
- 11.1.2. Bicycle Touring
- 11.1.3. Others
- 11.2. Market Analysis, Insights and Forecast - by Types
- 11.2.1. Road Bikes
- 11.2.2. Mountain Bikes
- 11.2.3. Others
- 11.1. Market Analysis, Insights and Forecast - by Application
- 12. Competitive Analysis
- 12.1. Company Profiles
- 12.1.1 Giant Bicycle
- 12.1.1.1. Company Overview
- 12.1.1.2. Products
- 12.1.1.3. Company Financials
- 12.1.1.4. SWOT Analysis
- 12.1.2 Merida Bike
- 12.1.2.1. Company Overview
- 12.1.2.2. Products
- 12.1.2.3. Company Financials
- 12.1.2.4. SWOT Analysis
- 12.1.3 Battle-FSD
- 12.1.3.1. Company Overview
- 12.1.3.2. Products
- 12.1.3.3. Company Financials
- 12.1.3.4. SWOT Analysis
- 12.1.4 Trek Bike
- 12.1.4.1. Company Overview
- 12.1.4.2. Products
- 12.1.4.3. Company Financials
- 12.1.4.4. SWOT Analysis
- 12.1.5 XDS
- 12.1.5.1. Company Overview
- 12.1.5.2. Products
- 12.1.5.3. Company Financials
- 12.1.5.4. SWOT Analysis
- 12.1.6 Shen Ying Biking
- 12.1.6.1. Company Overview
- 12.1.6.2. Products
- 12.1.6.3. Company Financials
- 12.1.6.4. SWOT Analysis
- 12.1.7 Look Cycle
- 12.1.7.1. Company Overview
- 12.1.7.2. Products
- 12.1.7.3. Company Financials
- 12.1.7.4. SWOT Analysis
- 12.1.8 Marmot Bike
- 12.1.8.1. Company Overview
- 12.1.8.2. Products
- 12.1.8.3. Company Financials
- 12.1.8.4. SWOT Analysis
- 12.1.9 Cube Bike
- 12.1.9.1. Company Overview
- 12.1.9.2. Products
- 12.1.9.3. Company Financials
- 12.1.9.4. SWOT Analysis
- 12.1.10 Colnago
- 12.1.10.1. Company Overview
- 12.1.10.2. Products
- 12.1.10.3. Company Financials
- 12.1.10.4. SWOT Analysis
- 12.1.11 SOLOMO
- 12.1.11.1. Company Overview
- 12.1.11.2. Products
- 12.1.11.3. Company Financials
- 12.1.11.4. SWOT Analysis
- 12.1.12 Kestrel Bicycles
- 12.1.12.1. Company Overview
- 12.1.12.2. Products
- 12.1.12.3. Company Financials
- 12.1.12.4. SWOT Analysis
- 12.1.13 Storck Bicycle
- 12.1.13.1. Company Overview
- 12.1.13.2. Products
- 12.1.13.3. Company Financials
- 12.1.13.4. SWOT Analysis
- 12.1.14 Tyrell Bicycle
- 12.1.14.1. Company Overview
- 12.1.14.2. Products
- 12.1.14.3. Company Financials
- 12.1.14.4. SWOT Analysis
- 12.1.15 De Rosa
- 12.1.15.1. Company Overview
- 12.1.15.2. Products
- 12.1.15.3. Company Financials
- 12.1.15.4. SWOT Analysis
- 12.1.16 DAHON
- 12.1.16.1. Company Overview
- 12.1.16.2. Products
- 12.1.16.3. Company Financials
- 12.1.16.4. SWOT Analysis
- 12.1.17 Pinarello
- 12.1.17.1. Company Overview
- 12.1.17.2. Products
- 12.1.17.3. Company Financials
- 12.1.17.4. SWOT Analysis
- 12.1.18 Canyon
- 12.1.18.1. Company Overview
- 12.1.18.2. Products
- 12.1.18.3. Company Financials
- 12.1.18.4. SWOT Analysis
- 12.1.19 Felt Cycles
- 12.1.19.1. Company Overview
- 12.1.19.2. Products
- 12.1.19.3. Company Financials
- 12.1.19.4. SWOT Analysis
- 12.1.20 Ellsworth Bike
- 12.1.20.1. Company Overview
- 12.1.20.2. Products
- 12.1.20.3. Company Financials
- 12.1.20.4. SWOT Analysis
- 12.1.1 Giant Bicycle
- 12.2. Market Entropy
- 12.2.1 Company's Key Areas Served
- 12.2.2 Recent Developments
- 12.3. Company Market Share Analysis 2025
- 12.3.1 Top 5 Companies Market Share Analysis
- 12.3.2 Top 3 Companies Market Share Analysis
- 12.4. List of Potential Customers
- 13. Research Methodology
List of Figures
- Figure 1: Global Racing Bicycles Revenue Breakdown (million, %) by Region 2025 & 2033
- Figure 2: Global Racing Bicycles Volume Breakdown (K, %) by Region 2025 & 2033
- Figure 3: North America Racing Bicycles Revenue (million), by Application 2025 & 2033
- Figure 4: North America Racing Bicycles Volume (K), by Application 2025 & 2033
- Figure 5: North America Racing Bicycles Revenue Share (%), by Application 2025 & 2033
- Figure 6: North America Racing Bicycles Volume Share (%), by Application 2025 & 2033
- Figure 7: North America Racing Bicycles Revenue (million), by Types 2025 & 2033
- Figure 8: North America Racing Bicycles Volume (K), by Types 2025 & 2033
- Figure 9: North America Racing Bicycles Revenue Share (%), by Types 2025 & 2033
- Figure 10: North America Racing Bicycles Volume Share (%), by Types 2025 & 2033
- Figure 11: North America Racing Bicycles Revenue (million), by Country 2025 & 2033
- Figure 12: North America Racing Bicycles Volume (K), by Country 2025 & 2033
- Figure 13: North America Racing Bicycles Revenue Share (%), by Country 2025 & 2033
- Figure 14: North America Racing Bicycles Volume Share (%), by Country 2025 & 2033
- Figure 15: South America Racing Bicycles Revenue (million), by Application 2025 & 2033
- Figure 16: South America Racing Bicycles Volume (K), by Application 2025 & 2033
- Figure 17: South America Racing Bicycles Revenue Share (%), by Application 2025 & 2033
- Figure 18: South America Racing Bicycles Volume Share (%), by Application 2025 & 2033
- Figure 19: South America Racing Bicycles Revenue (million), by Types 2025 & 2033
- Figure 20: South America Racing Bicycles Volume (K), by Types 2025 & 2033
- Figure 21: South America Racing Bicycles Revenue Share (%), by Types 2025 & 2033
- Figure 22: South America Racing Bicycles Volume Share (%), by Types 2025 & 2033
- Figure 23: South America Racing Bicycles Revenue (million), by Country 2025 & 2033
- Figure 24: South America Racing Bicycles Volume (K), by Country 2025 & 2033
- Figure 25: South America Racing Bicycles Revenue Share (%), by Country 2025 & 2033
- Figure 26: South America Racing Bicycles Volume Share (%), by Country 2025 & 2033
- Figure 27: Europe Racing Bicycles Revenue (million), by Application 2025 & 2033
- Figure 28: Europe Racing Bicycles Volume (K), by Application 2025 & 2033
- Figure 29: Europe Racing Bicycles Revenue Share (%), by Application 2025 & 2033
- Figure 30: Europe Racing Bicycles Volume Share (%), by Application 2025 & 2033
- Figure 31: Europe Racing Bicycles Revenue (million), by Types 2025 & 2033
- Figure 32: Europe Racing Bicycles Volume (K), by Types 2025 & 2033
- Figure 33: Europe Racing Bicycles Revenue Share (%), by Types 2025 & 2033
- Figure 34: Europe Racing Bicycles Volume Share (%), by Types 2025 & 2033
- Figure 35: Europe Racing Bicycles Revenue (million), by Country 2025 & 2033
- Figure 36: Europe Racing Bicycles Volume (K), by Country 2025 & 2033
- Figure 37: Europe Racing Bicycles Revenue Share (%), by Country 2025 & 2033
- Figure 38: Europe Racing Bicycles Volume Share (%), by Country 2025 & 2033
- Figure 39: Middle East & Africa Racing Bicycles Revenue (million), by Application 2025 & 2033
- Figure 40: Middle East & Africa Racing Bicycles Volume (K), by Application 2025 & 2033
- Figure 41: Middle East & Africa Racing Bicycles Revenue Share (%), by Application 2025 & 2033
- Figure 42: Middle East & Africa Racing Bicycles Volume Share (%), by Application 2025 & 2033
- Figure 43: Middle East & Africa Racing Bicycles Revenue (million), by Types 2025 & 2033
- Figure 44: Middle East & Africa Racing Bicycles Volume (K), by Types 2025 & 2033
- Figure 45: Middle East & Africa Racing Bicycles Revenue Share (%), by Types 2025 & 2033
- Figure 46: Middle East & Africa Racing Bicycles Volume Share (%), by Types 2025 & 2033
- Figure 47: Middle East & Africa Racing Bicycles Revenue (million), by Country 2025 & 2033
- Figure 48: Middle East & Africa Racing Bicycles Volume (K), by Country 2025 & 2033
- Figure 49: Middle East & Africa Racing Bicycles Revenue Share (%), by Country 2025 & 2033
- Figure 50: Middle East & Africa Racing Bicycles Volume Share (%), by Country 2025 & 2033
- Figure 51: Asia Pacific Racing Bicycles Revenue (million), by Application 2025 & 2033
- Figure 52: Asia Pacific Racing Bicycles Volume (K), by Application 2025 & 2033
- Figure 53: Asia Pacific Racing Bicycles Revenue Share (%), by Application 2025 & 2033
- Figure 54: Asia Pacific Racing Bicycles Volume Share (%), by Application 2025 & 2033
- Figure 55: Asia Pacific Racing Bicycles Revenue (million), by Types 2025 & 2033
- Figure 56: Asia Pacific Racing Bicycles Volume (K), by Types 2025 & 2033
- Figure 57: Asia Pacific Racing Bicycles Revenue Share (%), by Types 2025 & 2033
- Figure 58: Asia Pacific Racing Bicycles Volume Share (%), by Types 2025 & 2033
- Figure 59: Asia Pacific Racing Bicycles Revenue (million), by Country 2025 & 2033
- Figure 60: Asia Pacific Racing Bicycles Volume (K), by Country 2025 & 2033
- Figure 61: Asia Pacific Racing Bicycles Revenue Share (%), by Country 2025 & 2033
- Figure 62: Asia Pacific Racing Bicycles Volume Share (%), by Country 2025 & 2033
List of Tables
- Table 1: Global Racing Bicycles Revenue million Forecast, by Application 2020 & 2033
- Table 2: Global Racing Bicycles Volume K Forecast, by Application 2020 & 2033
- Table 3: Global Racing Bicycles Revenue million Forecast, by Types 2020 & 2033
- Table 4: Global Racing Bicycles Volume K Forecast, by Types 2020 & 2033
- Table 5: Global Racing Bicycles Revenue million Forecast, by Region 2020 & 2033
- Table 6: Global Racing Bicycles Volume K Forecast, by Region 2020 & 2033
- Table 7: Global Racing Bicycles Revenue million Forecast, by Application 2020 & 2033
- Table 8: Global Racing Bicycles Volume K Forecast, by Application 2020 & 2033
- Table 9: Global Racing Bicycles Revenue million Forecast, by Types 2020 & 2033
- Table 10: Global Racing Bicycles Volume K Forecast, by Types 2020 & 2033
- Table 11: Global Racing Bicycles Revenue million Forecast, by Country 2020 & 2033
- Table 12: Global Racing Bicycles Volume K Forecast, by Country 2020 & 2033
- Table 13: United States Racing Bicycles Revenue (million) Forecast, by Application 2020 & 2033
- Table 14: United States Racing Bicycles Volume (K) Forecast, by Application 2020 & 2033
- Table 15: Canada Racing Bicycles Revenue (million) Forecast, by Application 2020 & 2033
- Table 16: Canada Racing Bicycles Volume (K) Forecast, by Application 2020 & 2033
- Table 17: Mexico Racing Bicycles Revenue (million) Forecast, by Application 2020 & 2033
- Table 18: Mexico Racing Bicycles Volume (K) Forecast, by Application 2020 & 2033
- Table 19: Global Racing Bicycles Revenue million Forecast, by Application 2020 & 2033
- Table 20: Global Racing Bicycles Volume K Forecast, by Application 2020 & 2033
- Table 21: Global Racing Bicycles Revenue million Forecast, by Types 2020 & 2033
- Table 22: Global Racing Bicycles Volume K Forecast, by Types 2020 & 2033
- Table 23: Global Racing Bicycles Revenue million Forecast, by Country 2020 & 2033
- Table 24: Global Racing Bicycles Volume K Forecast, by Country 2020 & 2033
- Table 25: Brazil Racing Bicycles Revenue (million) Forecast, by Application 2020 & 2033
- Table 26: Brazil Racing Bicycles Volume (K) Forecast, by Application 2020 & 2033
- Table 27: Argentina Racing Bicycles Revenue (million) Forecast, by Application 2020 & 2033
- Table 28: Argentina Racing Bicycles Volume (K) Forecast, by Application 2020 & 2033
- Table 29: Rest of South America Racing Bicycles Revenue (million) Forecast, by Application 2020 & 2033
- Table 30: Rest of South America Racing Bicycles Volume (K) Forecast, by Application 2020 & 2033
- Table 31: Global Racing Bicycles Revenue million Forecast, by Application 2020 & 2033
- Table 32: Global Racing Bicycles Volume K Forecast, by Application 2020 & 2033
- Table 33: Global Racing Bicycles Revenue million Forecast, by Types 2020 & 2033
- Table 34: Global Racing Bicycles Volume K Forecast, by Types 2020 & 2033
- Table 35: Global Racing Bicycles Revenue million Forecast, by Country 2020 & 2033
- Table 36: Global Racing Bicycles Volume K Forecast, by Country 2020 & 2033
- Table 37: United Kingdom Racing Bicycles Revenue (million) Forecast, by Application 2020 & 2033
- Table 38: United Kingdom Racing Bicycles Volume (K) Forecast, by Application 2020 & 2033
- Table 39: Germany Racing Bicycles Revenue (million) Forecast, by Application 2020 & 2033
- Table 40: Germany Racing Bicycles Volume (K) Forecast, by Application 2020 & 2033
- Table 41: France Racing Bicycles Revenue (million) Forecast, by Application 2020 & 2033
- Table 42: France Racing Bicycles Volume (K) Forecast, by Application 2020 & 2033
- Table 43: Italy Racing Bicycles Revenue (million) Forecast, by Application 2020 & 2033
- Table 44: Italy Racing Bicycles Volume (K) Forecast, by Application 2020 & 2033
- Table 45: Spain Racing Bicycles Revenue (million) Forecast, by Application 2020 & 2033
- Table 46: Spain Racing Bicycles Volume (K) Forecast, by Application 2020 & 2033
- Table 47: Russia Racing Bicycles Revenue (million) Forecast, by Application 2020 & 2033
- Table 48: Russia Racing Bicycles Volume (K) Forecast, by Application 2020 & 2033
- Table 49: Benelux Racing Bicycles Revenue (million) Forecast, by Application 2020 & 2033
- Table 50: Benelux Racing Bicycles Volume (K) Forecast, by Application 2020 & 2033
- Table 51: Nordics Racing Bicycles Revenue (million) Forecast, by Application 2020 & 2033
- Table 52: Nordics Racing Bicycles Volume (K) Forecast, by Application 2020 & 2033
- Table 53: Rest of Europe Racing Bicycles Revenue (million) Forecast, by Application 2020 & 2033
- Table 54: Rest of Europe Racing Bicycles Volume (K) Forecast, by Application 2020 & 2033
- Table 55: Global Racing Bicycles Revenue million Forecast, by Application 2020 & 2033
- Table 56: Global Racing Bicycles Volume K Forecast, by Application 2020 & 2033
- Table 57: Global Racing Bicycles Revenue million Forecast, by Types 2020 & 2033
- Table 58: Global Racing Bicycles Volume K Forecast, by Types 2020 & 2033
- Table 59: Global Racing Bicycles Revenue million Forecast, by Country 2020 & 2033
- Table 60: Global Racing Bicycles Volume K Forecast, by Country 2020 & 2033
- Table 61: Turkey Racing Bicycles Revenue (million) Forecast, by Application 2020 & 2033
- Table 62: Turkey Racing Bicycles Volume (K) Forecast, by Application 2020 & 2033
- Table 63: Israel Racing Bicycles Revenue (million) Forecast, by Application 2020 & 2033
- Table 64: Israel Racing Bicycles Volume (K) Forecast, by Application 2020 & 2033
- Table 65: GCC Racing Bicycles Revenue (million) Forecast, by Application 2020 & 2033
- Table 66: GCC Racing Bicycles Volume (K) Forecast, by Application 2020 & 2033
- Table 67: North Africa Racing Bicycles Revenue (million) Forecast, by Application 2020 & 2033
- Table 68: North Africa Racing Bicycles Volume (K) Forecast, by Application 2020 & 2033
- Table 69: South Africa Racing Bicycles Revenue (million) Forecast, by Application 2020 & 2033
- Table 70: South Africa Racing Bicycles Volume (K) Forecast, by Application 2020 & 2033
- Table 71: Rest of Middle East & Africa Racing Bicycles Revenue (million) Forecast, by Application 2020 & 2033
- Table 72: Rest of Middle East & Africa Racing Bicycles Volume (K) Forecast, by Application 2020 & 2033
- Table 73: Global Racing Bicycles Revenue million Forecast, by Application 2020 & 2033
- Table 74: Global Racing Bicycles Volume K Forecast, by Application 2020 & 2033
- Table 75: Global Racing Bicycles Revenue million Forecast, by Types 2020 & 2033
- Table 76: Global Racing Bicycles Volume K Forecast, by Types 2020 & 2033
- Table 77: Global Racing Bicycles Revenue million Forecast, by Country 2020 & 2033
- Table 78: Global Racing Bicycles Volume K Forecast, by Country 2020 & 2033
- Table 79: China Racing Bicycles Revenue (million) Forecast, by Application 2020 & 2033
- Table 80: China Racing Bicycles Volume (K) Forecast, by Application 2020 & 2033
- Table 81: India Racing Bicycles Revenue (million) Forecast, by Application 2020 & 2033
- Table 82: India Racing Bicycles Volume (K) Forecast, by Application 2020 & 2033
- Table 83: Japan Racing Bicycles Revenue (million) Forecast, by Application 2020 & 2033
- Table 84: Japan Racing Bicycles Volume (K) Forecast, by Application 2020 & 2033
- Table 85: South Korea Racing Bicycles Revenue (million) Forecast, by Application 2020 & 2033
- Table 86: South Korea Racing Bicycles Volume (K) Forecast, by Application 2020 & 2033
- Table 87: ASEAN Racing Bicycles Revenue (million) Forecast, by Application 2020 & 2033
- Table 88: ASEAN Racing Bicycles Volume (K) Forecast, by Application 2020 & 2033
- Table 89: Oceania Racing Bicycles Revenue (million) Forecast, by Application 2020 & 2033
- Table 90: Oceania Racing Bicycles Volume (K) Forecast, by Application 2020 & 2033
- Table 91: Rest of Asia Pacific Racing Bicycles Revenue (million) Forecast, by Application 2020 & 2033
- Table 92: Rest of Asia Pacific Racing Bicycles Volume (K) Forecast, by Application 2020 & 2033
Frequently Asked Questions
1. What is the projected Compound Annual Growth Rate (CAGR) of the Racing Bicycles?
The projected CAGR is approximately XX%.
2. Which companies are prominent players in the Racing Bicycles?
Key companies in the market include Giant Bicycle, Merida Bike, Battle-FSD, Trek Bike, XDS, Shen Ying Biking, Look Cycle, Marmot Bike, Cube Bike, Colnago, SOLOMO, Kestrel Bicycles, Storck Bicycle, Tyrell Bicycle, De Rosa, DAHON, Pinarello, Canyon, Felt Cycles, Ellsworth Bike.
3. What are the main segments of the Racing Bicycles?
The market segments include Application, Types.
4. Can you provide details about the market size?
The market size is estimated to be USD XXX million as of 2022.
5. What are some drivers contributing to market growth?
N/A
6. What are the notable trends driving market growth?
N/A
7. Are there any restraints impacting market growth?
N/A
8. Can you provide examples of recent developments in the market?
N/A
9. What pricing options are available for accessing the report?
Pricing options include single-user, multi-user, and enterprise licenses priced at USD 3350.00, USD 5025.00, and USD 6700.00 respectively.
10. Is the market size provided in terms of value or volume?
The market size is provided in terms of value, measured in million and volume, measured in K.
11. Are there any specific market keywords associated with the report?
Yes, the market keyword associated with the report is "Racing Bicycles," which aids in identifying and referencing the specific market segment covered.
12. How do I determine which pricing option suits my needs best?
The pricing options vary based on user requirements and access needs. Individual users may opt for single-user licenses, while businesses requiring broader access may choose multi-user or enterprise licenses for cost-effective access to the report.
13. Are there any additional resources or data provided in the Racing Bicycles report?
While the report offers comprehensive insights, it's advisable to review the specific contents or supplementary materials provided to ascertain if additional resources or data are available.
14. How can I stay updated on further developments or reports in the Racing Bicycles?
To stay informed about further developments, trends, and reports in the Racing Bicycles, consider subscribing to industry newsletters, following relevant companies and organizations, or regularly checking reputable industry news sources and publications.
Methodology
Step 1 - Identification of Relevant Samples Size from Population Database


Step 2 - Approaches for Defining Global Market Size (Value, Volume* & Price*)

Note*: In applicable scenarios
Step 3 - Data Sources
Primary Research
- Web Analytics
- Survey Reports
- Research Institute
- Latest Research Reports
- Opinion Leaders
Secondary Research
- Annual Reports
- White Paper
- Latest Press Release
- Industry Association
- Paid Database
- Investor Presentations

Step 4 - Data Triangulation
Involves using different sources of information in order to increase the validity of a study
These sources are likely to be stakeholders in a program - participants, other researchers, program staff, other community members, and so on.
Then we put all data in single framework & apply various statistical tools to find out the dynamic on the market.
During the analysis stage, feedback from the stakeholder groups would be compared to determine areas of agreement as well as areas of divergence

