

Key Insights
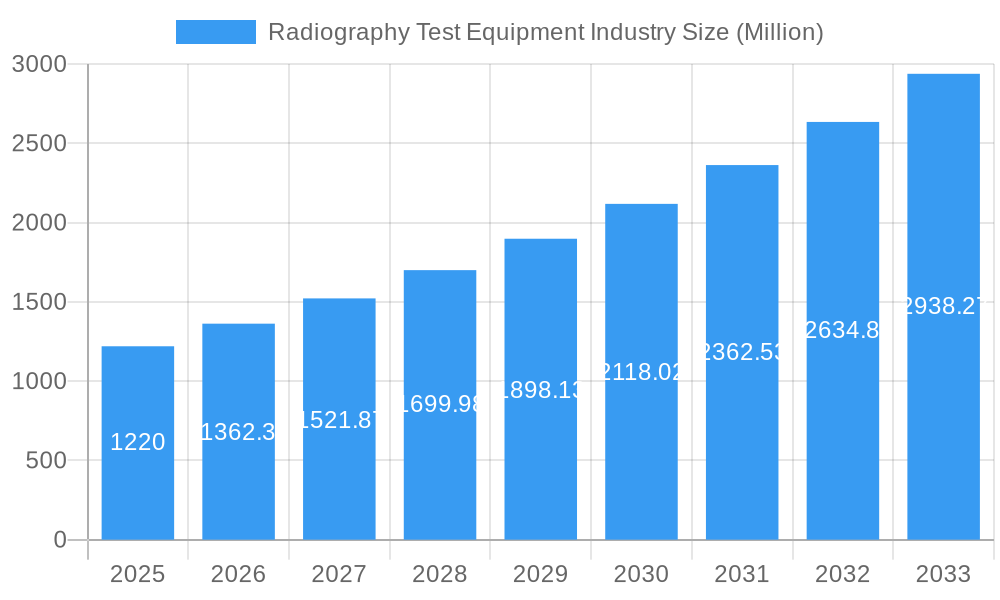
The global radiography test equipment market is experiencing robust growth, projected to reach $1.22 billion in 2025 and maintain a Compound Annual Growth Rate (CAGR) of 11.75% from 2025 to 2033. This expansion is driven by several key factors. Increased demand from diverse end-user verticals, including aerospace & defense (requiring stringent quality control), energy & power (for pipeline inspection and maintenance), and automotive (for non-destructive testing), fuels market growth. Advancements in technology, particularly the adoption of digital radiography (DR) and computed tomography (CT) systems offering improved image quality, faster processing times, and reduced radiation exposure, are significant drivers. Furthermore, stringent safety regulations across various industries necessitate frequent and reliable non-destructive testing, boosting the demand for advanced radiography equipment. Growth is also fueled by the increasing adoption of automated and portable systems enhancing efficiency and accessibility in diverse testing environments.
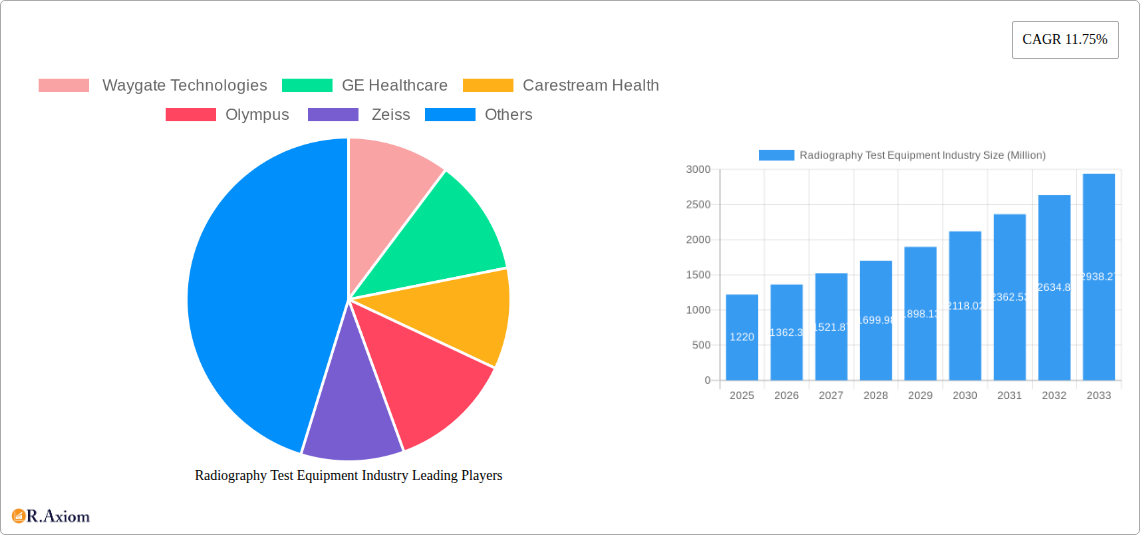
Radiography Test Equipment Industry Market Size (In Billion)
However, certain challenges exist. High initial investment costs associated with advanced radiography systems, especially CT scanners, can be a barrier to entry for smaller companies. Moreover, the need for skilled technicians to operate and interpret the complex imaging data can pose a limitation. Despite these restraints, the market is expected to demonstrate consistent growth driven by technological innovation, increasing regulatory compliance needs, and the expanding application of radiography in diverse industrial sectors. Geographical expansion, particularly in rapidly developing economies in Asia-Pacific and South America, presents significant opportunities for market players. The competitive landscape is characterized by both established industry giants like GE Healthcare and Carestream Health and innovative technology providers, leading to increased product differentiation and market penetration.
Radiography Test Equipment Industry Company Market Share
Radiography Test Equipment Industry Market Report: 2019-2033
This comprehensive report provides an in-depth analysis of the Radiography Test Equipment industry, offering valuable insights for stakeholders seeking to understand market dynamics, growth opportunities, and competitive landscapes. The report covers the period 2019-2033, with a focus on the estimated year 2025 and a forecast period of 2025-2033. The global market size is projected at xx Million in 2025 and is expected to reach xx Million by 2033, exhibiting a CAGR of xx% during the forecast period.
Radiography Test Equipment Industry Market Concentration & Innovation
The radiography test equipment market is characterized by a moderately concentrated structure, with a few prominent players holding a significant market share. Key industry leaders include GE Healthcare, Carestream Health, Olympus, Zeiss, Fujifilm, and SLB. While precise market share data remains proprietary, industry estimates suggest that the leading five companies collectively command approximately 60-70% of the global market. The sector's innovation is primarily propelled by advancements in digital radiography technologies, such as Computed Radiography (CR) and Direct Radiography (DR). Furthermore, the integration of artificial intelligence (AI) is playing an increasingly crucial role in enhancing image analysis capabilities and automating various processes. Market dynamics are also shaped by stringent regulatory frameworks, particularly those pertaining to radiation safety. Although alternative testing methods like ultrasonic testing and magnetic particle inspection exist, they often possess limitations in application scope when compared to the broad versatility offered by radiography. End-user trends are increasingly leaning towards non-destructive testing (NDT) solutions that demonstrably improve operational efficiency, reduce costs, and bolster safety standards. Mergers and acquisitions (M&A) activity in this space has been relatively measured in recent years, with deal values typically ranging from [Insert lower bound of M&A deal value range] to [Insert upper bound of M&A deal value range] Million, often driven by strategic objectives to broaden product portfolios and expand geographical footprints.
Radiography Test Equipment Industry Industry Trends & Insights
The radiography test equipment market is experiencing robust growth, propelled by increasing demand across various end-user verticals. The rising adoption of advanced imaging technologies, such as Computed Tomography (CT) and DR, is a key driver. The integration of AI and machine learning algorithms for enhanced image processing and automated defect detection is further transforming the industry. Consumer preferences lean toward portable, user-friendly systems that offer high-resolution images and reduced examination times. The competitive landscape is characterized by intense rivalry among established players and emerging companies focused on innovative technologies and niche applications. This competitiveness is fostering continuous innovation, driving down prices, and improving the overall quality of radiography equipment. The market penetration of DR technology is steadily increasing, surpassing CR in many sectors. The global market for radiography test equipment is anticipated to maintain a robust growth trajectory, exceeding xx Million by 2033, with a projected CAGR of approximately xx%.
Dominant Markets & Segments in Radiography Test Equipment Industry
Leading Region/Country: North America and Europe currently lead the radiography test equipment market, primarily due to their robust industrial activity, stringent safety regulations, and well-established NDT infrastructure. The Asia-Pacific region is witnessing accelerated growth, driven by significant industrial expansion and substantial investments in infrastructure development.
Dominant Technology Segment: Direct Radiography (DR) is emerging as the fastest-growing technology segment, increasingly superseding Computed Radiography (CR) owing to its superior image quality, rapid processing capabilities, and reduced operational expenditures. Computed Tomography (CT) maintains a strong market presence, especially in specialized applications. Film Radiography, while less prevalent, continues to serve niche applications.
Dominant End-User Vertical: The Aerospace & Defense, Energy & Power, and Automotive sectors are significant consumers of radiography test equipment, owing to their exacting quality control mandates and stringent safety regulations. The broader manufacturing industry also contributes substantially to the overall market demand.
Key Drivers: The market's growth is propelled by a confluence of factors, including the stringent quality control requirements across diverse industries, continuous advancements in imaging technologies, escalating infrastructure development initiatives (exemplified by the Indian government's INR 111 crore National Infrastructure Pipeline and Ford's USD 1.05 billion investment in South Africa), and a growing demand for efficient non-destructive testing solutions. Furthermore, government regulations emphasizing safety and quality standards act as significant catalysts for market expansion.
Radiography Test Equipment Industry Product Developments
Recent product innovations include the development of portable and wireless DR systems, enhancing flexibility and accessibility in diverse testing environments. Advancements in detector technology have improved image resolution, reducing the need for repeated examinations and improving diagnostic accuracy. The integration of AI-powered image analysis software automates defect detection and provides more reliable results, significantly enhancing efficiency and reducing human error. These advancements are improving market fit by addressing the growing demand for faster, more accurate, and cost-effective NDT solutions.
Report Scope & Segmentation Analysis
This comprehensive report provides an in-depth analysis of the Radiography Test Equipment market, segmented by key parameters including technology (Film Radiography, Computed Radiography, Direct Radiography, Computed Tomography) and end-user vertical (Aerospace and Defense, Energy and Power, Construction, Oil and Gas, Automotive, Manufacturing, Other End-user Industries). For each segment, the report meticulously examines market size, projected growth trajectories, and competitive landscapes, thereby offering valuable insights into prevailing market trends and identifying future opportunities. Growth projections are observed to vary significantly across these segments, with Direct Radiography (DR) and Computed Tomography (CT) exhibiting the most robust expansion rates.
Key Drivers of Radiography Test Equipment Industry Growth
Technological advancements, such as improved detector technology, AI-powered image analysis, and portable systems, are primary growth drivers. The rising demand for non-destructive testing (NDT) in various industries, driven by stringent quality control requirements and safety regulations, fuels market expansion. Economic factors, including infrastructural development and industrial growth, significantly influence market demand, as exemplified by recent investments in infrastructure projects globally.
Challenges in the Radiography Test Equipment Industry Sector
The radiography test equipment industry faces challenges including the high initial investment cost of advanced systems, stringent regulatory requirements impacting product development and deployment, and the potential for supply chain disruptions affecting component availability. The intense competition from both established and emerging players further adds to the complexities of market penetration. These challenges collectively influence market growth rates.
Emerging Opportunities in Radiography Test Equipment Industry
Emerging opportunities lie in the growing adoption of AI and machine learning for automated defect detection, the development of portable and user-friendly systems, and the expansion into new markets, especially in developing economies undergoing rapid industrialization. The integration of advanced data analytics for predictive maintenance and enhanced efficiency also presents significant potential.
Leading Players in the Radiography Test Equipment Industry Market
- Waygate Technologies
- GE Healthcare
- Carestream Health
- Olympus
- Zeiss
- Fujifilm
- SLB
- Nikon Metrology
- Hexagon
- TeraRecon
Key Developments in Radiography Test Equipment Industry Industry
- August 2020: The Indian government's ambitious INR 111 crore National Infrastructure Pipeline, encompassing over 6,835 projects, is anticipated to significantly boost the demand for radiography equipment across the construction and allied industrial sectors.
- February 2021: Ford Motor Co.'s substantial USD 1.05 billion investment in its South African manufacturing operations signifies an anticipated surge in the demand for advanced quality control equipment, including sophisticated radiography systems, within the automotive sector.
Strategic Outlook for Radiography Test Equipment Industry Market
The radiography test equipment market is poised for continued growth, driven by technological advancements, increasing demand across various industries, and investments in infrastructure. The integration of AI and the development of user-friendly, portable systems will further shape market dynamics. Companies focusing on innovation, strategic partnerships, and expansion into new markets are well-positioned to capitalize on future growth opportunities.
Radiography Test Equipment Industry Segmentation
-
1. Technology
- 1.1. Film Radiography
- 1.2. Computed Radiography
- 1.3. Direct Radiography
- 1.4. Computed Tomography
-
2. End-user Vertical
- 2.1. Aerospace and Defense
- 2.2. Energy and Power
- 2.3. Construction
- 2.4. Oil and Gas
- 2.5. Automotive
- 2.6. Manufacturing
- 2.7. Other End-user Industries
Radiography Test Equipment Industry Segmentation By Geography
- 1. North America
- 2. Europe
- 3. Asia Pacific
- 4. Latin America
- 5. Middle East
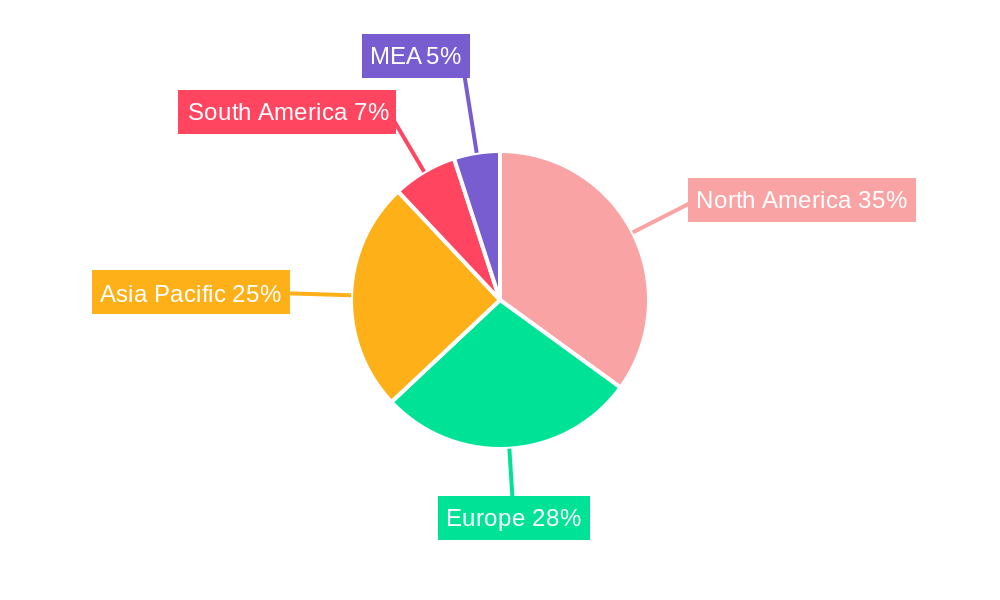
Radiography Test Equipment Industry Regional Market Share
Geographic Coverage of Radiography Test Equipment Industry
Radiography Test Equipment Industry REPORT HIGHLIGHTS
| Aspects | Details |
|---|---|
| Study Period | 2020-2034 |
| Base Year | 2025 |
| Estimated Year | 2026 |
| Forecast Period | 2026-2034 |
| Historical Period | 2020-2025 |
| Growth Rate | CAGR of 11.75% from 2020-2034 |
| Segmentation |
|
Table of Contents
- 1. Introduction
- 1.1. Research Scope
- 1.2. Market Segmentation
- 1.3. Research Objective
- 1.4. Definitions and Assumptions
- 2. Executive Summary
- 2.1. Market Snapshot
- 3. Market Dynamics
- 3.1. Market Drivers
- 3.2. Market Restrains
- 3.3. Market Trends
- 3.4. Market Opportunities
- 4. Market Factor Analysis
- 4.1. Porters Five Forces
- 4.1.1. Bargaining Power of Suppliers
- 4.1.2. Bargaining Power of Buyers
- 4.1.3. Threat of New Entrants
- 4.1.4. Threat of Substitutes
- 4.1.5. Competitive Rivalry
- 4.2. PESTEL analysis
- 4.3. BCG Analysis
- 4.3.1. Stars (High Growth, High Market Share)
- 4.3.2. Cash Cows (Low Growth, High Market Share)
- 4.3.3. Question Mark (High Growth, Low Market Share)
- 4.3.4. Dogs (Low Growth, Low Market Share)
- 4.4. Ansoff Matrix Analysis
- 4.5. Supply Chain Analysis
- 4.6. Regulatory Landscape
- 4.7. Current Market Potential and Opportunity Assessment (TAM–SAM–SOM Framework)
- 4.8. RAX Analyst Note
- 4.1. Porters Five Forces
- 5. Market Analysis, Insights and Forecast 2021-2033
- 5.1. Market Analysis, Insights and Forecast - by Technology
- 5.1.1. Film Radiography
- 5.1.2. Computed Radiography
- 5.1.3. Direct Radiography
- 5.1.4. Computed Tomography
- 5.2. Market Analysis, Insights and Forecast - by End-user Vertical
- 5.2.1. Aerospace and Defense
- 5.2.2. Energy and Power
- 5.2.3. Construction
- 5.2.4. Oil and Gas
- 5.2.5. Automotive
- 5.2.6. Manufacturing
- 5.2.7. Other End-user Industries
- 5.3. Market Analysis, Insights and Forecast - by Region
- 5.3.1. North America
- 5.3.2. Europe
- 5.3.3. Asia Pacific
- 5.3.4. Latin America
- 5.3.5. Middle East
- 5.1. Market Analysis, Insights and Forecast - by Technology
- 6. Global Radiography Test Equipment Industry Analysis, Insights and Forecast, 2021-2033
- 6.1. Market Analysis, Insights and Forecast - by Technology
- 6.1.1. Film Radiography
- 6.1.2. Computed Radiography
- 6.1.3. Direct Radiography
- 6.1.4. Computed Tomography
- 6.2. Market Analysis, Insights and Forecast - by End-user Vertical
- 6.2.1. Aerospace and Defense
- 6.2.2. Energy and Power
- 6.2.3. Construction
- 6.2.4. Oil and Gas
- 6.2.5. Automotive
- 6.2.6. Manufacturing
- 6.2.7. Other End-user Industries
- 6.1. Market Analysis, Insights and Forecast - by Technology
- 7. North America Radiography Test Equipment Industry Analysis, Insights and Forecast, 2020-2032
- 7.1. Market Analysis, Insights and Forecast - by Technology
- 7.1.1. Film Radiography
- 7.1.2. Computed Radiography
- 7.1.3. Direct Radiography
- 7.1.4. Computed Tomography
- 7.2. Market Analysis, Insights and Forecast - by End-user Vertical
- 7.2.1. Aerospace and Defense
- 7.2.2. Energy and Power
- 7.2.3. Construction
- 7.2.4. Oil and Gas
- 7.2.5. Automotive
- 7.2.6. Manufacturing
- 7.2.7. Other End-user Industries
- 7.1. Market Analysis, Insights and Forecast - by Technology
- 8. Europe Radiography Test Equipment Industry Analysis, Insights and Forecast, 2020-2032
- 8.1. Market Analysis, Insights and Forecast - by Technology
- 8.1.1. Film Radiography
- 8.1.2. Computed Radiography
- 8.1.3. Direct Radiography
- 8.1.4. Computed Tomography
- 8.2. Market Analysis, Insights and Forecast - by End-user Vertical
- 8.2.1. Aerospace and Defense
- 8.2.2. Energy and Power
- 8.2.3. Construction
- 8.2.4. Oil and Gas
- 8.2.5. Automotive
- 8.2.6. Manufacturing
- 8.2.7. Other End-user Industries
- 8.1. Market Analysis, Insights and Forecast - by Technology
- 9. Asia Pacific Radiography Test Equipment Industry Analysis, Insights and Forecast, 2020-2032
- 9.1. Market Analysis, Insights and Forecast - by Technology
- 9.1.1. Film Radiography
- 9.1.2. Computed Radiography
- 9.1.3. Direct Radiography
- 9.1.4. Computed Tomography
- 9.2. Market Analysis, Insights and Forecast - by End-user Vertical
- 9.2.1. Aerospace and Defense
- 9.2.2. Energy and Power
- 9.2.3. Construction
- 9.2.4. Oil and Gas
- 9.2.5. Automotive
- 9.2.6. Manufacturing
- 9.2.7. Other End-user Industries
- 9.1. Market Analysis, Insights and Forecast - by Technology
- 10. Latin America Radiography Test Equipment Industry Analysis, Insights and Forecast, 2020-2032
- 10.1. Market Analysis, Insights and Forecast - by Technology
- 10.1.1. Film Radiography
- 10.1.2. Computed Radiography
- 10.1.3. Direct Radiography
- 10.1.4. Computed Tomography
- 10.2. Market Analysis, Insights and Forecast - by End-user Vertical
- 10.2.1. Aerospace and Defense
- 10.2.2. Energy and Power
- 10.2.3. Construction
- 10.2.4. Oil and Gas
- 10.2.5. Automotive
- 10.2.6. Manufacturing
- 10.2.7. Other End-user Industries
- 10.1. Market Analysis, Insights and Forecast - by Technology
- 11. Middle East Radiography Test Equipment Industry Analysis, Insights and Forecast, 2020-2032
- 11.1. Market Analysis, Insights and Forecast - by Technology
- 11.1.1. Film Radiography
- 11.1.2. Computed Radiography
- 11.1.3. Direct Radiography
- 11.1.4. Computed Tomography
- 11.2. Market Analysis, Insights and Forecast - by End-user Vertical
- 11.2.1. Aerospace and Defense
- 11.2.2. Energy and Power
- 11.2.3. Construction
- 11.2.4. Oil and Gas
- 11.2.5. Automotive
- 11.2.6. Manufacturing
- 11.2.7. Other End-user Industries
- 11.1. Market Analysis, Insights and Forecast - by Technology
- 12. Competitive Analysis
- 12.1. Company Profiles
- 12.1.1 Waygate Technologies
- 12.1.1.1. Company Overview
- 12.1.1.2. Products
- 12.1.1.3. Company Financials
- 12.1.1.4. SWOT Analysis
- 12.1.2 GE Healthcare
- 12.1.2.1. Company Overview
- 12.1.2.2. Products
- 12.1.2.3. Company Financials
- 12.1.2.4. SWOT Analysis
- 12.1.3 Carestream Health
- 12.1.3.1. Company Overview
- 12.1.3.2. Products
- 12.1.3.3. Company Financials
- 12.1.3.4. SWOT Analysis
- 12.1.4 Olympus
- 12.1.4.1. Company Overview
- 12.1.4.2. Products
- 12.1.4.3. Company Financials
- 12.1.4.4. SWOT Analysis
- 12.1.5 Zeiss
- 12.1.5.1. Company Overview
- 12.1.5.2. Products
- 12.1.5.3. Company Financials
- 12.1.5.4. SWOT Analysis
- 12.1.6 Fujifilm
- 12.1.6.1. Company Overview
- 12.1.6.2. Products
- 12.1.6.3. Company Financials
- 12.1.6.4. SWOT Analysis
- 12.1.7 SLB
- 12.1.7.1. Company Overview
- 12.1.7.2. Products
- 12.1.7.3. Company Financials
- 12.1.7.4. SWOT Analysis
- 12.1.8 Nikon Metrology
- 12.1.8.1. Company Overview
- 12.1.8.2. Products
- 12.1.8.3. Company Financials
- 12.1.8.4. SWOT Analysis
- 12.1.9 Hexagon
- 12.1.9.1. Company Overview
- 12.1.9.2. Products
- 12.1.9.3. Company Financials
- 12.1.9.4. SWOT Analysis
- 12.1.10 TeraRecon
- 12.1.10.1. Company Overview
- 12.1.10.2. Products
- 12.1.10.3. Company Financials
- 12.1.10.4. SWOT Analysis
- 12.1.1 Waygate Technologies
- 12.2. Market Entropy
- 12.2.1 Company's Key Areas Served
- 12.2.2 Recent Developments
- 12.3. Company Market Share Analysis 2025
- 12.3.1 Top 5 Companies Market Share Analysis
- 12.3.2 Top 3 Companies Market Share Analysis
- 12.4. List of Potential Customers
- 13. Research Methodology
List of Figures
- Figure 1: Global Radiography Test Equipment Industry Revenue Breakdown (Million, %) by Region 2025 & 2033
- Figure 2: Global Radiography Test Equipment Industry Volume Breakdown (K Units, %) by Region 2025 & 2033
- Figure 3: North America Radiography Test Equipment Industry Revenue (Million), by Technology 2025 & 2033
- Figure 4: North America Radiography Test Equipment Industry Volume (K Units), by Technology 2025 & 2033
- Figure 5: North America Radiography Test Equipment Industry Revenue Share (%), by Technology 2025 & 2033
- Figure 6: North America Radiography Test Equipment Industry Volume Share (%), by Technology 2025 & 2033
- Figure 7: North America Radiography Test Equipment Industry Revenue (Million), by End-user Vertical 2025 & 2033
- Figure 8: North America Radiography Test Equipment Industry Volume (K Units), by End-user Vertical 2025 & 2033
- Figure 9: North America Radiography Test Equipment Industry Revenue Share (%), by End-user Vertical 2025 & 2033
- Figure 10: North America Radiography Test Equipment Industry Volume Share (%), by End-user Vertical 2025 & 2033
- Figure 11: North America Radiography Test Equipment Industry Revenue (Million), by Country 2025 & 2033
- Figure 12: North America Radiography Test Equipment Industry Volume (K Units), by Country 2025 & 2033
- Figure 13: North America Radiography Test Equipment Industry Revenue Share (%), by Country 2025 & 2033
- Figure 14: North America Radiography Test Equipment Industry Volume Share (%), by Country 2025 & 2033
- Figure 15: Europe Radiography Test Equipment Industry Revenue (Million), by Technology 2025 & 2033
- Figure 16: Europe Radiography Test Equipment Industry Volume (K Units), by Technology 2025 & 2033
- Figure 17: Europe Radiography Test Equipment Industry Revenue Share (%), by Technology 2025 & 2033
- Figure 18: Europe Radiography Test Equipment Industry Volume Share (%), by Technology 2025 & 2033
- Figure 19: Europe Radiography Test Equipment Industry Revenue (Million), by End-user Vertical 2025 & 2033
- Figure 20: Europe Radiography Test Equipment Industry Volume (K Units), by End-user Vertical 2025 & 2033
- Figure 21: Europe Radiography Test Equipment Industry Revenue Share (%), by End-user Vertical 2025 & 2033
- Figure 22: Europe Radiography Test Equipment Industry Volume Share (%), by End-user Vertical 2025 & 2033
- Figure 23: Europe Radiography Test Equipment Industry Revenue (Million), by Country 2025 & 2033
- Figure 24: Europe Radiography Test Equipment Industry Volume (K Units), by Country 2025 & 2033
- Figure 25: Europe Radiography Test Equipment Industry Revenue Share (%), by Country 2025 & 2033
- Figure 26: Europe Radiography Test Equipment Industry Volume Share (%), by Country 2025 & 2033
- Figure 27: Asia Pacific Radiography Test Equipment Industry Revenue (Million), by Technology 2025 & 2033
- Figure 28: Asia Pacific Radiography Test Equipment Industry Volume (K Units), by Technology 2025 & 2033
- Figure 29: Asia Pacific Radiography Test Equipment Industry Revenue Share (%), by Technology 2025 & 2033
- Figure 30: Asia Pacific Radiography Test Equipment Industry Volume Share (%), by Technology 2025 & 2033
- Figure 31: Asia Pacific Radiography Test Equipment Industry Revenue (Million), by End-user Vertical 2025 & 2033
- Figure 32: Asia Pacific Radiography Test Equipment Industry Volume (K Units), by End-user Vertical 2025 & 2033
- Figure 33: Asia Pacific Radiography Test Equipment Industry Revenue Share (%), by End-user Vertical 2025 & 2033
- Figure 34: Asia Pacific Radiography Test Equipment Industry Volume Share (%), by End-user Vertical 2025 & 2033
- Figure 35: Asia Pacific Radiography Test Equipment Industry Revenue (Million), by Country 2025 & 2033
- Figure 36: Asia Pacific Radiography Test Equipment Industry Volume (K Units), by Country 2025 & 2033
- Figure 37: Asia Pacific Radiography Test Equipment Industry Revenue Share (%), by Country 2025 & 2033
- Figure 38: Asia Pacific Radiography Test Equipment Industry Volume Share (%), by Country 2025 & 2033
- Figure 39: Latin America Radiography Test Equipment Industry Revenue (Million), by Technology 2025 & 2033
- Figure 40: Latin America Radiography Test Equipment Industry Volume (K Units), by Technology 2025 & 2033
- Figure 41: Latin America Radiography Test Equipment Industry Revenue Share (%), by Technology 2025 & 2033
- Figure 42: Latin America Radiography Test Equipment Industry Volume Share (%), by Technology 2025 & 2033
- Figure 43: Latin America Radiography Test Equipment Industry Revenue (Million), by End-user Vertical 2025 & 2033
- Figure 44: Latin America Radiography Test Equipment Industry Volume (K Units), by End-user Vertical 2025 & 2033
- Figure 45: Latin America Radiography Test Equipment Industry Revenue Share (%), by End-user Vertical 2025 & 2033
- Figure 46: Latin America Radiography Test Equipment Industry Volume Share (%), by End-user Vertical 2025 & 2033
- Figure 47: Latin America Radiography Test Equipment Industry Revenue (Million), by Country 2025 & 2033
- Figure 48: Latin America Radiography Test Equipment Industry Volume (K Units), by Country 2025 & 2033
- Figure 49: Latin America Radiography Test Equipment Industry Revenue Share (%), by Country 2025 & 2033
- Figure 50: Latin America Radiography Test Equipment Industry Volume Share (%), by Country 2025 & 2033
- Figure 51: Middle East Radiography Test Equipment Industry Revenue (Million), by Technology 2025 & 2033
- Figure 52: Middle East Radiography Test Equipment Industry Volume (K Units), by Technology 2025 & 2033
- Figure 53: Middle East Radiography Test Equipment Industry Revenue Share (%), by Technology 2025 & 2033
- Figure 54: Middle East Radiography Test Equipment Industry Volume Share (%), by Technology 2025 & 2033
- Figure 55: Middle East Radiography Test Equipment Industry Revenue (Million), by End-user Vertical 2025 & 2033
- Figure 56: Middle East Radiography Test Equipment Industry Volume (K Units), by End-user Vertical 2025 & 2033
- Figure 57: Middle East Radiography Test Equipment Industry Revenue Share (%), by End-user Vertical 2025 & 2033
- Figure 58: Middle East Radiography Test Equipment Industry Volume Share (%), by End-user Vertical 2025 & 2033
- Figure 59: Middle East Radiography Test Equipment Industry Revenue (Million), by Country 2025 & 2033
- Figure 60: Middle East Radiography Test Equipment Industry Volume (K Units), by Country 2025 & 2033
- Figure 61: Middle East Radiography Test Equipment Industry Revenue Share (%), by Country 2025 & 2033
- Figure 62: Middle East Radiography Test Equipment Industry Volume Share (%), by Country 2025 & 2033
List of Tables
- Table 1: Global Radiography Test Equipment Industry Revenue Million Forecast, by Technology 2020 & 2033
- Table 2: Global Radiography Test Equipment Industry Volume K Units Forecast, by Technology 2020 & 2033
- Table 3: Global Radiography Test Equipment Industry Revenue Million Forecast, by End-user Vertical 2020 & 2033
- Table 4: Global Radiography Test Equipment Industry Volume K Units Forecast, by End-user Vertical 2020 & 2033
- Table 5: Global Radiography Test Equipment Industry Revenue Million Forecast, by Region 2020 & 2033
- Table 6: Global Radiography Test Equipment Industry Volume K Units Forecast, by Region 2020 & 2033
- Table 7: Global Radiography Test Equipment Industry Revenue Million Forecast, by Technology 2020 & 2033
- Table 8: Global Radiography Test Equipment Industry Volume K Units Forecast, by Technology 2020 & 2033
- Table 9: Global Radiography Test Equipment Industry Revenue Million Forecast, by End-user Vertical 2020 & 2033
- Table 10: Global Radiography Test Equipment Industry Volume K Units Forecast, by End-user Vertical 2020 & 2033
- Table 11: Global Radiography Test Equipment Industry Revenue Million Forecast, by Country 2020 & 2033
- Table 12: Global Radiography Test Equipment Industry Volume K Units Forecast, by Country 2020 & 2033
- Table 13: Global Radiography Test Equipment Industry Revenue Million Forecast, by Technology 2020 & 2033
- Table 14: Global Radiography Test Equipment Industry Volume K Units Forecast, by Technology 2020 & 2033
- Table 15: Global Radiography Test Equipment Industry Revenue Million Forecast, by End-user Vertical 2020 & 2033
- Table 16: Global Radiography Test Equipment Industry Volume K Units Forecast, by End-user Vertical 2020 & 2033
- Table 17: Global Radiography Test Equipment Industry Revenue Million Forecast, by Country 2020 & 2033
- Table 18: Global Radiography Test Equipment Industry Volume K Units Forecast, by Country 2020 & 2033
- Table 19: Global Radiography Test Equipment Industry Revenue Million Forecast, by Technology 2020 & 2033
- Table 20: Global Radiography Test Equipment Industry Volume K Units Forecast, by Technology 2020 & 2033
- Table 21: Global Radiography Test Equipment Industry Revenue Million Forecast, by End-user Vertical 2020 & 2033
- Table 22: Global Radiography Test Equipment Industry Volume K Units Forecast, by End-user Vertical 2020 & 2033
- Table 23: Global Radiography Test Equipment Industry Revenue Million Forecast, by Country 2020 & 2033
- Table 24: Global Radiography Test Equipment Industry Volume K Units Forecast, by Country 2020 & 2033
- Table 25: Global Radiography Test Equipment Industry Revenue Million Forecast, by Technology 2020 & 2033
- Table 26: Global Radiography Test Equipment Industry Volume K Units Forecast, by Technology 2020 & 2033
- Table 27: Global Radiography Test Equipment Industry Revenue Million Forecast, by End-user Vertical 2020 & 2033
- Table 28: Global Radiography Test Equipment Industry Volume K Units Forecast, by End-user Vertical 2020 & 2033
- Table 29: Global Radiography Test Equipment Industry Revenue Million Forecast, by Country 2020 & 2033
- Table 30: Global Radiography Test Equipment Industry Volume K Units Forecast, by Country 2020 & 2033
- Table 31: Global Radiography Test Equipment Industry Revenue Million Forecast, by Technology 2020 & 2033
- Table 32: Global Radiography Test Equipment Industry Volume K Units Forecast, by Technology 2020 & 2033
- Table 33: Global Radiography Test Equipment Industry Revenue Million Forecast, by End-user Vertical 2020 & 2033
- Table 34: Global Radiography Test Equipment Industry Volume K Units Forecast, by End-user Vertical 2020 & 2033
- Table 35: Global Radiography Test Equipment Industry Revenue Million Forecast, by Country 2020 & 2033
- Table 36: Global Radiography Test Equipment Industry Volume K Units Forecast, by Country 2020 & 2033
Frequently Asked Questions
1. What is the projected Compound Annual Growth Rate (CAGR) of the Radiography Test Equipment Industry?
The projected CAGR is approximately 11.75%.
2. Which companies are prominent players in the Radiography Test Equipment Industry?
Key companies in the market include Waygate Technologies, GE Healthcare, Carestream Health, Olympus , Zeiss, Fujifilm, SLB, Nikon Metrology , Hexagon, TeraRecon.
3. What are the main segments of the Radiography Test Equipment Industry?
The market segments include Technology, End-user Vertical.
4. Can you provide details about the market size?
The market size is estimated to be USD 1.22 Million as of 2022.
5. What are some drivers contributing to market growth?
Advent of Portable Radiography Equipment.
6. What are the notable trends driving market growth?
Application in Aerospace to Account for a Significant Portion of the Market Demand.
7. Are there any restraints impacting market growth?
Rising Privacy and Security Concerns.
8. Can you provide examples of recent developments in the market?
August 2020 - The Indian government identified and listed 6,835 projects under its INR 111 crore National Infrastructure Pipeline to attract investments in infrastructure development.
9. What pricing options are available for accessing the report?
Pricing options include single-user, multi-user, and enterprise licenses priced at USD 4750, USD 5250, and USD 8750 respectively.
10. Is the market size provided in terms of value or volume?
The market size is provided in terms of value, measured in Million and volume, measured in K Units.
11. Are there any specific market keywords associated with the report?
Yes, the market keyword associated with the report is "Radiography Test Equipment Industry," which aids in identifying and referencing the specific market segment covered.
12. How do I determine which pricing option suits my needs best?
The pricing options vary based on user requirements and access needs. Individual users may opt for single-user licenses, while businesses requiring broader access may choose multi-user or enterprise licenses for cost-effective access to the report.
13. Are there any additional resources or data provided in the Radiography Test Equipment Industry report?
While the report offers comprehensive insights, it's advisable to review the specific contents or supplementary materials provided to ascertain if additional resources or data are available.
14. How can I stay updated on further developments or reports in the Radiography Test Equipment Industry?
To stay informed about further developments, trends, and reports in the Radiography Test Equipment Industry, consider subscribing to industry newsletters, following relevant companies and organizations, or regularly checking reputable industry news sources and publications.
Methodology
Step 1 - Identification of Relevant Samples Size from Population Database


Step 2 - Approaches for Defining Global Market Size (Value, Volume* & Price*)

Note*: In applicable scenarios
Step 3 - Data Sources
Primary Research
- Web Analytics
- Survey Reports
- Research Institute
- Latest Research Reports
- Opinion Leaders
Secondary Research
- Annual Reports
- White Paper
- Latest Press Release
- Industry Association
- Paid Database
- Investor Presentations

Step 4 - Data Triangulation
Involves using different sources of information in order to increase the validity of a study
These sources are likely to be stakeholders in a program - participants, other researchers, program staff, other community members, and so on.
Then we put all data in single framework & apply various statistical tools to find out the dynamic on the market.
During the analysis stage, feedback from the stakeholder groups would be compared to determine areas of agreement as well as areas of divergence