Key Insights
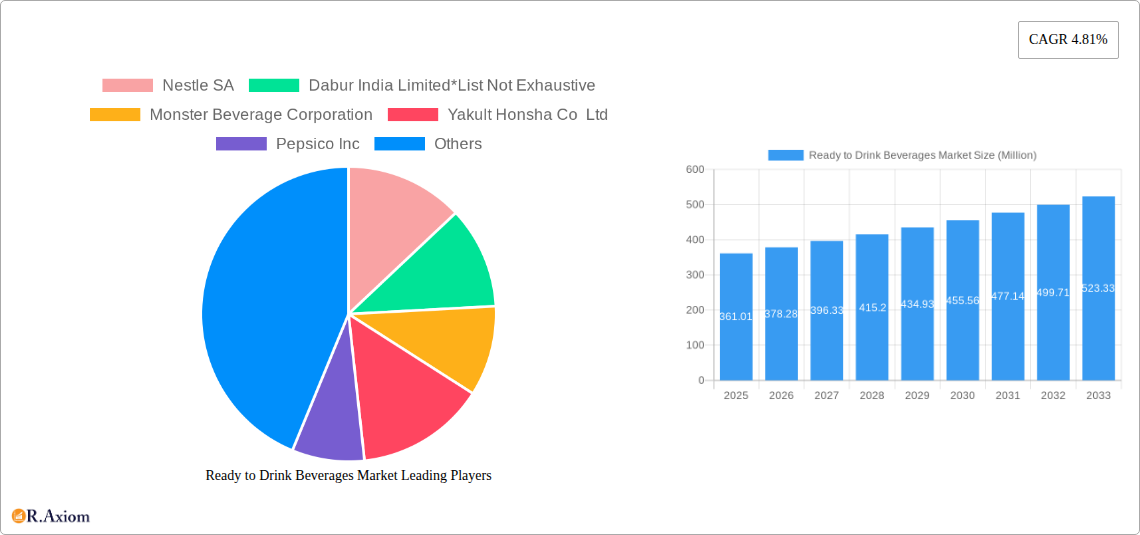
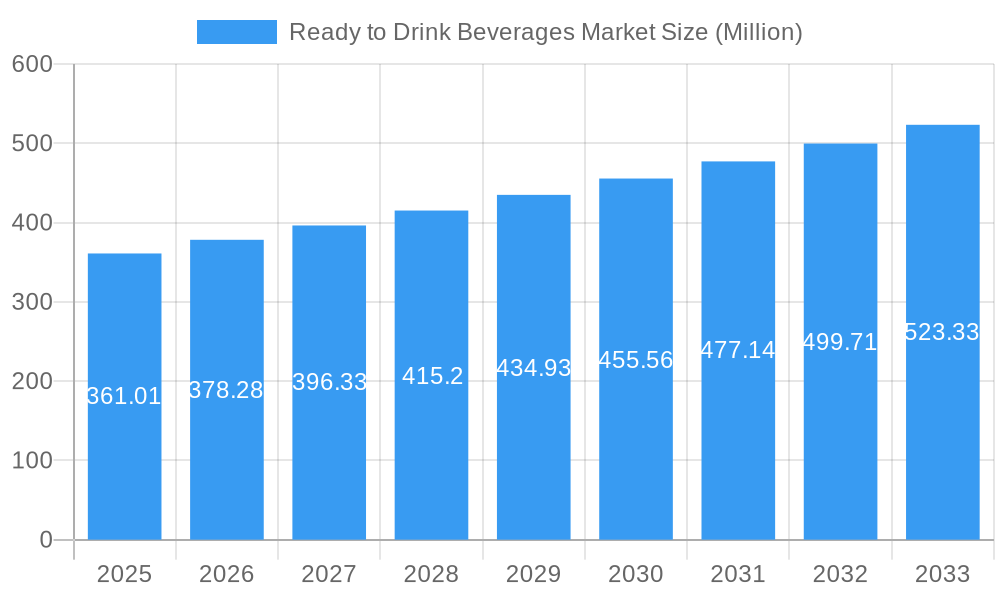
The Ready-to-Drink (RTD) beverages market, valued at $361.01 million in 2025, is projected to experience robust growth, driven by several key factors. The rising demand for convenient and on-the-go consumption options, particularly among young adults and busy professionals, significantly fuels market expansion. Health-conscious consumers are increasingly seeking healthier alternatives, leading to a surge in demand for products like flavored and fortified water, yogurt drinks, and dairy and dairy-alternative beverages. The market's segmentation reflects this trend, with tea, coffee, and energy drinks continuing to hold significant shares, while healthier options are witnessing accelerated growth. Successful brands leverage innovative product development, including functional beverages with added vitamins or antioxidants, and strategic partnerships with retailers to expand distribution channels. The increasing adoption of e-commerce and online grocery shopping further contributes to market growth. However, fluctuating raw material prices and increasing health concerns regarding high sugar content in some RTD beverages pose challenges to market expansion. Despite these restraints, the projected Compound Annual Growth Rate (CAGR) of 4.81% from 2025 to 2033 suggests a positive outlook for the RTD beverage industry.
Ready to Drink Beverages Market Market Size (In Million)
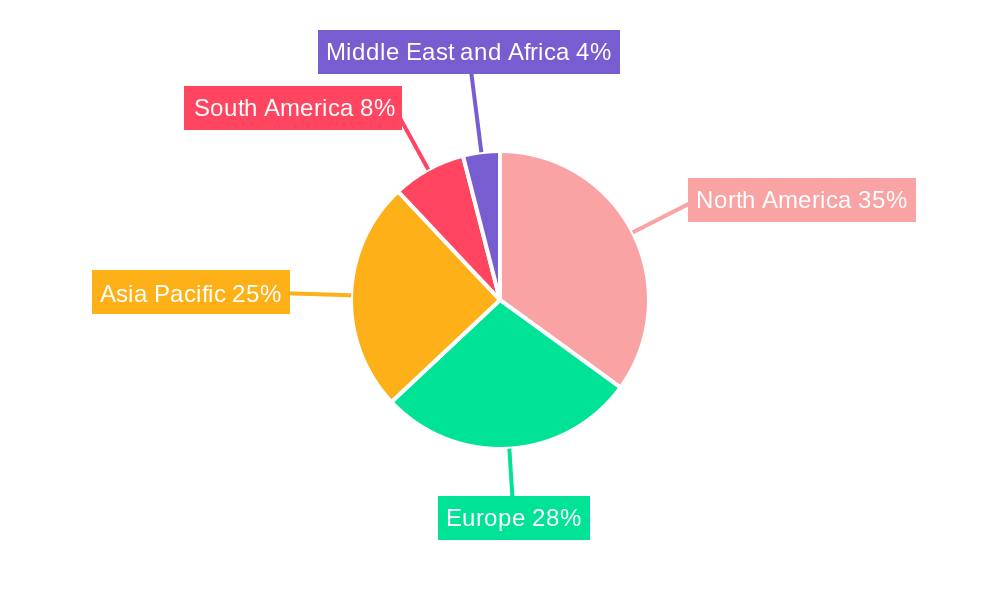
Geographic distribution shows varied market penetration across regions. North America, with its established beverage market and high consumer spending power, likely holds the largest market share. Asia Pacific, however, is predicted to witness substantial growth due to rapid economic development, urbanization, and rising disposable incomes, leading to increased beverage consumption. Europe and South America also contribute significantly, though market penetration may vary based on local preferences and economic conditions. The competitive landscape is highly dynamic, with established multinational corporations like Nestle, PepsiCo, and Coca-Cola competing alongside regional and specialized beverage brands. The competitive edge lies in offering diverse product portfolios tailored to regional tastes, embracing sustainability initiatives, and investing in effective marketing strategies. Future growth will hinge on adapting to evolving consumer preferences, integrating technological advancements in production and distribution, and prioritizing product innovation focused on health and wellness.
Ready to Drink Beverages Market Company Market Share
Ready to Drink Beverages Market: A Comprehensive Report (2019-2033)
This comprehensive report provides a detailed analysis of the Ready to Drink Beverages market, offering invaluable insights for industry stakeholders, investors, and businesses seeking to navigate this dynamic sector. The report covers the period from 2019 to 2033, with a base year of 2025 and a forecast period spanning 2025-2033. Key market segments, leading players, and emerging trends are meticulously examined to provide a holistic understanding of the market landscape. The total market size in 2025 is estimated at xx Million.
Ready to Drink Beverages Market Concentration & Innovation
This section analyzes the competitive landscape of the ready-to-drink beverages market, examining market concentration, innovation drivers, regulatory influences, and significant mergers and acquisitions (M&A) activity. The market is characterized by the presence of both large multinational corporations and smaller, specialized players. The top players, including Nestle SA, PepsiCo Inc, The Coca-Cola Company, and Red Bull GmbH, hold a significant market share, although the exact figures vary by segment. However, the market is also experiencing increased competition from smaller brands focusing on niche segments like organic and functional beverages.
- Market Concentration: The market exhibits a moderately concentrated structure, with a few major players dominating specific segments. The Herfindahl-Hirschman Index (HHI) for the overall market is estimated to be xx, suggesting a moderately competitive landscape.
- Innovation Drivers: Key innovation drivers include the rising demand for healthier beverages, the increasing popularity of functional drinks (e.g., those containing added vitamins, minerals, or probiotics), and the growing interest in sustainable and ethically sourced ingredients.
- Regulatory Frameworks: Government regulations concerning labeling, ingredients, and marketing practices significantly impact the industry. Changes in these regulations can influence product formulation, pricing strategies, and market entry. For example, sugar taxes in several regions have impacted the formulation of sugary drinks.
- Product Substitutes: The market faces competition from other beverage categories, including bottled water, juices, and homemade drinks. The competitive pressure from substitutes necessitates continuous innovation and differentiation to maintain market share.
- End-User Trends: Consumer preferences are increasingly shifting towards healthier, natural, and convenient beverage options. This trend is driving innovation in areas such as organic and functional beverages.
- M&A Activities: The ready-to-drink beverages industry has witnessed a significant number of mergers and acquisitions in recent years. Deal values have ranged from xx Million to xx Million, primarily driven by efforts to expand market share, gain access to new technologies, and enhance product portfolios. These activities further consolidate market power and shape the competitive landscape.
Ready to Drink Beverages Market Industry Trends & Insights
The ready-to-drink beverages market is experiencing robust growth driven by several factors. The global CAGR for the period 2025-2033 is projected at xx%. This growth is fueled by rising disposable incomes, particularly in emerging economies, increasing urbanization, and changing consumer lifestyles. Technological advancements in beverage processing, packaging, and distribution are also contributing factors.
A notable trend is the increasing demand for healthier and functional beverages, including those fortified with vitamins, minerals, probiotics, or other beneficial ingredients. This trend is reflected in the success of products marketed on health and wellness benefits. Market penetration of functional beverages is steadily increasing, and this segment is expected to show strong growth in the forecast period. Furthermore, the rising awareness of health and wellness is driving demand for organic and natural ready-to-drink beverages. The competitive dynamics are intense, with established players continually innovating and new entrants challenging the status quo. Pricing strategies, marketing campaigns, and distribution networks play a crucial role in determining market success.
Dominant Markets & Segments in Ready to Drink Beverages Market
The ready-to-drink beverages market is geographically diverse, with significant variations in consumption patterns and market dynamics across regions and countries. While precise regional dominance requires further data, the North American and European markets are presently significant, driven by high per capita consumption and strong brand presence. However, emerging markets in Asia-Pacific and Latin America are experiencing rapid growth, presenting lucrative opportunities for expansion.
Dominant Distribution Channels:
- Supermarkets/Hypermarkets: This remains a dominant distribution channel, leveraging established infrastructure and consumer access. Key drivers include extensive reach, diverse product offerings, and promotional opportunities.
- Convenience/Grocery Stores: These stores capitalize on convenience and impulse buying, particularly in urban areas. Growth is driven by increasing foot traffic and strategic product placement.
- Online Stores: E-commerce platforms are rapidly expanding their market share. Key drivers include convenience, wider product selection, and targeted marketing capabilities. However, challenges include logistics and maintaining product quality during transit.
- Specialty Retail Stores: Stores specializing in health foods and organic products offer growth potential for specific ready-to-drink beverage segments.
- Other Distribution Channels: This includes vending machines, food service establishments, and direct-to-consumer channels.
Dominant Product Types:
- Energy Drinks: This segment benefits from strong consumer demand, with continued growth fueled by increasing consumption among young adults and athletes.
- Flavored & Fortified Water: The demand for healthier hydration options drives growth in this segment. This segment is seeing innovation with various flavors, added nutrients, and functional properties.
- Tea and Coffee: These segments are experiencing growth, particularly for ready-to-drink variations offering convenience and diverse flavor profiles.
Specific economic policies (like taxes and subsidies) and infrastructure development significantly influence market growth in different regions. Stronger economies typically correlate with higher per capita consumption.
Ready to Drink Beverages Market Product Developments
Recent product innovations reflect the industry's focus on consumer health and wellness. We've seen a surge in functional beverages enriched with vitamins, probiotics, and other beneficial ingredients, alongside a growing demand for organic and sustainably sourced options. These developments offer significant competitive advantages, allowing brands to cater to evolving consumer preferences and stand out in a crowded marketplace. Technological advancements in packaging, such as sustainable materials and enhanced shelf life, are also playing an increasingly important role. The market is rapidly embracing convenient, on-the-go formats, appealing to busy consumers and expanding the reach of various beverage categories.
Report Scope & Segmentation Analysis
This report segments the ready-to-drink beverage market based on distribution channels and product types. The distribution channels include supermarkets/hypermarkets, convenience/grocery stores, online stores, specialty retail stores, and other channels. Each channel exhibits unique growth characteristics and competitive dynamics. The product segments encompass tea, coffee, energy drinks, yogurt drinks, dairy and dairy alternative beverages, flavored & fortified water, and other product types. Each segment has distinct growth trajectories influenced by evolving consumer preferences and technological innovations. Market sizes and growth projections for each segment are provided in the detailed report.
Key Drivers of Ready to Drink Beverages Market Growth
Several factors are driving the growth of the ready-to-drink beverages market. Rising disposable incomes, particularly in developing economies, are increasing consumer spending on convenience foods and beverages. The growing urban population, with its fast-paced lifestyle, fuels the demand for convenient ready-to-drink options. Technological advancements in processing, packaging, and distribution improve efficiency and reduce costs, enabling broader market access. Health and wellness trends are driving demand for functional and organic beverages. Favorable regulatory environments in some regions can encourage market expansion.
Challenges in the Ready to Drink Beverages Market Sector
The ready-to-drink beverages sector faces several challenges. Stringent regulatory frameworks regarding ingredients, labeling, and marketing can impact product development and pricing. Fluctuations in raw material prices and supply chain disruptions can affect production costs and profitability. Intense competition from both established players and emerging brands necessitates continuous innovation and differentiation to maintain market share. Consumer preferences are constantly evolving, requiring brands to adapt their product offerings and marketing strategies to meet changing demands.
Emerging Opportunities in Ready to Drink Beverages Market
Significant opportunities exist within the ready-to-drink beverages market. Expanding into emerging markets with high growth potential presents substantial opportunities for revenue growth. Developing innovative products catering to specific health and wellness needs, like organic or functional beverages, represents a significant opportunity. Leveraging technological advancements in packaging and distribution can enhance efficiency, reach broader consumer segments, and reduce environmental impact. Personalized products and targeted marketing strategies can further cater to individual consumer preferences and drive sales.
Leading Players in the Ready to Drink Beverages Market Market
Key Developments in Ready to Drink Beverages Market Industry
- February 2023: Pepsi Co. launched a marshmallow-flavored Cola in partnership with Peeps. This innovative product launch showcases the industry's focus on novelty and creating exciting flavor experiences.
- September 2022: Honest Tea launched Just Iced Tea, an organic ready-to-drink iced tea brand. This launch reflects growing consumer demand for healthier and ethically sourced products.
- March 2022: Nirvana Water Sciences Inc. introduced Nirvana HMB + vitamin D3 spring water, emphasizing functional benefits and consumer health.
Strategic Outlook for Ready to Drink Beverages Market Market
The ready-to-drink beverages market is poised for continued growth, driven by evolving consumer preferences and technological innovations. Focus on functional, organic, and sustainably produced beverages will be critical for success. Expansion into emerging markets and leveraging e-commerce platforms are key strategies. Continuous product innovation and effective marketing strategies will determine market leadership in the years to come. The market's future rests on adaptation to evolving consumer demands and effective responses to competitive pressures.
Ready to Drink Beverages Market Segmentation
-
1. Product Type
- 1.1. Tea
- 1.2. Coffee
- 1.3. Energy Drinks
- 1.4. Yogurt Drinks
- 1.5. Dairy and Dairy Alternative Beverages
- 1.6. Flavored and Fortified Water
- 1.7. Other Product Types
-
2. Distribution Channel
- 2.1. Supermarkets/Hypermarkets
- 2.2. Convenience/Grocery Stores
- 2.3. Online Stores
- 2.4. Specialty Retail Stores
- 2.5. Other Distribution Channels
Ready to Drink Beverages Market Segmentation By Geography
-
1. North America
- 1.1. United States
- 1.2. Canada
- 1.3. Mexico
- 1.4. Rest of North America
-
2. Europe
- 2.1. Germany
- 2.2. United Kingdom
- 2.3. Italy
- 2.4. Spain
- 2.5. France
- 2.6. Russia
- 2.7. Rest of Europe
-
3. Asia Pacific
- 3.1. China
- 3.2. Japan
- 3.3. India
- 3.4. Australia
- 3.5. Rest of Asia Pacific
-
4. South America
- 4.1. Brazil
- 4.2. Argentina
- 4.3. Rest of South America
-
5. Middle East and Africa
- 5.1. South Africa
- 5.2. Saudi Arabia
- 5.3. Rest of Middle East and Africa
Ready to Drink Beverages Market Regional Market Share
Geographic Coverage of Ready to Drink Beverages Market
Ready to Drink Beverages Market REPORT HIGHLIGHTS
| Aspects | Details |
|---|---|
| Study Period | 2020-2034 |
| Base Year | 2025 |
| Estimated Year | 2026 |
| Forecast Period | 2026-2034 |
| Historical Period | 2020-2025 |
| Growth Rate | CAGR of 4.81% from 2020-2034 |
| Segmentation |
|
Table of Contents
- 1. Introduction
- 1.1. Research Scope
- 1.2. Market Segmentation
- 1.3. Research Objective
- 1.4. Definitions and Assumptions
- 2. Executive Summary
- 2.1. Market Snapshot
- 3. Market Dynamics
- 3.1. Market Drivers
- 3.2. Market Restrains
- 3.3. Market Trends
- 3.4. Market Opportunities
- 4. Market Factor Analysis
- 4.1. Porters Five Forces
- 4.1.1. Bargaining Power of Suppliers
- 4.1.2. Bargaining Power of Buyers
- 4.1.3. Threat of New Entrants
- 4.1.4. Threat of Substitutes
- 4.1.5. Competitive Rivalry
- 4.2. PESTEL analysis
- 4.3. BCG Analysis
- 4.3.1. Stars (High Growth, High Market Share)
- 4.3.2. Cash Cows (Low Growth, High Market Share)
- 4.3.3. Question Mark (High Growth, Low Market Share)
- 4.3.4. Dogs (Low Growth, Low Market Share)
- 4.4. Ansoff Matrix Analysis
- 4.5. Supply Chain Analysis
- 4.6. Regulatory Landscape
- 4.7. Current Market Potential and Opportunity Assessment (TAM–SAM–SOM Framework)
- 4.8. RAX Analyst Note
- 4.1. Porters Five Forces
- 5. Market Analysis, Insights and Forecast 2021-2033
- 5.1. Market Analysis, Insights and Forecast - by Product Type
- 5.1.1. Tea
- 5.1.2. Coffee
- 5.1.3. Energy Drinks
- 5.1.4. Yogurt Drinks
- 5.1.5. Dairy and Dairy Alternative Beverages
- 5.1.6. Flavored and Fortified Water
- 5.1.7. Other Product Types
- 5.2. Market Analysis, Insights and Forecast - by Distribution Channel
- 5.2.1. Supermarkets/Hypermarkets
- 5.2.2. Convenience/Grocery Stores
- 5.2.3. Online Stores
- 5.2.4. Specialty Retail Stores
- 5.2.5. Other Distribution Channels
- 5.3. Market Analysis, Insights and Forecast - by Region
- 5.3.1. North America
- 5.3.2. Europe
- 5.3.3. Asia Pacific
- 5.3.4. South America
- 5.3.5. Middle East and Africa
- 5.1. Market Analysis, Insights and Forecast - by Product Type
- 6. Global Ready to Drink Beverages Market Analysis, Insights and Forecast, 2021-2033
- 6.1. Market Analysis, Insights and Forecast - by Product Type
- 6.1.1. Tea
- 6.1.2. Coffee
- 6.1.3. Energy Drinks
- 6.1.4. Yogurt Drinks
- 6.1.5. Dairy and Dairy Alternative Beverages
- 6.1.6. Flavored and Fortified Water
- 6.1.7. Other Product Types
- 6.2. Market Analysis, Insights and Forecast - by Distribution Channel
- 6.2.1. Supermarkets/Hypermarkets
- 6.2.2. Convenience/Grocery Stores
- 6.2.3. Online Stores
- 6.2.4. Specialty Retail Stores
- 6.2.5. Other Distribution Channels
- 6.1. Market Analysis, Insights and Forecast - by Product Type
- 7. North America Ready to Drink Beverages Market Analysis, Insights and Forecast, 2020-2032
- 7.1. Market Analysis, Insights and Forecast - by Product Type
- 7.1.1. Tea
- 7.1.2. Coffee
- 7.1.3. Energy Drinks
- 7.1.4. Yogurt Drinks
- 7.1.5. Dairy and Dairy Alternative Beverages
- 7.1.6. Flavored and Fortified Water
- 7.1.7. Other Product Types
- 7.2. Market Analysis, Insights and Forecast - by Distribution Channel
- 7.2.1. Supermarkets/Hypermarkets
- 7.2.2. Convenience/Grocery Stores
- 7.2.3. Online Stores
- 7.2.4. Specialty Retail Stores
- 7.2.5. Other Distribution Channels
- 7.1. Market Analysis, Insights and Forecast - by Product Type
- 8. Europe Ready to Drink Beverages Market Analysis, Insights and Forecast, 2020-2032
- 8.1. Market Analysis, Insights and Forecast - by Product Type
- 8.1.1. Tea
- 8.1.2. Coffee
- 8.1.3. Energy Drinks
- 8.1.4. Yogurt Drinks
- 8.1.5. Dairy and Dairy Alternative Beverages
- 8.1.6. Flavored and Fortified Water
- 8.1.7. Other Product Types
- 8.2. Market Analysis, Insights and Forecast - by Distribution Channel
- 8.2.1. Supermarkets/Hypermarkets
- 8.2.2. Convenience/Grocery Stores
- 8.2.3. Online Stores
- 8.2.4. Specialty Retail Stores
- 8.2.5. Other Distribution Channels
- 8.1. Market Analysis, Insights and Forecast - by Product Type
- 9. Asia Pacific Ready to Drink Beverages Market Analysis, Insights and Forecast, 2020-2032
- 9.1. Market Analysis, Insights and Forecast - by Product Type
- 9.1.1. Tea
- 9.1.2. Coffee
- 9.1.3. Energy Drinks
- 9.1.4. Yogurt Drinks
- 9.1.5. Dairy and Dairy Alternative Beverages
- 9.1.6. Flavored and Fortified Water
- 9.1.7. Other Product Types
- 9.2. Market Analysis, Insights and Forecast - by Distribution Channel
- 9.2.1. Supermarkets/Hypermarkets
- 9.2.2. Convenience/Grocery Stores
- 9.2.3. Online Stores
- 9.2.4. Specialty Retail Stores
- 9.2.5. Other Distribution Channels
- 9.1. Market Analysis, Insights and Forecast - by Product Type
- 10. South America Ready to Drink Beverages Market Analysis, Insights and Forecast, 2020-2032
- 10.1. Market Analysis, Insights and Forecast - by Product Type
- 10.1.1. Tea
- 10.1.2. Coffee
- 10.1.3. Energy Drinks
- 10.1.4. Yogurt Drinks
- 10.1.5. Dairy and Dairy Alternative Beverages
- 10.1.6. Flavored and Fortified Water
- 10.1.7. Other Product Types
- 10.2. Market Analysis, Insights and Forecast - by Distribution Channel
- 10.2.1. Supermarkets/Hypermarkets
- 10.2.2. Convenience/Grocery Stores
- 10.2.3. Online Stores
- 10.2.4. Specialty Retail Stores
- 10.2.5. Other Distribution Channels
- 10.1. Market Analysis, Insights and Forecast - by Product Type
- 11. Middle East and Africa Ready to Drink Beverages Market Analysis, Insights and Forecast, 2020-2032
- 11.1. Market Analysis, Insights and Forecast - by Product Type
- 11.1.1. Tea
- 11.1.2. Coffee
- 11.1.3. Energy Drinks
- 11.1.4. Yogurt Drinks
- 11.1.5. Dairy and Dairy Alternative Beverages
- 11.1.6. Flavored and Fortified Water
- 11.1.7. Other Product Types
- 11.2. Market Analysis, Insights and Forecast - by Distribution Channel
- 11.2.1. Supermarkets/Hypermarkets
- 11.2.2. Convenience/Grocery Stores
- 11.2.3. Online Stores
- 11.2.4. Specialty Retail Stores
- 11.2.5. Other Distribution Channels
- 11.1. Market Analysis, Insights and Forecast - by Product Type
- 12. Competitive Analysis
- 12.1. Company Profiles
- 12.1.1 Nestle SA
- 12.1.1.1. Company Overview
- 12.1.1.2. Products
- 12.1.1.3. Company Financials
- 12.1.1.4. SWOT Analysis
- 12.1.2 Dabur India Limited*List Not Exhaustive
- 12.1.2.1. Company Overview
- 12.1.2.2. Products
- 12.1.2.3. Company Financials
- 12.1.2.4. SWOT Analysis
- 12.1.3 Monster Beverage Corporation
- 12.1.3.1. Company Overview
- 12.1.3.2. Products
- 12.1.3.3. Company Financials
- 12.1.3.4. SWOT Analysis
- 12.1.4 Yakult Honsha Co Ltd
- 12.1.4.1. Company Overview
- 12.1.4.2. Products
- 12.1.4.3. Company Financials
- 12.1.4.4. SWOT Analysis
- 12.1.5 Pepsico Inc
- 12.1.5.1. Company Overview
- 12.1.5.2. Products
- 12.1.5.3. Company Financials
- 12.1.5.4. SWOT Analysis
- 12.1.6 Danone SA
- 12.1.6.1. Company Overview
- 12.1.6.2. Products
- 12.1.6.3. Company Financials
- 12.1.6.4. SWOT Analysis
- 12.1.7 Suntory Holdings Limited
- 12.1.7.1. Company Overview
- 12.1.7.2. Products
- 12.1.7.3. Company Financials
- 12.1.7.4. SWOT Analysis
- 12.1.8 Red Bull GmbH
- 12.1.8.1. Company Overview
- 12.1.8.2. Products
- 12.1.8.3. Company Financials
- 12.1.8.4. SWOT Analysis
- 12.1.9 Blue Diamond Growers
- 12.1.9.1. Company Overview
- 12.1.9.2. Products
- 12.1.9.3. Company Financials
- 12.1.9.4. SWOT Analysis
- 12.1.10 The Coca-Cola Company
- 12.1.10.1. Company Overview
- 12.1.10.2. Products
- 12.1.10.3. Company Financials
- 12.1.10.4. SWOT Analysis
- 12.1.1 Nestle SA
- 12.2. Market Entropy
- 12.2.1 Company's Key Areas Served
- 12.2.2 Recent Developments
- 12.3. Company Market Share Analysis 2025
- 12.3.1 Top 5 Companies Market Share Analysis
- 12.3.2 Top 3 Companies Market Share Analysis
- 12.4. List of Potential Customers
- 13. Research Methodology
List of Figures
- Figure 1: Global Ready to Drink Beverages Market Revenue Breakdown (Million, %) by Region 2025 & 2033
- Figure 2: North America Ready to Drink Beverages Market Revenue (Million), by Product Type 2025 & 2033
- Figure 3: North America Ready to Drink Beverages Market Revenue Share (%), by Product Type 2025 & 2033
- Figure 4: North America Ready to Drink Beverages Market Revenue (Million), by Distribution Channel 2025 & 2033
- Figure 5: North America Ready to Drink Beverages Market Revenue Share (%), by Distribution Channel 2025 & 2033
- Figure 6: North America Ready to Drink Beverages Market Revenue (Million), by Country 2025 & 2033
- Figure 7: North America Ready to Drink Beverages Market Revenue Share (%), by Country 2025 & 2033
- Figure 8: Europe Ready to Drink Beverages Market Revenue (Million), by Product Type 2025 & 2033
- Figure 9: Europe Ready to Drink Beverages Market Revenue Share (%), by Product Type 2025 & 2033
- Figure 10: Europe Ready to Drink Beverages Market Revenue (Million), by Distribution Channel 2025 & 2033
- Figure 11: Europe Ready to Drink Beverages Market Revenue Share (%), by Distribution Channel 2025 & 2033
- Figure 12: Europe Ready to Drink Beverages Market Revenue (Million), by Country 2025 & 2033
- Figure 13: Europe Ready to Drink Beverages Market Revenue Share (%), by Country 2025 & 2033
- Figure 14: Asia Pacific Ready to Drink Beverages Market Revenue (Million), by Product Type 2025 & 2033
- Figure 15: Asia Pacific Ready to Drink Beverages Market Revenue Share (%), by Product Type 2025 & 2033
- Figure 16: Asia Pacific Ready to Drink Beverages Market Revenue (Million), by Distribution Channel 2025 & 2033
- Figure 17: Asia Pacific Ready to Drink Beverages Market Revenue Share (%), by Distribution Channel 2025 & 2033
- Figure 18: Asia Pacific Ready to Drink Beverages Market Revenue (Million), by Country 2025 & 2033
- Figure 19: Asia Pacific Ready to Drink Beverages Market Revenue Share (%), by Country 2025 & 2033
- Figure 20: South America Ready to Drink Beverages Market Revenue (Million), by Product Type 2025 & 2033
- Figure 21: South America Ready to Drink Beverages Market Revenue Share (%), by Product Type 2025 & 2033
- Figure 22: South America Ready to Drink Beverages Market Revenue (Million), by Distribution Channel 2025 & 2033
- Figure 23: South America Ready to Drink Beverages Market Revenue Share (%), by Distribution Channel 2025 & 2033
- Figure 24: South America Ready to Drink Beverages Market Revenue (Million), by Country 2025 & 2033
- Figure 25: South America Ready to Drink Beverages Market Revenue Share (%), by Country 2025 & 2033
- Figure 26: Middle East and Africa Ready to Drink Beverages Market Revenue (Million), by Product Type 2025 & 2033
- Figure 27: Middle East and Africa Ready to Drink Beverages Market Revenue Share (%), by Product Type 2025 & 2033
- Figure 28: Middle East and Africa Ready to Drink Beverages Market Revenue (Million), by Distribution Channel 2025 & 2033
- Figure 29: Middle East and Africa Ready to Drink Beverages Market Revenue Share (%), by Distribution Channel 2025 & 2033
- Figure 30: Middle East and Africa Ready to Drink Beverages Market Revenue (Million), by Country 2025 & 2033
- Figure 31: Middle East and Africa Ready to Drink Beverages Market Revenue Share (%), by Country 2025 & 2033
List of Tables
- Table 1: Global Ready to Drink Beverages Market Revenue Million Forecast, by Product Type 2020 & 2033
- Table 2: Global Ready to Drink Beverages Market Revenue Million Forecast, by Distribution Channel 2020 & 2033
- Table 3: Global Ready to Drink Beverages Market Revenue Million Forecast, by Region 2020 & 2033
- Table 4: Global Ready to Drink Beverages Market Revenue Million Forecast, by Product Type 2020 & 2033
- Table 5: Global Ready to Drink Beverages Market Revenue Million Forecast, by Distribution Channel 2020 & 2033
- Table 6: Global Ready to Drink Beverages Market Revenue Million Forecast, by Country 2020 & 2033
- Table 7: United States Ready to Drink Beverages Market Revenue (Million) Forecast, by Application 2020 & 2033
- Table 8: Canada Ready to Drink Beverages Market Revenue (Million) Forecast, by Application 2020 & 2033
- Table 9: Mexico Ready to Drink Beverages Market Revenue (Million) Forecast, by Application 2020 & 2033
- Table 10: Rest of North America Ready to Drink Beverages Market Revenue (Million) Forecast, by Application 2020 & 2033
- Table 11: Global Ready to Drink Beverages Market Revenue Million Forecast, by Product Type 2020 & 2033
- Table 12: Global Ready to Drink Beverages Market Revenue Million Forecast, by Distribution Channel 2020 & 2033
- Table 13: Global Ready to Drink Beverages Market Revenue Million Forecast, by Country 2020 & 2033
- Table 14: Germany Ready to Drink Beverages Market Revenue (Million) Forecast, by Application 2020 & 2033
- Table 15: United Kingdom Ready to Drink Beverages Market Revenue (Million) Forecast, by Application 2020 & 2033
- Table 16: Italy Ready to Drink Beverages Market Revenue (Million) Forecast, by Application 2020 & 2033
- Table 17: Spain Ready to Drink Beverages Market Revenue (Million) Forecast, by Application 2020 & 2033
- Table 18: France Ready to Drink Beverages Market Revenue (Million) Forecast, by Application 2020 & 2033
- Table 19: Russia Ready to Drink Beverages Market Revenue (Million) Forecast, by Application 2020 & 2033
- Table 20: Rest of Europe Ready to Drink Beverages Market Revenue (Million) Forecast, by Application 2020 & 2033
- Table 21: Global Ready to Drink Beverages Market Revenue Million Forecast, by Product Type 2020 & 2033
- Table 22: Global Ready to Drink Beverages Market Revenue Million Forecast, by Distribution Channel 2020 & 2033
- Table 23: Global Ready to Drink Beverages Market Revenue Million Forecast, by Country 2020 & 2033
- Table 24: China Ready to Drink Beverages Market Revenue (Million) Forecast, by Application 2020 & 2033
- Table 25: Japan Ready to Drink Beverages Market Revenue (Million) Forecast, by Application 2020 & 2033
- Table 26: India Ready to Drink Beverages Market Revenue (Million) Forecast, by Application 2020 & 2033
- Table 27: Australia Ready to Drink Beverages Market Revenue (Million) Forecast, by Application 2020 & 2033
- Table 28: Rest of Asia Pacific Ready to Drink Beverages Market Revenue (Million) Forecast, by Application 2020 & 2033
- Table 29: Global Ready to Drink Beverages Market Revenue Million Forecast, by Product Type 2020 & 2033
- Table 30: Global Ready to Drink Beverages Market Revenue Million Forecast, by Distribution Channel 2020 & 2033
- Table 31: Global Ready to Drink Beverages Market Revenue Million Forecast, by Country 2020 & 2033
- Table 32: Brazil Ready to Drink Beverages Market Revenue (Million) Forecast, by Application 2020 & 2033
- Table 33: Argentina Ready to Drink Beverages Market Revenue (Million) Forecast, by Application 2020 & 2033
- Table 34: Rest of South America Ready to Drink Beverages Market Revenue (Million) Forecast, by Application 2020 & 2033
- Table 35: Global Ready to Drink Beverages Market Revenue Million Forecast, by Product Type 2020 & 2033
- Table 36: Global Ready to Drink Beverages Market Revenue Million Forecast, by Distribution Channel 2020 & 2033
- Table 37: Global Ready to Drink Beverages Market Revenue Million Forecast, by Country 2020 & 2033
- Table 38: South Africa Ready to Drink Beverages Market Revenue (Million) Forecast, by Application 2020 & 2033
- Table 39: Saudi Arabia Ready to Drink Beverages Market Revenue (Million) Forecast, by Application 2020 & 2033
- Table 40: Rest of Middle East and Africa Ready to Drink Beverages Market Revenue (Million) Forecast, by Application 2020 & 2033
Frequently Asked Questions
1. What is the projected Compound Annual Growth Rate (CAGR) of the Ready to Drink Beverages Market?
The projected CAGR is approximately 4.81%.
2. Which companies are prominent players in the Ready to Drink Beverages Market?
Key companies in the market include Nestle SA, Dabur India Limited*List Not Exhaustive, Monster Beverage Corporation, Yakult Honsha Co Ltd, Pepsico Inc, Danone SA, Suntory Holdings Limited, Red Bull GmbH, Blue Diamond Growers, The Coca-Cola Company.
3. What are the main segments of the Ready to Drink Beverages Market?
The market segments include Product Type, Distribution Channel.
4. Can you provide details about the market size?
The market size is estimated to be USD 361.01 Million as of 2022.
5. What are some drivers contributing to market growth?
Inclination Toward Low-Sugar/Sugar-free Beverages.
6. What are the notable trends driving market growth?
Augmented Expenditure on Advertisement and Promotional Activities Impel Market Growth.
7. Are there any restraints impacting market growth?
Concerns Over Health Issues Associated with Functional Beverages.
8. Can you provide examples of recent developments in the market?
February 2023: Pepsi Co. launched marshmallow-flavored Cola in partnership with Peeps. The pillowy-soft marshmallow cola flavor, paired with the instantly recognizable PEEPS®, comes in vibrant yellow packaging.
9. What pricing options are available for accessing the report?
Pricing options include single-user, multi-user, and enterprise licenses priced at USD 4750, USD 5250, and USD 8750 respectively.
10. Is the market size provided in terms of value or volume?
The market size is provided in terms of value, measured in Million.
11. Are there any specific market keywords associated with the report?
Yes, the market keyword associated with the report is "Ready to Drink Beverages Market," which aids in identifying and referencing the specific market segment covered.
12. How do I determine which pricing option suits my needs best?
The pricing options vary based on user requirements and access needs. Individual users may opt for single-user licenses, while businesses requiring broader access may choose multi-user or enterprise licenses for cost-effective access to the report.
13. Are there any additional resources or data provided in the Ready to Drink Beverages Market report?
While the report offers comprehensive insights, it's advisable to review the specific contents or supplementary materials provided to ascertain if additional resources or data are available.
14. How can I stay updated on further developments or reports in the Ready to Drink Beverages Market?
To stay informed about further developments, trends, and reports in the Ready to Drink Beverages Market, consider subscribing to industry newsletters, following relevant companies and organizations, or regularly checking reputable industry news sources and publications.
Methodology
Step 1 - Identification of Relevant Samples Size from Population Database


Step 2 - Approaches for Defining Global Market Size (Value, Volume* & Price*)

Note*: In applicable scenarios
Step 3 - Data Sources
Primary Research
- Web Analytics
- Survey Reports
- Research Institute
- Latest Research Reports
- Opinion Leaders
Secondary Research
- Annual Reports
- White Paper
- Latest Press Release
- Industry Association
- Paid Database
- Investor Presentations

Step 4 - Data Triangulation
Involves using different sources of information in order to increase the validity of a study
These sources are likely to be stakeholders in a program - participants, other researchers, program staff, other community members, and so on.
Then we put all data in single framework & apply various statistical tools to find out the dynamic on the market.
During the analysis stage, feedback from the stakeholder groups would be compared to determine areas of agreement as well as areas of divergence

