

Key Insights
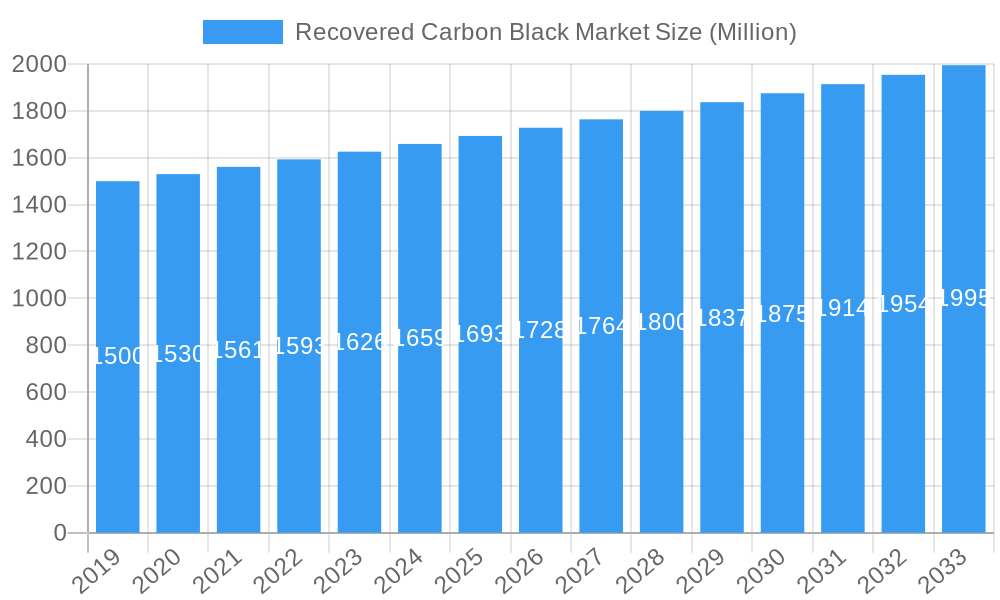
The global Recovered Carbon Black (rCB) market is projected to experience robust growth, reaching an estimated size of $14.5 billion by 2025, with a Compound Annual Growth Rate (CAGR) of 4.8% through 2033. This expansion is driven by stringent environmental regulations, a widespread industry focus on sustainability, and the increasing demand for economical raw materials. The tire sector remains the primary consumer of rCB, influenced by the automotive industry's persistent need for rubber components and a growing preference for recycled materials to minimize the environmental impact of tire production. The plastics industry is also demonstrating significant rCB adoption as manufacturers integrate recycled content to improve product sustainability and meet consumer expectations for eco-friendly goods.
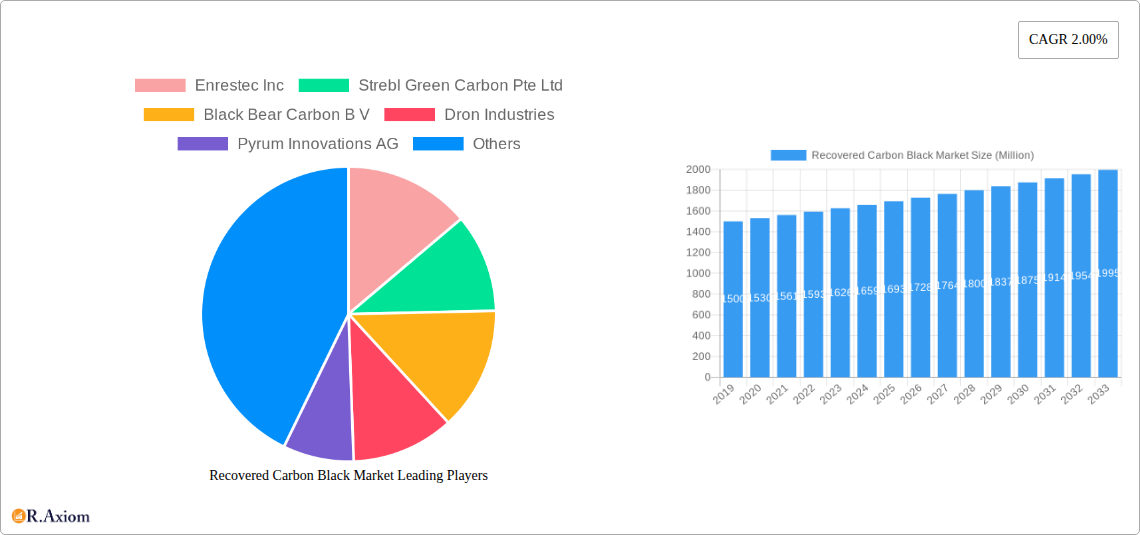
Recovered Carbon Black Market Market Size (In Billion)
Market dynamics are further shaped by technological advancements in pyrolysis, enhancing rCB quality and consistency to serve as a superior alternative to virgin carbon black. Emerging applications in non-tire rubber goods, colorants, and electronic components are also fostering market diversification. Key challenges include variability in the quality of end-of-life tires, the necessity for rCB production standardization, and the upfront investment required for recycling infrastructure. Geographically, the Asia Pacific region, led by China and India, is anticipated to lead the market owing to its substantial manufacturing base and supportive government policies promoting circular economy principles. North America and Europe are also key markets, driven by strict environmental mandates and developed recycling systems. Prominent market players such as Enrestec Inc., Strebl Green Carbon Pte Ltd., and Black Bear Carbon B.V. are actively engaged in research and development and strategic collaborations to strengthen their market positions.
Recovered Carbon Black Market Company Market Share
Recovered Carbon Black Market: Comprehensive Analysis & Future Outlook (2019-2033)
Report Description:
Unlock critical insights into the booming Recovered Carbon Black (rCB) market with our in-depth report. This comprehensive study provides an exhaustive analysis of the global market, encompassing historical trends, current dynamics, and future projections from 2019 to 2033. Delve into the intricate landscape of rCB applications in tires, batteries, plastics, non-tire rubber, and dyes/pigments, and understand its pervasive impact across end-user industries like automotive, printing & packaging, industrial, building & construction, and electronics.
This report offers unparalleled strategic intelligence for stakeholders seeking to capitalize on the circular economy. We meticulously examine market concentration, innovation drivers, regulatory frameworks, and competitive landscapes, featuring key players such as Enrestec Inc, Strebl Green Carbon Pte Ltd, Black Bear Carbon B V, Dron Industries, Pyrum Innovations AG, Carbon Recovery GmbH, DVA Renewable Energy JSC, SR2O Holdings LLC, Klean Industries Inc, Polimix, Delta Energy LLC, Reoil Sp z o o, Bolder Industries, Scandinavian Enviro Systems AB, and Alpha Carbone. Discover actionable strategies, emerging opportunities, and the challenges shaping this dynamic sector. The study period covers 2019–2033, with a base year of 2025 and a forecast period of 2025–2033, built upon a historical analysis from 2019–2024.
Recovered Carbon Black Market Market Concentration & Innovation
The Recovered Carbon Black (rCB) market is experiencing a significant shift towards consolidation and enhanced innovation. While still exhibiting moderate market concentration, leading companies are increasingly focusing on proprietary pyrolysis technologies and advanced rCB processing to achieve superior product quality and performance characteristics, rivaling virgin carbon black. Key innovation drivers include the escalating demand for sustainable materials, stringent environmental regulations promoting waste reduction and recycling, and the pursuit of cost-effective alternatives to petrochemical-derived carbon black. Regulatory frameworks, particularly those pertaining to End-of-Life Vehicle (ELV) directives and waste management, are pivotal in stimulating rCB adoption. Product substitutes, while limited in high-performance applications, are primarily virgin carbon black. End-user trends are overwhelmingly favoring sustainable sourcing, pushing tire manufacturers and other key consumers to integrate rCB into their supply chains. Mergers and acquisitions (M&A) activities are on the rise, albeit with deal values yet to reach the scale of more mature industries, as companies seek to expand production capacity and technological capabilities. For instance, strategic partnerships and smaller-scale acquisitions are paving the way for broader market penetration.
Recovered Carbon Black Market Industry Trends & Insights
The global Recovered Carbon Black (rCB) market is poised for substantial growth, driven by a confluence of environmental consciousness, economic pragmatism, and technological advancements. The escalating global emphasis on sustainability and the circular economy is the paramount growth driver. Governments worldwide are implementing stricter regulations on waste management and promoting the use of recycled materials, thereby creating a favorable ecosystem for rCB. The automotive industry, a major consumer of carbon black, is actively seeking sustainable alternatives for tire production, a trend further amplified by corporate sustainability goals. Technological disruptions in pyrolysis processes are leading to more efficient and cost-effective production of high-quality rCB, enabling its use in a wider array of applications beyond traditional rubber compounding. Consumer preferences are also subtly shifting, with an increasing awareness and demand for eco-friendly products across various sectors. The competitive dynamics are characterized by a growing number of specialized rCB producers and established chemical companies investing in recycling technologies. The market penetration of rCB is steadily increasing, displacing a fraction of virgin carbon black usage. The projected Compound Annual Growth Rate (CAGR) for the rCB market is robust, indicating a strong upward trajectory over the forecast period. This growth is underpinned by a rising demand for materials that reduce carbon footprints and mitigate reliance on fossil fuels. Key industry insights reveal a strategic pivot towards optimizing rCB properties to match or exceed those of virgin carbon black, thereby broadening its applicability and accelerating its market acceptance. Innovations in feedstock preparation and post-processing of rCB are critical to achieving these performance benchmarks.
Dominant Markets & Segments in Recovered Carbon Black Market
The Recovered Carbon Black (rCB) market exhibits distinct dominance patterns across regions and application segments.
Leading Region:
- Europe: Historically at the forefront of environmental legislation and sustainable practices, Europe leads in rCB adoption. Stringent waste management policies, such as the End-of-Life Vehicles (ELV) Directive, and a strong consumer demand for sustainable products fuel its dominance. Significant investments in pyrolysis infrastructure and robust research & development initiatives further solidify its position.
Leading Country:
- Germany: Within Europe, Germany stands out as a key market. Its advanced industrial base, a strong automotive sector, and pioneering companies in pyrolysis technology have positioned it as a frontrunner in rCB production and consumption. Government support for the circular economy and a well-established recycling infrastructure contribute to its leadership.
Dominant Application Segments:
- Tires: This segment holds the largest share in the rCB market.
- Key Drivers: The sheer volume of tire production globally, coupled with significant environmental pressure to recycle end-of-life tires, makes this the most influential application. Manufacturers are increasingly incorporating rCB to reduce their environmental footprint and meet sustainability targets. The pursuit of cost savings compared to virgin carbon black also plays a crucial role.
- Plastics: This segment is experiencing rapid growth.
- Key Drivers: The increasing demand for recycled content in plastic products, driven by regulatory mandates and consumer preferences for sustainable packaging and consumer goods. rCB acts as a reinforcing filler and pigment in plastics, improving their mechanical properties and offering a cost-effective, sustainable alternative.
- Non-Tire Rubber: This segment includes a diverse range of products.
- Key Drivers: Applications in conveyor belts, hoses, seals, and various industrial rubber components are seeing growing adoption of rCB due to its performance characteristics and sustainability benefits. The need for durable and cost-effective rubber products in industrial settings supports this segment's expansion.
Dominant End-User Industry:
- Automotive: This industry is the primary driver for rCB demand, largely due to its extensive use in tire manufacturing.
- Key Drivers: The automotive sector's commitment to reducing its environmental impact, including targets for recycled content in vehicles, directly translates to increased demand for rCB. Stringent regulations on vehicle emissions and recyclability also push for the adoption of sustainable materials like rCB.
Recovered Carbon Black Market Product Developments
Product developments in the Recovered Carbon Black (rCB) market are primarily focused on enhancing the quality and consistency of rCB to match the performance of virgin carbon black. Innovations in pyrolysis technology are yielding rCB with tailored particle sizes, surface areas, and structure, making it suitable for a broader range of demanding applications. Companies are developing rCB grades optimized for specific end-uses, such as high-performance tires, conductive plastics for electronics, and advanced battery components. The ability to produce rCB with lower impurity levels and improved dispersibility offers significant competitive advantages, enabling its wider acceptance by traditional carbon black users and fostering new market opportunities in specialized sectors.
Report Scope & Segmentation Analysis
This report provides a granular analysis of the Recovered Carbon Black (rCB) market, encompassing detailed segmentations across various applications and end-user industries.
- Application Segments: The market is segmented into Tires, Batteries, Plastics, Non-Tire Rubber, and Dyes and Pigments. Each segment's growth is influenced by specific industry trends, regulatory pressures, and technological advancements. For instance, the tire segment benefits from ELV directives, while the batteries segment sees growth driven by the electric vehicle revolution.
- End-user Industry Segments: Key end-user industries include Printing and Packaging, Industrial, Building and Construction, Electronics, Automotive, and Other End-user Industries. The automotive sector's demand for sustainable materials is a major growth catalyst. The electronics segment's need for conductive materials presents a burgeoning opportunity for rCB.
Key Drivers of Recovered Carbon Black Market Growth
The Recovered Carbon Black (rCB) market's growth is propelled by several interconnected factors. Foremost is the global push for sustainability and the circular economy. Increasingly stringent environmental regulations worldwide, particularly those focused on waste management and the promotion of recycled content, are creating a strong demand for rCB. The volatility and rising costs of petrochemical feedstock for virgin carbon black production make rCB an economically attractive alternative. Furthermore, technological advancements in pyrolysis processes are leading to improved rCB quality and consistency, making it a viable substitute for virgin carbon black in a wider array of applications. Growing consumer and corporate demand for eco-friendly products across industries like automotive and plastics further fuels this expansion.
Challenges in the Recovered Carbon Black Market Sector
Despite its promising growth, the Recovered Carbon Black (rCB) market faces several hurdles. Variability in feedstock quality (used tires and plastic waste) can impact the consistency and performance of the resulting rCB, posing a challenge for manufacturers aiming for premium applications. High initial investment costs for setting up advanced pyrolysis facilities can be a barrier to entry for smaller players. Regulatory fragmentation and evolving standards across different regions can complicate market penetration and product certification. Supply chain logistics for collecting and transporting waste feedstock, as well as distributing the final rCB product, also present significant operational challenges. Additionally, public perception and the need for education regarding the quality and benefits of rCB compared to virgin carbon black are ongoing considerations.
Emerging Opportunities in Recovered Carbon Black Market
The Recovered Carbon Black (rCB) market is ripe with emerging opportunities. The rapidly expanding electric vehicle (EV) market presents a significant opportunity, as rCB can be utilized in EV battery components and lightweight materials. The growing demand for sustainable packaging solutions offers another lucrative avenue for rCB in plastic formulations. Advances in advanced recycling technologies promise to unlock new feedstock sources and produce higher-grade rCB, opening up markets previously dominated by virgin materials. Furthermore, the development of specialty rCB grades for niche applications like conductive inks and coatings holds substantial potential. The increasing global focus on achieving net-zero emissions targets will continue to drive demand for circular economy solutions like rCB across all industries.
Leading Players in the Recovered Carbon Black Market Market
- Enrestec Inc
- Strebl Green Carbon Pte Ltd
- Black Bear Carbon B V
- Dron Industries
- Pyrum Innovations AG
- Carbon Recovery GmbH
- DVA Renewable Energy JSC
- SR2O Holdings LLC
- Klean Industries Inc
- Polimix
- Delta Energy LLC
- Reoil Sp z o o
- Bolder Industries
- Scandinavian Enviro Systems AB
- Alpha Carbone
Key Developments in Recovered Carbon Black Market Industry
- May 2022: Pyrum Innovations AG started the test operation of a new pelletizer at its plant site in Germany, which will enable the recovered carbon black (rCB) obtained via the pyrolysis process to be bonded into pellets, to increase their transportability and facilitates the further processing of the raw material.
- March 2022: Continental AG expanded its partnership with Pyrum Innovations AG to further optimize and expand the recycling of end-of-life tires through pyrolysis by producing high-quality recovered carbon black (rCB) for tire production of Continental.
- April 2020: Scandinavian Enviro Systems AB and Michelin partnered with each other to develop innovative technology of recovered carbon black to transform used tires into raw materials.
Strategic Outlook for Recovered Carbon Black Market Market
The strategic outlook for the Recovered Carbon Black (rCB) market is exceptionally positive, driven by a sustained increase in demand for sustainable materials and a global commitment to the circular economy. Key growth catalysts include ongoing advancements in pyrolysis technology, leading to higher quality and more versatile rCB products. Strategic partnerships between rCB producers and major end-users, particularly in the automotive and plastics sectors, will be crucial for market expansion and product integration. Investment in research and development to create specialized rCB grades for high-value applications will unlock new market frontiers. Furthermore, supportive government policies and evolving regulatory landscapes favoring recycled content will continue to provide a strong tailwind for the market. The expanding adoption of rCB signifies a significant shift towards resource efficiency and reduced environmental impact, positioning the market for robust and sustained growth.
Recovered Carbon Black Market Segmentation
-
1. Application
- 1.1. Tires
- 1.2. Batteries
- 1.3. Plastics
- 1.4. Non-Tire Rubber
- 1.5. Dyes and Pigments
-
2. End-user Industry
- 2.1. Printing and Packaging
- 2.2. Industrial
- 2.3. Building and Construction
- 2.4. Electronics
- 2.5. Automotive
- 2.6. Other End-user Industries
Recovered Carbon Black Market Segmentation By Geography
-
1. Asia Pacific
- 1.1. China
- 1.2. India
- 1.3. Japan
- 1.4. South Korea
- 1.5. Rest of Asia Pacific
-
2. North America
- 2.1. United States
- 2.2. Canada
- 2.3. Mexico
-
3. Europe
- 3.1. Germany
- 3.2. United Kingdom
- 3.3. Italy
- 3.4. France
- 3.5. Rest of Europe
-
4. South America
- 4.1. Brazil
- 4.2. Argentina
- 4.3. Rest of South America
-
5. Middle East and Africa
- 5.1. Saudi Arabia
- 5.2. South Africa
- 5.3. Rest of Middle East and Africa
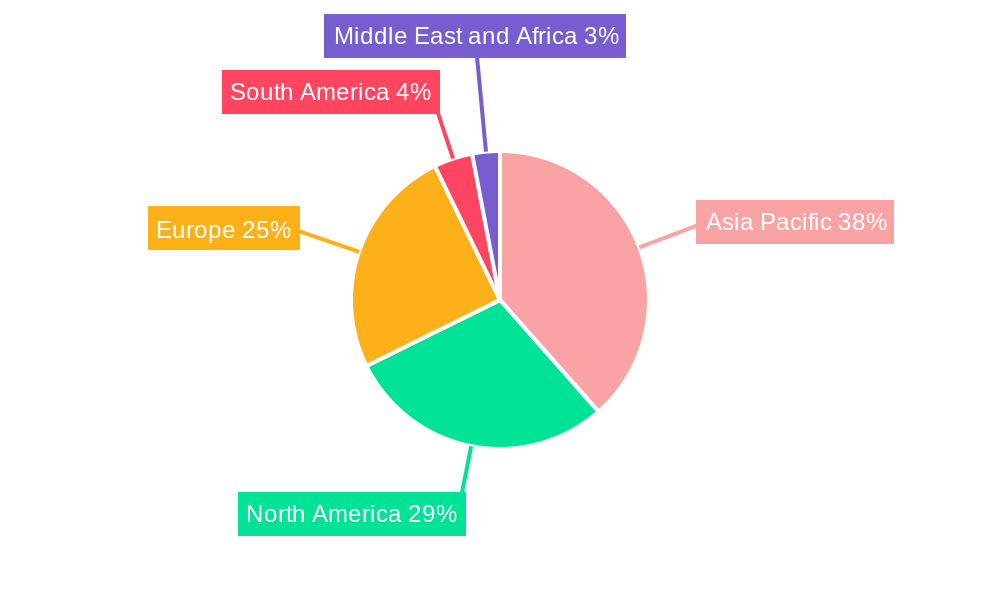
Recovered Carbon Black Market Regional Market Share
Geographic Coverage of Recovered Carbon Black Market
Recovered Carbon Black Market REPORT HIGHLIGHTS
| Aspects | Details |
|---|---|
| Study Period | 2020-2034 |
| Base Year | 2025 |
| Estimated Year | 2026 |
| Forecast Period | 2026-2034 |
| Historical Period | 2020-2025 |
| Growth Rate | CAGR of 4.8% from 2020-2034 |
| Segmentation |
|
Table of Contents
- 1. Introduction
- 1.1. Research Scope
- 1.2. Market Segmentation
- 1.3. Research Objective
- 1.4. Definitions and Assumptions
- 2. Executive Summary
- 2.1. Market Snapshot
- 3. Market Dynamics
- 3.1. Market Drivers
- 3.2. Market Restrains
- 3.3. Market Trends
- 3.4. Market Opportunities
- 4. Market Factor Analysis
- 4.1. Porters Five Forces
- 4.1.1. Bargaining Power of Suppliers
- 4.1.2. Bargaining Power of Buyers
- 4.1.3. Threat of New Entrants
- 4.1.4. Threat of Substitutes
- 4.1.5. Competitive Rivalry
- 4.2. PESTEL analysis
- 4.3. BCG Analysis
- 4.3.1. Stars (High Growth, High Market Share)
- 4.3.2. Cash Cows (Low Growth, High Market Share)
- 4.3.3. Question Mark (High Growth, Low Market Share)
- 4.3.4. Dogs (Low Growth, Low Market Share)
- 4.4. Ansoff Matrix Analysis
- 4.5. Supply Chain Analysis
- 4.6. Regulatory Landscape
- 4.7. Current Market Potential and Opportunity Assessment (TAM–SAM–SOM Framework)
- 4.8. RAX Analyst Note
- 4.1. Porters Five Forces
- 5. Market Analysis, Insights and Forecast 2021-2033
- 5.1. Market Analysis, Insights and Forecast - by Application
- 5.1.1. Tires
- 5.1.2. Batteries
- 5.1.3. Plastics
- 5.1.4. Non-Tire Rubber
- 5.1.5. Dyes and Pigments
- 5.2. Market Analysis, Insights and Forecast - by End-user Industry
- 5.2.1. Printing and Packaging
- 5.2.2. Industrial
- 5.2.3. Building and Construction
- 5.2.4. Electronics
- 5.2.5. Automotive
- 5.2.6. Other End-user Industries
- 5.3. Market Analysis, Insights and Forecast - by Region
- 5.3.1. Asia Pacific
- 5.3.2. North America
- 5.3.3. Europe
- 5.3.4. South America
- 5.3.5. Middle East and Africa
- 5.1. Market Analysis, Insights and Forecast - by Application
- 6. Global Recovered Carbon Black Market Analysis, Insights and Forecast, 2021-2033
- 6.1. Market Analysis, Insights and Forecast - by Application
- 6.1.1. Tires
- 6.1.2. Batteries
- 6.1.3. Plastics
- 6.1.4. Non-Tire Rubber
- 6.1.5. Dyes and Pigments
- 6.2. Market Analysis, Insights and Forecast - by End-user Industry
- 6.2.1. Printing and Packaging
- 6.2.2. Industrial
- 6.2.3. Building and Construction
- 6.2.4. Electronics
- 6.2.5. Automotive
- 6.2.6. Other End-user Industries
- 6.1. Market Analysis, Insights and Forecast - by Application
- 7. Asia Pacific Recovered Carbon Black Market Analysis, Insights and Forecast, 2020-2032
- 7.1. Market Analysis, Insights and Forecast - by Application
- 7.1.1. Tires
- 7.1.2. Batteries
- 7.1.3. Plastics
- 7.1.4. Non-Tire Rubber
- 7.1.5. Dyes and Pigments
- 7.2. Market Analysis, Insights and Forecast - by End-user Industry
- 7.2.1. Printing and Packaging
- 7.2.2. Industrial
- 7.2.3. Building and Construction
- 7.2.4. Electronics
- 7.2.5. Automotive
- 7.2.6. Other End-user Industries
- 7.1. Market Analysis, Insights and Forecast - by Application
- 8. North America Recovered Carbon Black Market Analysis, Insights and Forecast, 2020-2032
- 8.1. Market Analysis, Insights and Forecast - by Application
- 8.1.1. Tires
- 8.1.2. Batteries
- 8.1.3. Plastics
- 8.1.4. Non-Tire Rubber
- 8.1.5. Dyes and Pigments
- 8.2. Market Analysis, Insights and Forecast - by End-user Industry
- 8.2.1. Printing and Packaging
- 8.2.2. Industrial
- 8.2.3. Building and Construction
- 8.2.4. Electronics
- 8.2.5. Automotive
- 8.2.6. Other End-user Industries
- 8.1. Market Analysis, Insights and Forecast - by Application
- 9. Europe Recovered Carbon Black Market Analysis, Insights and Forecast, 2020-2032
- 9.1. Market Analysis, Insights and Forecast - by Application
- 9.1.1. Tires
- 9.1.2. Batteries
- 9.1.3. Plastics
- 9.1.4. Non-Tire Rubber
- 9.1.5. Dyes and Pigments
- 9.2. Market Analysis, Insights and Forecast - by End-user Industry
- 9.2.1. Printing and Packaging
- 9.2.2. Industrial
- 9.2.3. Building and Construction
- 9.2.4. Electronics
- 9.2.5. Automotive
- 9.2.6. Other End-user Industries
- 9.1. Market Analysis, Insights and Forecast - by Application
- 10. South America Recovered Carbon Black Market Analysis, Insights and Forecast, 2020-2032
- 10.1. Market Analysis, Insights and Forecast - by Application
- 10.1.1. Tires
- 10.1.2. Batteries
- 10.1.3. Plastics
- 10.1.4. Non-Tire Rubber
- 10.1.5. Dyes and Pigments
- 10.2. Market Analysis, Insights and Forecast - by End-user Industry
- 10.2.1. Printing and Packaging
- 10.2.2. Industrial
- 10.2.3. Building and Construction
- 10.2.4. Electronics
- 10.2.5. Automotive
- 10.2.6. Other End-user Industries
- 10.1. Market Analysis, Insights and Forecast - by Application
- 11. Middle East and Africa Recovered Carbon Black Market Analysis, Insights and Forecast, 2020-2032
- 11.1. Market Analysis, Insights and Forecast - by Application
- 11.1.1. Tires
- 11.1.2. Batteries
- 11.1.3. Plastics
- 11.1.4. Non-Tire Rubber
- 11.1.5. Dyes and Pigments
- 11.2. Market Analysis, Insights and Forecast - by End-user Industry
- 11.2.1. Printing and Packaging
- 11.2.2. Industrial
- 11.2.3. Building and Construction
- 11.2.4. Electronics
- 11.2.5. Automotive
- 11.2.6. Other End-user Industries
- 11.1. Market Analysis, Insights and Forecast - by Application
- 12. Competitive Analysis
- 12.1. Company Profiles
- 12.1.1 Enrestec Inc
- 12.1.1.1. Company Overview
- 12.1.1.2. Products
- 12.1.1.3. Company Financials
- 12.1.1.4. SWOT Analysis
- 12.1.2 Strebl Green Carbon Pte Ltd
- 12.1.2.1. Company Overview
- 12.1.2.2. Products
- 12.1.2.3. Company Financials
- 12.1.2.4. SWOT Analysis
- 12.1.3 Black Bear Carbon B V
- 12.1.3.1. Company Overview
- 12.1.3.2. Products
- 12.1.3.3. Company Financials
- 12.1.3.4. SWOT Analysis
- 12.1.4 Dron Industries
- 12.1.4.1. Company Overview
- 12.1.4.2. Products
- 12.1.4.3. Company Financials
- 12.1.4.4. SWOT Analysis
- 12.1.5 Pyrum Innovations AG
- 12.1.5.1. Company Overview
- 12.1.5.2. Products
- 12.1.5.3. Company Financials
- 12.1.5.4. SWOT Analysis
- 12.1.6 Carbon Recovery GmbH
- 12.1.6.1. Company Overview
- 12.1.6.2. Products
- 12.1.6.3. Company Financials
- 12.1.6.4. SWOT Analysis
- 12.1.7 DVA Renewable Energy JSC
- 12.1.7.1. Company Overview
- 12.1.7.2. Products
- 12.1.7.3. Company Financials
- 12.1.7.4. SWOT Analysis
- 12.1.8 SR2O Holdings LLC
- 12.1.8.1. Company Overview
- 12.1.8.2. Products
- 12.1.8.3. Company Financials
- 12.1.8.4. SWOT Analysis
- 12.1.9 Klean Industries Inc
- 12.1.9.1. Company Overview
- 12.1.9.2. Products
- 12.1.9.3. Company Financials
- 12.1.9.4. SWOT Analysis
- 12.1.10 Polimix
- 12.1.10.1. Company Overview
- 12.1.10.2. Products
- 12.1.10.3. Company Financials
- 12.1.10.4. SWOT Analysis
- 12.1.11 Delta Energy LLC
- 12.1.11.1. Company Overview
- 12.1.11.2. Products
- 12.1.11.3. Company Financials
- 12.1.11.4. SWOT Analysis
- 12.1.12 Reoil Sp z o o
- 12.1.12.1. Company Overview
- 12.1.12.2. Products
- 12.1.12.3. Company Financials
- 12.1.12.4. SWOT Analysis
- 12.1.13 Bolder Industries
- 12.1.13.1. Company Overview
- 12.1.13.2. Products
- 12.1.13.3. Company Financials
- 12.1.13.4. SWOT Analysis
- 12.1.14 Scandinavian Enviro Systems AB
- 12.1.14.1. Company Overview
- 12.1.14.2. Products
- 12.1.14.3. Company Financials
- 12.1.14.4. SWOT Analysis
- 12.1.15 Alpha Carbone
- 12.1.15.1. Company Overview
- 12.1.15.2. Products
- 12.1.15.3. Company Financials
- 12.1.15.4. SWOT Analysis
- 12.1.1 Enrestec Inc
- 12.2. Market Entropy
- 12.2.1 Company's Key Areas Served
- 12.2.2 Recent Developments
- 12.3. Company Market Share Analysis 2025
- 12.3.1 Top 5 Companies Market Share Analysis
- 12.3.2 Top 3 Companies Market Share Analysis
- 12.4. List of Potential Customers
- 13. Research Methodology
List of Figures
- Figure 1: Global Recovered Carbon Black Market Revenue Breakdown (billion, %) by Region 2025 & 2033
- Figure 2: Global Recovered Carbon Black Market Volume Breakdown (K Tons, %) by Region 2025 & 2033
- Figure 3: Asia Pacific Recovered Carbon Black Market Revenue (billion), by Application 2025 & 2033
- Figure 4: Asia Pacific Recovered Carbon Black Market Volume (K Tons), by Application 2025 & 2033
- Figure 5: Asia Pacific Recovered Carbon Black Market Revenue Share (%), by Application 2025 & 2033
- Figure 6: Asia Pacific Recovered Carbon Black Market Volume Share (%), by Application 2025 & 2033
- Figure 7: Asia Pacific Recovered Carbon Black Market Revenue (billion), by End-user Industry 2025 & 2033
- Figure 8: Asia Pacific Recovered Carbon Black Market Volume (K Tons), by End-user Industry 2025 & 2033
- Figure 9: Asia Pacific Recovered Carbon Black Market Revenue Share (%), by End-user Industry 2025 & 2033
- Figure 10: Asia Pacific Recovered Carbon Black Market Volume Share (%), by End-user Industry 2025 & 2033
- Figure 11: Asia Pacific Recovered Carbon Black Market Revenue (billion), by Country 2025 & 2033
- Figure 12: Asia Pacific Recovered Carbon Black Market Volume (K Tons), by Country 2025 & 2033
- Figure 13: Asia Pacific Recovered Carbon Black Market Revenue Share (%), by Country 2025 & 2033
- Figure 14: Asia Pacific Recovered Carbon Black Market Volume Share (%), by Country 2025 & 2033
- Figure 15: North America Recovered Carbon Black Market Revenue (billion), by Application 2025 & 2033
- Figure 16: North America Recovered Carbon Black Market Volume (K Tons), by Application 2025 & 2033
- Figure 17: North America Recovered Carbon Black Market Revenue Share (%), by Application 2025 & 2033
- Figure 18: North America Recovered Carbon Black Market Volume Share (%), by Application 2025 & 2033
- Figure 19: North America Recovered Carbon Black Market Revenue (billion), by End-user Industry 2025 & 2033
- Figure 20: North America Recovered Carbon Black Market Volume (K Tons), by End-user Industry 2025 & 2033
- Figure 21: North America Recovered Carbon Black Market Revenue Share (%), by End-user Industry 2025 & 2033
- Figure 22: North America Recovered Carbon Black Market Volume Share (%), by End-user Industry 2025 & 2033
- Figure 23: North America Recovered Carbon Black Market Revenue (billion), by Country 2025 & 2033
- Figure 24: North America Recovered Carbon Black Market Volume (K Tons), by Country 2025 & 2033
- Figure 25: North America Recovered Carbon Black Market Revenue Share (%), by Country 2025 & 2033
- Figure 26: North America Recovered Carbon Black Market Volume Share (%), by Country 2025 & 2033
- Figure 27: Europe Recovered Carbon Black Market Revenue (billion), by Application 2025 & 2033
- Figure 28: Europe Recovered Carbon Black Market Volume (K Tons), by Application 2025 & 2033
- Figure 29: Europe Recovered Carbon Black Market Revenue Share (%), by Application 2025 & 2033
- Figure 30: Europe Recovered Carbon Black Market Volume Share (%), by Application 2025 & 2033
- Figure 31: Europe Recovered Carbon Black Market Revenue (billion), by End-user Industry 2025 & 2033
- Figure 32: Europe Recovered Carbon Black Market Volume (K Tons), by End-user Industry 2025 & 2033
- Figure 33: Europe Recovered Carbon Black Market Revenue Share (%), by End-user Industry 2025 & 2033
- Figure 34: Europe Recovered Carbon Black Market Volume Share (%), by End-user Industry 2025 & 2033
- Figure 35: Europe Recovered Carbon Black Market Revenue (billion), by Country 2025 & 2033
- Figure 36: Europe Recovered Carbon Black Market Volume (K Tons), by Country 2025 & 2033
- Figure 37: Europe Recovered Carbon Black Market Revenue Share (%), by Country 2025 & 2033
- Figure 38: Europe Recovered Carbon Black Market Volume Share (%), by Country 2025 & 2033
- Figure 39: South America Recovered Carbon Black Market Revenue (billion), by Application 2025 & 2033
- Figure 40: South America Recovered Carbon Black Market Volume (K Tons), by Application 2025 & 2033
- Figure 41: South America Recovered Carbon Black Market Revenue Share (%), by Application 2025 & 2033
- Figure 42: South America Recovered Carbon Black Market Volume Share (%), by Application 2025 & 2033
- Figure 43: South America Recovered Carbon Black Market Revenue (billion), by End-user Industry 2025 & 2033
- Figure 44: South America Recovered Carbon Black Market Volume (K Tons), by End-user Industry 2025 & 2033
- Figure 45: South America Recovered Carbon Black Market Revenue Share (%), by End-user Industry 2025 & 2033
- Figure 46: South America Recovered Carbon Black Market Volume Share (%), by End-user Industry 2025 & 2033
- Figure 47: South America Recovered Carbon Black Market Revenue (billion), by Country 2025 & 2033
- Figure 48: South America Recovered Carbon Black Market Volume (K Tons), by Country 2025 & 2033
- Figure 49: South America Recovered Carbon Black Market Revenue Share (%), by Country 2025 & 2033
- Figure 50: South America Recovered Carbon Black Market Volume Share (%), by Country 2025 & 2033
- Figure 51: Middle East and Africa Recovered Carbon Black Market Revenue (billion), by Application 2025 & 2033
- Figure 52: Middle East and Africa Recovered Carbon Black Market Volume (K Tons), by Application 2025 & 2033
- Figure 53: Middle East and Africa Recovered Carbon Black Market Revenue Share (%), by Application 2025 & 2033
- Figure 54: Middle East and Africa Recovered Carbon Black Market Volume Share (%), by Application 2025 & 2033
- Figure 55: Middle East and Africa Recovered Carbon Black Market Revenue (billion), by End-user Industry 2025 & 2033
- Figure 56: Middle East and Africa Recovered Carbon Black Market Volume (K Tons), by End-user Industry 2025 & 2033
- Figure 57: Middle East and Africa Recovered Carbon Black Market Revenue Share (%), by End-user Industry 2025 & 2033
- Figure 58: Middle East and Africa Recovered Carbon Black Market Volume Share (%), by End-user Industry 2025 & 2033
- Figure 59: Middle East and Africa Recovered Carbon Black Market Revenue (billion), by Country 2025 & 2033
- Figure 60: Middle East and Africa Recovered Carbon Black Market Volume (K Tons), by Country 2025 & 2033
- Figure 61: Middle East and Africa Recovered Carbon Black Market Revenue Share (%), by Country 2025 & 2033
- Figure 62: Middle East and Africa Recovered Carbon Black Market Volume Share (%), by Country 2025 & 2033
List of Tables
- Table 1: Global Recovered Carbon Black Market Revenue billion Forecast, by Application 2020 & 2033
- Table 2: Global Recovered Carbon Black Market Volume K Tons Forecast, by Application 2020 & 2033
- Table 3: Global Recovered Carbon Black Market Revenue billion Forecast, by End-user Industry 2020 & 2033
- Table 4: Global Recovered Carbon Black Market Volume K Tons Forecast, by End-user Industry 2020 & 2033
- Table 5: Global Recovered Carbon Black Market Revenue billion Forecast, by Region 2020 & 2033
- Table 6: Global Recovered Carbon Black Market Volume K Tons Forecast, by Region 2020 & 2033
- Table 7: Global Recovered Carbon Black Market Revenue billion Forecast, by Application 2020 & 2033
- Table 8: Global Recovered Carbon Black Market Volume K Tons Forecast, by Application 2020 & 2033
- Table 9: Global Recovered Carbon Black Market Revenue billion Forecast, by End-user Industry 2020 & 2033
- Table 10: Global Recovered Carbon Black Market Volume K Tons Forecast, by End-user Industry 2020 & 2033
- Table 11: Global Recovered Carbon Black Market Revenue billion Forecast, by Country 2020 & 2033
- Table 12: Global Recovered Carbon Black Market Volume K Tons Forecast, by Country 2020 & 2033
- Table 13: China Recovered Carbon Black Market Revenue (billion) Forecast, by Application 2020 & 2033
- Table 14: China Recovered Carbon Black Market Volume (K Tons) Forecast, by Application 2020 & 2033
- Table 15: India Recovered Carbon Black Market Revenue (billion) Forecast, by Application 2020 & 2033
- Table 16: India Recovered Carbon Black Market Volume (K Tons) Forecast, by Application 2020 & 2033
- Table 17: Japan Recovered Carbon Black Market Revenue (billion) Forecast, by Application 2020 & 2033
- Table 18: Japan Recovered Carbon Black Market Volume (K Tons) Forecast, by Application 2020 & 2033
- Table 19: South Korea Recovered Carbon Black Market Revenue (billion) Forecast, by Application 2020 & 2033
- Table 20: South Korea Recovered Carbon Black Market Volume (K Tons) Forecast, by Application 2020 & 2033
- Table 21: Rest of Asia Pacific Recovered Carbon Black Market Revenue (billion) Forecast, by Application 2020 & 2033
- Table 22: Rest of Asia Pacific Recovered Carbon Black Market Volume (K Tons) Forecast, by Application 2020 & 2033
- Table 23: Global Recovered Carbon Black Market Revenue billion Forecast, by Application 2020 & 2033
- Table 24: Global Recovered Carbon Black Market Volume K Tons Forecast, by Application 2020 & 2033
- Table 25: Global Recovered Carbon Black Market Revenue billion Forecast, by End-user Industry 2020 & 2033
- Table 26: Global Recovered Carbon Black Market Volume K Tons Forecast, by End-user Industry 2020 & 2033
- Table 27: Global Recovered Carbon Black Market Revenue billion Forecast, by Country 2020 & 2033
- Table 28: Global Recovered Carbon Black Market Volume K Tons Forecast, by Country 2020 & 2033
- Table 29: United States Recovered Carbon Black Market Revenue (billion) Forecast, by Application 2020 & 2033
- Table 30: United States Recovered Carbon Black Market Volume (K Tons) Forecast, by Application 2020 & 2033
- Table 31: Canada Recovered Carbon Black Market Revenue (billion) Forecast, by Application 2020 & 2033
- Table 32: Canada Recovered Carbon Black Market Volume (K Tons) Forecast, by Application 2020 & 2033
- Table 33: Mexico Recovered Carbon Black Market Revenue (billion) Forecast, by Application 2020 & 2033
- Table 34: Mexico Recovered Carbon Black Market Volume (K Tons) Forecast, by Application 2020 & 2033
- Table 35: Global Recovered Carbon Black Market Revenue billion Forecast, by Application 2020 & 2033
- Table 36: Global Recovered Carbon Black Market Volume K Tons Forecast, by Application 2020 & 2033
- Table 37: Global Recovered Carbon Black Market Revenue billion Forecast, by End-user Industry 2020 & 2033
- Table 38: Global Recovered Carbon Black Market Volume K Tons Forecast, by End-user Industry 2020 & 2033
- Table 39: Global Recovered Carbon Black Market Revenue billion Forecast, by Country 2020 & 2033
- Table 40: Global Recovered Carbon Black Market Volume K Tons Forecast, by Country 2020 & 2033
- Table 41: Germany Recovered Carbon Black Market Revenue (billion) Forecast, by Application 2020 & 2033
- Table 42: Germany Recovered Carbon Black Market Volume (K Tons) Forecast, by Application 2020 & 2033
- Table 43: United Kingdom Recovered Carbon Black Market Revenue (billion) Forecast, by Application 2020 & 2033
- Table 44: United Kingdom Recovered Carbon Black Market Volume (K Tons) Forecast, by Application 2020 & 2033
- Table 45: Italy Recovered Carbon Black Market Revenue (billion) Forecast, by Application 2020 & 2033
- Table 46: Italy Recovered Carbon Black Market Volume (K Tons) Forecast, by Application 2020 & 2033
- Table 47: France Recovered Carbon Black Market Revenue (billion) Forecast, by Application 2020 & 2033
- Table 48: France Recovered Carbon Black Market Volume (K Tons) Forecast, by Application 2020 & 2033
- Table 49: Rest of Europe Recovered Carbon Black Market Revenue (billion) Forecast, by Application 2020 & 2033
- Table 50: Rest of Europe Recovered Carbon Black Market Volume (K Tons) Forecast, by Application 2020 & 2033
- Table 51: Global Recovered Carbon Black Market Revenue billion Forecast, by Application 2020 & 2033
- Table 52: Global Recovered Carbon Black Market Volume K Tons Forecast, by Application 2020 & 2033
- Table 53: Global Recovered Carbon Black Market Revenue billion Forecast, by End-user Industry 2020 & 2033
- Table 54: Global Recovered Carbon Black Market Volume K Tons Forecast, by End-user Industry 2020 & 2033
- Table 55: Global Recovered Carbon Black Market Revenue billion Forecast, by Country 2020 & 2033
- Table 56: Global Recovered Carbon Black Market Volume K Tons Forecast, by Country 2020 & 2033
- Table 57: Brazil Recovered Carbon Black Market Revenue (billion) Forecast, by Application 2020 & 2033
- Table 58: Brazil Recovered Carbon Black Market Volume (K Tons) Forecast, by Application 2020 & 2033
- Table 59: Argentina Recovered Carbon Black Market Revenue (billion) Forecast, by Application 2020 & 2033
- Table 60: Argentina Recovered Carbon Black Market Volume (K Tons) Forecast, by Application 2020 & 2033
- Table 61: Rest of South America Recovered Carbon Black Market Revenue (billion) Forecast, by Application 2020 & 2033
- Table 62: Rest of South America Recovered Carbon Black Market Volume (K Tons) Forecast, by Application 2020 & 2033
- Table 63: Global Recovered Carbon Black Market Revenue billion Forecast, by Application 2020 & 2033
- Table 64: Global Recovered Carbon Black Market Volume K Tons Forecast, by Application 2020 & 2033
- Table 65: Global Recovered Carbon Black Market Revenue billion Forecast, by End-user Industry 2020 & 2033
- Table 66: Global Recovered Carbon Black Market Volume K Tons Forecast, by End-user Industry 2020 & 2033
- Table 67: Global Recovered Carbon Black Market Revenue billion Forecast, by Country 2020 & 2033
- Table 68: Global Recovered Carbon Black Market Volume K Tons Forecast, by Country 2020 & 2033
- Table 69: Saudi Arabia Recovered Carbon Black Market Revenue (billion) Forecast, by Application 2020 & 2033
- Table 70: Saudi Arabia Recovered Carbon Black Market Volume (K Tons) Forecast, by Application 2020 & 2033
- Table 71: South Africa Recovered Carbon Black Market Revenue (billion) Forecast, by Application 2020 & 2033
- Table 72: South Africa Recovered Carbon Black Market Volume (K Tons) Forecast, by Application 2020 & 2033
- Table 73: Rest of Middle East and Africa Recovered Carbon Black Market Revenue (billion) Forecast, by Application 2020 & 2033
- Table 74: Rest of Middle East and Africa Recovered Carbon Black Market Volume (K Tons) Forecast, by Application 2020 & 2033
Frequently Asked Questions
1. What is the projected Compound Annual Growth Rate (CAGR) of the Recovered Carbon Black Market?
The projected CAGR is approximately 4.8%.
2. Which companies are prominent players in the Recovered Carbon Black Market?
Key companies in the market include Enrestec Inc, Strebl Green Carbon Pte Ltd, Black Bear Carbon B V, Dron Industries, Pyrum Innovations AG, Carbon Recovery GmbH, DVA Renewable Energy JSC, SR2O Holdings LLC, Klean Industries Inc, Polimix, Delta Energy LLC, Reoil Sp z o o, Bolder Industries, Scandinavian Enviro Systems AB, Alpha Carbone.
3. What are the main segments of the Recovered Carbon Black Market?
The market segments include Application, End-user Industry.
4. Can you provide details about the market size?
The market size is estimated to be USD 14.5 billion as of 2022.
5. What are some drivers contributing to market growth?
Rising Demand for Recycled and Recovered Products; Increasing Usages as Sustainable Filler in Tire and Non-tire Rubber Applications.
6. What are the notable trends driving market growth?
Increasing Usage in the Tire Industry.
7. Are there any restraints impacting market growth?
Lack of Infrastructure and Technologies for Recovered Carbon Black; Providing Consistent Quality of Recovered Carbon Black.
8. Can you provide examples of recent developments in the market?
In May 2022, Pyrum Innovations AG started the test operation of a new pelletizer at its plant site in Germany, which will enable the recovered carbon black (rCB) obtained via the pyrolysis process to be bonded into pellets, to increase their transportability and facilitates the further processing of the raw material.
9. What pricing options are available for accessing the report?
Pricing options include single-user, multi-user, and enterprise licenses priced at USD 4750, USD 5250, and USD 8750 respectively.
10. Is the market size provided in terms of value or volume?
The market size is provided in terms of value, measured in billion and volume, measured in K Tons.
11. Are there any specific market keywords associated with the report?
Yes, the market keyword associated with the report is "Recovered Carbon Black Market," which aids in identifying and referencing the specific market segment covered.
12. How do I determine which pricing option suits my needs best?
The pricing options vary based on user requirements and access needs. Individual users may opt for single-user licenses, while businesses requiring broader access may choose multi-user or enterprise licenses for cost-effective access to the report.
13. Are there any additional resources or data provided in the Recovered Carbon Black Market report?
While the report offers comprehensive insights, it's advisable to review the specific contents or supplementary materials provided to ascertain if additional resources or data are available.
14. How can I stay updated on further developments or reports in the Recovered Carbon Black Market?
To stay informed about further developments, trends, and reports in the Recovered Carbon Black Market, consider subscribing to industry newsletters, following relevant companies and organizations, or regularly checking reputable industry news sources and publications.
Methodology
Step 1 - Identification of Relevant Samples Size from Population Database


Step 2 - Approaches for Defining Global Market Size (Value, Volume* & Price*)

Note*: In applicable scenarios
Step 3 - Data Sources
Primary Research
- Web Analytics
- Survey Reports
- Research Institute
- Latest Research Reports
- Opinion Leaders
Secondary Research
- Annual Reports
- White Paper
- Latest Press Release
- Industry Association
- Paid Database
- Investor Presentations

Step 4 - Data Triangulation
Involves using different sources of information in order to increase the validity of a study
These sources are likely to be stakeholders in a program - participants, other researchers, program staff, other community members, and so on.
Then we put all data in single framework & apply various statistical tools to find out the dynamic on the market.
During the analysis stage, feedback from the stakeholder groups would be compared to determine areas of agreement as well as areas of divergence