

Key Insights
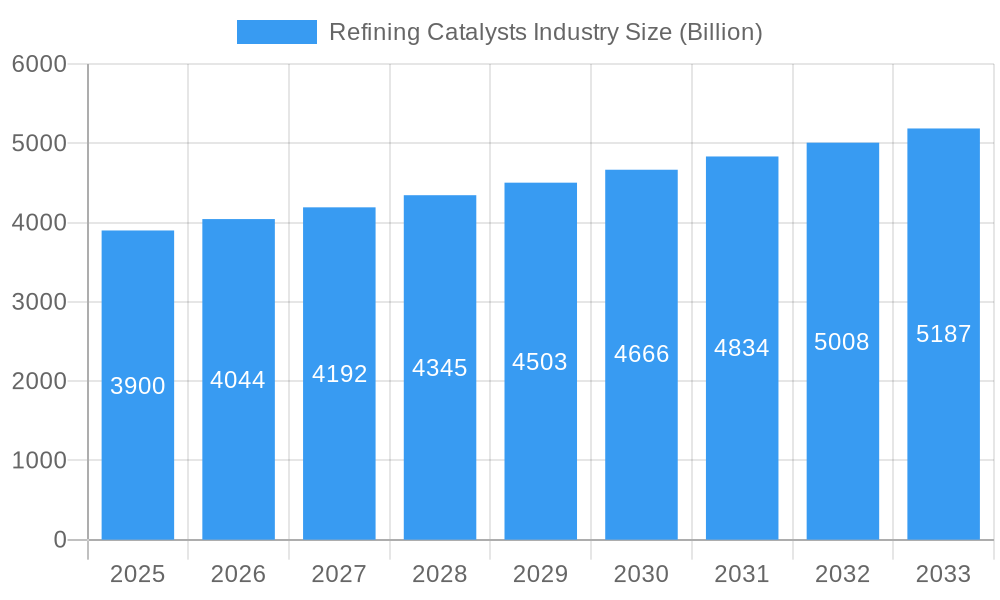
The global refining catalysts market, valued at $3.9 billion in 2025, is projected to experience steady growth, driven by increasing demand for cleaner fuels and stringent environmental regulations. This necessitates the use of advanced catalysts to optimize refinery processes and reduce emissions of pollutants like sulfur and nitrogen oxides. The market's Compound Annual Growth Rate (CAGR) of 3.69% from 2025 to 2033 indicates a consistent expansion, fueled by several key factors. Growth in the petrochemical and transportation sectors, coupled with rising investments in refinery upgrades and expansions, especially in developing economies of Asia-Pacific, are significant contributors. Technological advancements in catalyst formulations, such as the development of more efficient and durable CoMo, NiMo, and zeolite-based catalysts, are also enhancing market prospects. While the market faces challenges from fluctuating crude oil prices and the potential for stricter regulations impacting catalyst production, the long-term outlook remains positive due to the enduring need for efficient and environmentally friendly refining processes. The various segments within the market, including hydrotreating, fluid catalytic cracking (FCC), and residue fluid catalytic cracking (RFCC) processes, will likely experience varying growth rates depending on refinery configurations and regional priorities.
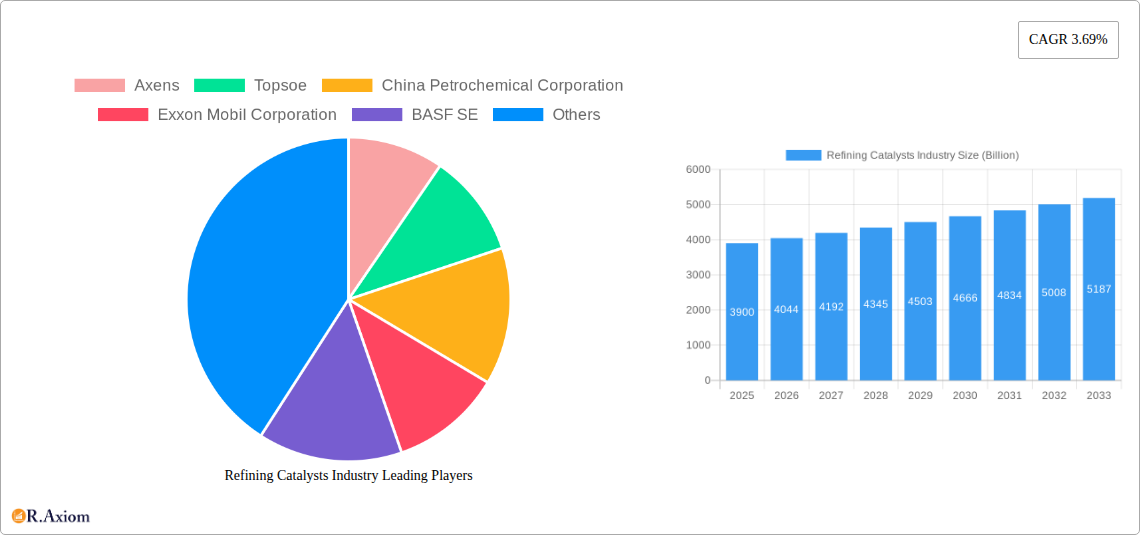
Refining Catalysts Industry Market Size (In Billion)
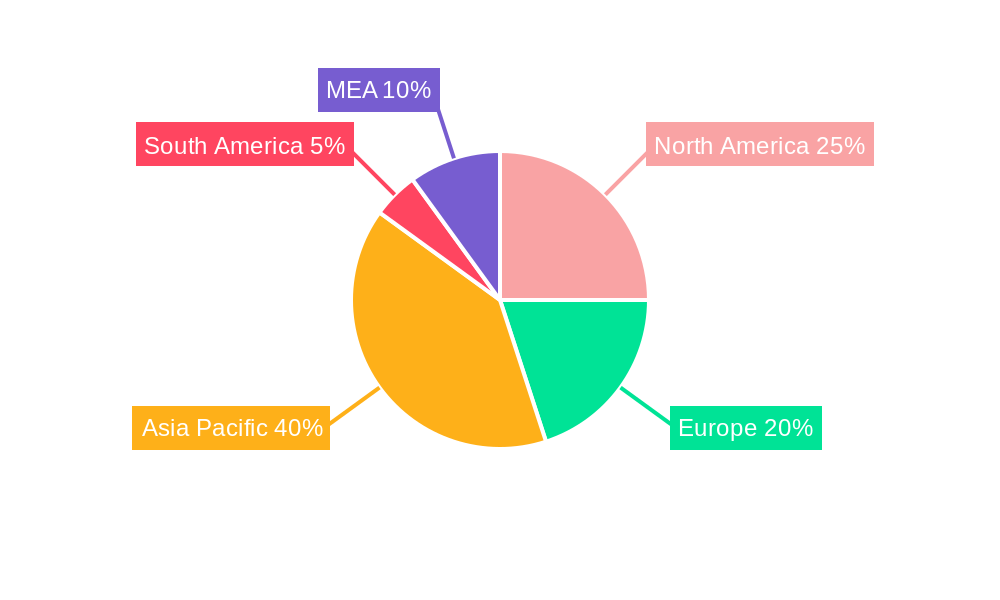
The competitive landscape is characterized by a mix of established multinational corporations and specialized catalyst manufacturers. Major players like Axens, Topsoe, and ExxonMobil are heavily invested in R&D, aiming to maintain market leadership through innovation and supply chain optimization. Regional differences in demand are expected, with Asia-Pacific experiencing robust growth due to its expanding refining capacity, followed by North America and Europe. However, the South American and MEA regions will likely witness slower growth, due to less developed refining infrastructures. The forecast period of 2025-2033 will witness a continuous evolution in catalyst technology, focusing on improved selectivity, longevity, and reduced environmental impact. This will inevitably drive further market expansion and reshape the competitive dynamics within the industry.
Refining Catalysts Industry Company Market Share
Refining Catalysts Industry: A Comprehensive Market Report (2019-2033)
This comprehensive report provides an in-depth analysis of the global refining catalysts market, encompassing historical data (2019-2024), current estimates (2025), and future projections (2025-2033). The study covers key market segments, leading players, and emerging trends, offering actionable insights for industry stakeholders. The market is expected to reach a value exceeding $XX Billion by 2033, exhibiting a CAGR of XX% during the forecast period.
Refining Catalysts Industry Market Concentration & Innovation
The refining catalysts market demonstrates moderate concentration, with key players like Axens, Topsoe, and BASF SE holding significant market share. However, the presence of several regional and specialized players fosters competition. Innovation is driven by stringent environmental regulations mandating cleaner fuel production, coupled with the need for enhanced catalyst efficiency and longevity.
- Market Share: Top 3 players collectively hold approximately XX% of the global market share in 2025.
- M&A Activity: The historical period (2019-2024) witnessed XX Billion in M&A deals, primarily focused on acquiring specialized technologies and expanding geographical reach. Projected M&A activity for 2025-2033 is estimated at XX Billion.
- Regulatory Landscape: Stringent emission standards and increasing focus on sustainability are key regulatory drivers, pushing innovation towards more efficient and environmentally friendly catalysts.
- Product Substitutes: While limited direct substitutes exist, the focus is shifting towards improving existing catalyst technologies to enhance performance and reduce costs.
- End-User Trends: Refineries are increasingly demanding catalysts offering improved yield, selectivity, and longer lifespan to optimize operational efficiency and reduce costs.
Refining Catalysts Industry Industry Trends & Insights
The refining catalysts market is experiencing robust growth fueled by increasing global demand for transportation fuels and petrochemicals. Technological advancements are driving efficiency gains, while consumer preferences for cleaner fuels are influencing catalyst development. The market is characterized by intense competition, with companies focusing on product differentiation and cost optimization.
- Market Growth Drivers: Growing global demand for transportation fuels, stringent environmental regulations, and advancements in catalyst technology are key growth drivers.
- Technological Disruptions: The development of advanced catalyst formulations, such as those incorporating nanotechnology and machine learning for optimized design, is disrupting the market.
- Consumer Preferences: The increasing demand for cleaner fuels is propelling the development of catalysts that minimize pollutants and enhance fuel quality.
- Competitive Dynamics: The market is highly competitive, with major players focusing on strategic partnerships, R&D investments, and geographical expansion.
Dominant Markets & Segments in Refining Catalysts Industry
The Asia-Pacific region is the dominant market, driven by rapid industrialization and expanding refining capacity. Within product segments, Hydrotreating catalysts (CoMo and NiMo) dominate due to their widespread application in various refining processes.
- Leading Region: Asia-Pacific, driven by robust economic growth and increasing refining capacity.
- Leading Country: China, owing to its massive refining sector and strong government support for industrial expansion.
- Leading Product Segment: Hydrotreating catalysts (CoMo and NiMo) hold the largest market share due to their extensive use in removing sulfur and nitrogen from petroleum feedstocks. Other significant segments include Alumina-based Noble Metal, NiW, and Zeolites.
- Leading Process Segment: Hydrotreating processes remain dominant due to their essential role in producing cleaner fuels.
- Leading Residual Feed Segment: FCC (Fluid Catalytic Cracking) remains the largest residual feed segment due to its widespread application in refineries worldwide.
Key Drivers:
- Economic Policies: Government incentives and support for refinery modernization and expansion.
- Infrastructure Development: Investments in new refineries and upgrades to existing facilities.
Refining Catalysts Industry Product Developments
Recent innovations focus on enhancing catalyst performance, extending lifespan, and improving selectivity. This includes the development of multi-functional catalysts and the integration of advanced materials. The market is seeing a growing emphasis on catalysts designed for processing heavier and more complex feedstocks, catering to the trend of utilizing lower-quality crude oils. BASF's recent launch of Fourtitude showcases this trend, demonstrating a focus on maximizing valuable byproducts from resid feedstocks.
Report Scope & Segmentation Analysis
The report provides a granular segmentation analysis across various parameters:
- Product: CoMo, NiMo, Alumina-based Noble Metal, NiW, Zeolites, Other Products. Each segment's growth is projected based on specific application and market demand. The market size and competitive landscape are detailed for each.
- Process: Hydrotreating, Fluid Catalytic Cracking (FCC), Residue Fluid Catalytic Cracking (RFCC), Hydrocracking. Growth projections consider the evolving refining landscape and technological advancements in each process.
- Residual Feed: FCC, RFCC, Hydrocracking. Analysis considers the impact of feedstock characteristics on catalyst selection and performance.
Key Drivers of Refining Catalysts Industry Growth
The growth of the refining catalysts industry is primarily driven by factors such as stringent environmental regulations pushing for cleaner fuels, the increasing demand for transportation fuels, and technological advancements leading to improved catalyst efficiency and cost reduction. Government policies supporting refinery modernization also contribute significantly to market growth.
Challenges in the Refining Catalysts Industry Sector
Key challenges include volatile raw material prices, intense competition among catalyst manufacturers, and stringent environmental regulations. Supply chain disruptions and the increasing complexity of feedstocks also pose significant hurdles, potentially impacting production costs and margins. These factors are estimated to impact market growth by XX% over the next decade.
Emerging Opportunities in Refining Catalysts Industry
Emerging opportunities lie in the development of advanced catalysts for processing heavier feedstocks, the integration of renewable feedstocks into refining processes, and the use of advanced materials and technologies to improve catalyst performance and lifespan. The growth of biofuels and the transition towards cleaner energy sources also presents significant opportunities.
Leading Players in the Refining Catalysts Industry Market
- Axens
- Topsoe
- China Petrochemical Corporation
- Exxon Mobil Corporation
- BASF SE
- Honeywell International
- Chevron Lummus Global (CLG)
- JGC C & C
- Royal Dutch Shell PLC
- Johnson Matthey
- KNT Group
- W R Grace & Co -Conn
- Albemarle Corporation
Key Developments in Refining Catalysts Industry Industry
- March 2022: BASF launched Fourtitude, a new Fluid Catalytic Cracking (FCC) catalyst designed to maximize butylenes from resid feedstocks. This launch signifies a shift towards catalysts optimized for processing heavier feedstocks and maximizing valuable byproducts.
Strategic Outlook for Refining Catalysts Industry Market
The refining catalysts market is poised for continued growth, driven by factors such as increasing demand for cleaner fuels, technological advancements, and the need for efficient and cost-effective refining processes. Strategic investments in R&D, coupled with strategic partnerships and acquisitions, will be crucial for players to maintain a competitive edge in this dynamic market. The focus on sustainability and environmental compliance will further shape future market dynamics.
Refining Catalysts Industry Segmentation
-
1. Product
- 1.1. CoMo
- 1.2. NiMo
- 1.3. Alumina-based Noble Metal
- 1.4. NiW
- 1.5. Zeolites
- 1.6. Other Products
-
2. Process
-
2.1. Hydrotreating
- 2.1.1. Gasoline
- 2.1.2. Kerosene
- 2.1.3. Diesel
- 2.1.4. Vacuum Gas Oil
- 2.1.5. Catalytic Cracking Gasoline
- 2.1.6. Residual Feed
- 2.2. Fluid Catalytic Cracking (FCC)
- 2.3. Residue Fluid Catalytic Cracking (RFCC)
- 2.4. Hydrocracking
-
2.1. Hydrotreating
Refining Catalysts Industry Segmentation By Geography
-
1. Asia Pacific
- 1.1. China
- 1.2. India
- 1.3. Japan
- 1.4. South Korea
- 1.5. ASEAN Countries
- 1.6. Rest of Asia Pacific
-
2. North America
- 2.1. United States
- 2.2. Canada
- 2.3. Mexico
-
3. Europe
- 3.1. Germany
- 3.2. United Kingdom
- 3.3. Italy
- 3.4. France
- 3.5. Spain
- 3.6. Russia
- 3.7. Rest of Europe
-
4. South America
- 4.1. Brazil
- 4.2. Argentina
- 4.3. Rest of South America
-
5. Middle East and Africa
- 5.1. Saudi Arabia
- 5.2. South Africa
- 5.3. Rest of Middle East and Africa
Refining Catalysts Industry Regional Market Share
Geographic Coverage of Refining Catalysts Industry
Refining Catalysts Industry REPORT HIGHLIGHTS
| Aspects | Details |
|---|---|
| Study Period | 2020-2034 |
| Base Year | 2025 |
| Estimated Year | 2026 |
| Forecast Period | 2026-2034 |
| Historical Period | 2020-2025 |
| Growth Rate | CAGR of 3.69% from 2020-2034 |
| Segmentation |
|
Table of Contents
- 1. Introduction
- 1.1. Research Scope
- 1.2. Market Segmentation
- 1.3. Research Objective
- 1.4. Definitions and Assumptions
- 2. Executive Summary
- 2.1. Market Snapshot
- 3. Market Dynamics
- 3.1. Market Drivers
- 3.2. Market Restrains
- 3.3. Market Trends
- 3.4. Market Opportunities
- 4. Market Factor Analysis
- 4.1. Porters Five Forces
- 4.1.1. Bargaining Power of Suppliers
- 4.1.2. Bargaining Power of Buyers
- 4.1.3. Threat of New Entrants
- 4.1.4. Threat of Substitutes
- 4.1.5. Competitive Rivalry
- 4.2. PESTEL analysis
- 4.3. BCG Analysis
- 4.3.1. Stars (High Growth, High Market Share)
- 4.3.2. Cash Cows (Low Growth, High Market Share)
- 4.3.3. Question Mark (High Growth, Low Market Share)
- 4.3.4. Dogs (Low Growth, Low Market Share)
- 4.4. Ansoff Matrix Analysis
- 4.5. Supply Chain Analysis
- 4.6. Regulatory Landscape
- 4.7. Current Market Potential and Opportunity Assessment (TAM–SAM–SOM Framework)
- 4.8. RAX Analyst Note
- 4.1. Porters Five Forces
- 5. Market Analysis, Insights and Forecast 2021-2033
- 5.1. Market Analysis, Insights and Forecast - by Product
- 5.1.1. CoMo
- 5.1.2. NiMo
- 5.1.3. Alumina-based Noble Metal
- 5.1.4. NiW
- 5.1.5. Zeolites
- 5.1.6. Other Products
- 5.2. Market Analysis, Insights and Forecast - by Process
- 5.2.1. Hydrotreating
- 5.2.1.1. Gasoline
- 5.2.1.2. Kerosene
- 5.2.1.3. Diesel
- 5.2.1.4. Vacuum Gas Oil
- 5.2.1.5. Catalytic Cracking Gasoline
- 5.2.1.6. Residual Feed
- 5.2.2. Fluid Catalytic Cracking (FCC)
- 5.2.3. Residue Fluid Catalytic Cracking (RFCC)
- 5.2.4. Hydrocracking
- 5.2.1. Hydrotreating
- 5.3. Market Analysis, Insights and Forecast - by Region
- 5.3.1. Asia Pacific
- 5.3.2. North America
- 5.3.3. Europe
- 5.3.4. South America
- 5.3.5. Middle East and Africa
- 5.1. Market Analysis, Insights and Forecast - by Product
- 6. Global Refining Catalysts Industry Analysis, Insights and Forecast, 2021-2033
- 6.1. Market Analysis, Insights and Forecast - by Product
- 6.1.1. CoMo
- 6.1.2. NiMo
- 6.1.3. Alumina-based Noble Metal
- 6.1.4. NiW
- 6.1.5. Zeolites
- 6.1.6. Other Products
- 6.2. Market Analysis, Insights and Forecast - by Process
- 6.2.1. Hydrotreating
- 6.2.1.1. Gasoline
- 6.2.1.2. Kerosene
- 6.2.1.3. Diesel
- 6.2.1.4. Vacuum Gas Oil
- 6.2.1.5. Catalytic Cracking Gasoline
- 6.2.1.6. Residual Feed
- 6.2.2. Fluid Catalytic Cracking (FCC)
- 6.2.3. Residue Fluid Catalytic Cracking (RFCC)
- 6.2.4. Hydrocracking
- 6.2.1. Hydrotreating
- 6.1. Market Analysis, Insights and Forecast - by Product
- 7. Asia Pacific Refining Catalysts Industry Analysis, Insights and Forecast, 2020-2032
- 7.1. Market Analysis, Insights and Forecast - by Product
- 7.1.1. CoMo
- 7.1.2. NiMo
- 7.1.3. Alumina-based Noble Metal
- 7.1.4. NiW
- 7.1.5. Zeolites
- 7.1.6. Other Products
- 7.2. Market Analysis, Insights and Forecast - by Process
- 7.2.1. Hydrotreating
- 7.2.1.1. Gasoline
- 7.2.1.2. Kerosene
- 7.2.1.3. Diesel
- 7.2.1.4. Vacuum Gas Oil
- 7.2.1.5. Catalytic Cracking Gasoline
- 7.2.1.6. Residual Feed
- 7.2.2. Fluid Catalytic Cracking (FCC)
- 7.2.3. Residue Fluid Catalytic Cracking (RFCC)
- 7.2.4. Hydrocracking
- 7.2.1. Hydrotreating
- 7.1. Market Analysis, Insights and Forecast - by Product
- 8. North America Refining Catalysts Industry Analysis, Insights and Forecast, 2020-2032
- 8.1. Market Analysis, Insights and Forecast - by Product
- 8.1.1. CoMo
- 8.1.2. NiMo
- 8.1.3. Alumina-based Noble Metal
- 8.1.4. NiW
- 8.1.5. Zeolites
- 8.1.6. Other Products
- 8.2. Market Analysis, Insights and Forecast - by Process
- 8.2.1. Hydrotreating
- 8.2.1.1. Gasoline
- 8.2.1.2. Kerosene
- 8.2.1.3. Diesel
- 8.2.1.4. Vacuum Gas Oil
- 8.2.1.5. Catalytic Cracking Gasoline
- 8.2.1.6. Residual Feed
- 8.2.2. Fluid Catalytic Cracking (FCC)
- 8.2.3. Residue Fluid Catalytic Cracking (RFCC)
- 8.2.4. Hydrocracking
- 8.2.1. Hydrotreating
- 8.1. Market Analysis, Insights and Forecast - by Product
- 9. Europe Refining Catalysts Industry Analysis, Insights and Forecast, 2020-2032
- 9.1. Market Analysis, Insights and Forecast - by Product
- 9.1.1. CoMo
- 9.1.2. NiMo
- 9.1.3. Alumina-based Noble Metal
- 9.1.4. NiW
- 9.1.5. Zeolites
- 9.1.6. Other Products
- 9.2. Market Analysis, Insights and Forecast - by Process
- 9.2.1. Hydrotreating
- 9.2.1.1. Gasoline
- 9.2.1.2. Kerosene
- 9.2.1.3. Diesel
- 9.2.1.4. Vacuum Gas Oil
- 9.2.1.5. Catalytic Cracking Gasoline
- 9.2.1.6. Residual Feed
- 9.2.2. Fluid Catalytic Cracking (FCC)
- 9.2.3. Residue Fluid Catalytic Cracking (RFCC)
- 9.2.4. Hydrocracking
- 9.2.1. Hydrotreating
- 9.1. Market Analysis, Insights and Forecast - by Product
- 10. South America Refining Catalysts Industry Analysis, Insights and Forecast, 2020-2032
- 10.1. Market Analysis, Insights and Forecast - by Product
- 10.1.1. CoMo
- 10.1.2. NiMo
- 10.1.3. Alumina-based Noble Metal
- 10.1.4. NiW
- 10.1.5. Zeolites
- 10.1.6. Other Products
- 10.2. Market Analysis, Insights and Forecast - by Process
- 10.2.1. Hydrotreating
- 10.2.1.1. Gasoline
- 10.2.1.2. Kerosene
- 10.2.1.3. Diesel
- 10.2.1.4. Vacuum Gas Oil
- 10.2.1.5. Catalytic Cracking Gasoline
- 10.2.1.6. Residual Feed
- 10.2.2. Fluid Catalytic Cracking (FCC)
- 10.2.3. Residue Fluid Catalytic Cracking (RFCC)
- 10.2.4. Hydrocracking
- 10.2.1. Hydrotreating
- 10.1. Market Analysis, Insights and Forecast - by Product
- 11. Middle East and Africa Refining Catalysts Industry Analysis, Insights and Forecast, 2020-2032
- 11.1. Market Analysis, Insights and Forecast - by Product
- 11.1.1. CoMo
- 11.1.2. NiMo
- 11.1.3. Alumina-based Noble Metal
- 11.1.4. NiW
- 11.1.5. Zeolites
- 11.1.6. Other Products
- 11.2. Market Analysis, Insights and Forecast - by Process
- 11.2.1. Hydrotreating
- 11.2.1.1. Gasoline
- 11.2.1.2. Kerosene
- 11.2.1.3. Diesel
- 11.2.1.4. Vacuum Gas Oil
- 11.2.1.5. Catalytic Cracking Gasoline
- 11.2.1.6. Residual Feed
- 11.2.2. Fluid Catalytic Cracking (FCC)
- 11.2.3. Residue Fluid Catalytic Cracking (RFCC)
- 11.2.4. Hydrocracking
- 11.2.1. Hydrotreating
- 11.1. Market Analysis, Insights and Forecast - by Product
- 12. Competitive Analysis
- 12.1. Company Profiles
- 12.1.1 Axens
- 12.1.1.1. Company Overview
- 12.1.1.2. Products
- 12.1.1.3. Company Financials
- 12.1.1.4. SWOT Analysis
- 12.1.2 Topsoe
- 12.1.2.1. Company Overview
- 12.1.2.2. Products
- 12.1.2.3. Company Financials
- 12.1.2.4. SWOT Analysis
- 12.1.3 China Petrochemical Corporation
- 12.1.3.1. Company Overview
- 12.1.3.2. Products
- 12.1.3.3. Company Financials
- 12.1.3.4. SWOT Analysis
- 12.1.4 Exxon Mobil Corporation
- 12.1.4.1. Company Overview
- 12.1.4.2. Products
- 12.1.4.3. Company Financials
- 12.1.4.4. SWOT Analysis
- 12.1.5 BASF SE
- 12.1.5.1. Company Overview
- 12.1.5.2. Products
- 12.1.5.3. Company Financials
- 12.1.5.4. SWOT Analysis
- 12.1.6 Honeywell International
- 12.1.6.1. Company Overview
- 12.1.6.2. Products
- 12.1.6.3. Company Financials
- 12.1.6.4. SWOT Analysis
- 12.1.7 Chevron Lummus Global (CLG)
- 12.1.7.1. Company Overview
- 12.1.7.2. Products
- 12.1.7.3. Company Financials
- 12.1.7.4. SWOT Analysis
- 12.1.8 JGC C & C
- 12.1.8.1. Company Overview
- 12.1.8.2. Products
- 12.1.8.3. Company Financials
- 12.1.8.4. SWOT Analysis
- 12.1.9 Royal Dutch Shell PLC
- 12.1.9.1. Company Overview
- 12.1.9.2. Products
- 12.1.9.3. Company Financials
- 12.1.9.4. SWOT Analysis
- 12.1.10 Johnson Matthey
- 12.1.10.1. Company Overview
- 12.1.10.2. Products
- 12.1.10.3. Company Financials
- 12.1.10.4. SWOT Analysis
- 12.1.11 KNT Group
- 12.1.11.1. Company Overview
- 12.1.11.2. Products
- 12.1.11.3. Company Financials
- 12.1.11.4. SWOT Analysis
- 12.1.12 W R Grace & Co -Conn
- 12.1.12.1. Company Overview
- 12.1.12.2. Products
- 12.1.12.3. Company Financials
- 12.1.12.4. SWOT Analysis
- 12.1.13 Albemarle Corporation
- 12.1.13.1. Company Overview
- 12.1.13.2. Products
- 12.1.13.3. Company Financials
- 12.1.13.4. SWOT Analysis
- 12.1.1 Axens
- 12.2. Market Entropy
- 12.2.1 Company's Key Areas Served
- 12.2.2 Recent Developments
- 12.3. Company Market Share Analysis 2025
- 12.3.1 Top 5 Companies Market Share Analysis
- 12.3.2 Top 3 Companies Market Share Analysis
- 12.4. List of Potential Customers
- 13. Research Methodology
List of Figures
- Figure 1: Global Refining Catalysts Industry Revenue Breakdown (Billion, %) by Region 2025 & 2033
- Figure 2: Global Refining Catalysts Industry Volume Breakdown (K Tons, %) by Region 2025 & 2033
- Figure 3: Asia Pacific Refining Catalysts Industry Revenue (Billion), by Product 2025 & 2033
- Figure 4: Asia Pacific Refining Catalysts Industry Volume (K Tons), by Product 2025 & 2033
- Figure 5: Asia Pacific Refining Catalysts Industry Revenue Share (%), by Product 2025 & 2033
- Figure 6: Asia Pacific Refining Catalysts Industry Volume Share (%), by Product 2025 & 2033
- Figure 7: Asia Pacific Refining Catalysts Industry Revenue (Billion), by Process 2025 & 2033
- Figure 8: Asia Pacific Refining Catalysts Industry Volume (K Tons), by Process 2025 & 2033
- Figure 9: Asia Pacific Refining Catalysts Industry Revenue Share (%), by Process 2025 & 2033
- Figure 10: Asia Pacific Refining Catalysts Industry Volume Share (%), by Process 2025 & 2033
- Figure 11: Asia Pacific Refining Catalysts Industry Revenue (Billion), by Country 2025 & 2033
- Figure 12: Asia Pacific Refining Catalysts Industry Volume (K Tons), by Country 2025 & 2033
- Figure 13: Asia Pacific Refining Catalysts Industry Revenue Share (%), by Country 2025 & 2033
- Figure 14: Asia Pacific Refining Catalysts Industry Volume Share (%), by Country 2025 & 2033
- Figure 15: North America Refining Catalysts Industry Revenue (Billion), by Product 2025 & 2033
- Figure 16: North America Refining Catalysts Industry Volume (K Tons), by Product 2025 & 2033
- Figure 17: North America Refining Catalysts Industry Revenue Share (%), by Product 2025 & 2033
- Figure 18: North America Refining Catalysts Industry Volume Share (%), by Product 2025 & 2033
- Figure 19: North America Refining Catalysts Industry Revenue (Billion), by Process 2025 & 2033
- Figure 20: North America Refining Catalysts Industry Volume (K Tons), by Process 2025 & 2033
- Figure 21: North America Refining Catalysts Industry Revenue Share (%), by Process 2025 & 2033
- Figure 22: North America Refining Catalysts Industry Volume Share (%), by Process 2025 & 2033
- Figure 23: North America Refining Catalysts Industry Revenue (Billion), by Country 2025 & 2033
- Figure 24: North America Refining Catalysts Industry Volume (K Tons), by Country 2025 & 2033
- Figure 25: North America Refining Catalysts Industry Revenue Share (%), by Country 2025 & 2033
- Figure 26: North America Refining Catalysts Industry Volume Share (%), by Country 2025 & 2033
- Figure 27: Europe Refining Catalysts Industry Revenue (Billion), by Product 2025 & 2033
- Figure 28: Europe Refining Catalysts Industry Volume (K Tons), by Product 2025 & 2033
- Figure 29: Europe Refining Catalysts Industry Revenue Share (%), by Product 2025 & 2033
- Figure 30: Europe Refining Catalysts Industry Volume Share (%), by Product 2025 & 2033
- Figure 31: Europe Refining Catalysts Industry Revenue (Billion), by Process 2025 & 2033
- Figure 32: Europe Refining Catalysts Industry Volume (K Tons), by Process 2025 & 2033
- Figure 33: Europe Refining Catalysts Industry Revenue Share (%), by Process 2025 & 2033
- Figure 34: Europe Refining Catalysts Industry Volume Share (%), by Process 2025 & 2033
- Figure 35: Europe Refining Catalysts Industry Revenue (Billion), by Country 2025 & 2033
- Figure 36: Europe Refining Catalysts Industry Volume (K Tons), by Country 2025 & 2033
- Figure 37: Europe Refining Catalysts Industry Revenue Share (%), by Country 2025 & 2033
- Figure 38: Europe Refining Catalysts Industry Volume Share (%), by Country 2025 & 2033
- Figure 39: South America Refining Catalysts Industry Revenue (Billion), by Product 2025 & 2033
- Figure 40: South America Refining Catalysts Industry Volume (K Tons), by Product 2025 & 2033
- Figure 41: South America Refining Catalysts Industry Revenue Share (%), by Product 2025 & 2033
- Figure 42: South America Refining Catalysts Industry Volume Share (%), by Product 2025 & 2033
- Figure 43: South America Refining Catalysts Industry Revenue (Billion), by Process 2025 & 2033
- Figure 44: South America Refining Catalysts Industry Volume (K Tons), by Process 2025 & 2033
- Figure 45: South America Refining Catalysts Industry Revenue Share (%), by Process 2025 & 2033
- Figure 46: South America Refining Catalysts Industry Volume Share (%), by Process 2025 & 2033
- Figure 47: South America Refining Catalysts Industry Revenue (Billion), by Country 2025 & 2033
- Figure 48: South America Refining Catalysts Industry Volume (K Tons), by Country 2025 & 2033
- Figure 49: South America Refining Catalysts Industry Revenue Share (%), by Country 2025 & 2033
- Figure 50: South America Refining Catalysts Industry Volume Share (%), by Country 2025 & 2033
- Figure 51: Middle East and Africa Refining Catalysts Industry Revenue (Billion), by Product 2025 & 2033
- Figure 52: Middle East and Africa Refining Catalysts Industry Volume (K Tons), by Product 2025 & 2033
- Figure 53: Middle East and Africa Refining Catalysts Industry Revenue Share (%), by Product 2025 & 2033
- Figure 54: Middle East and Africa Refining Catalysts Industry Volume Share (%), by Product 2025 & 2033
- Figure 55: Middle East and Africa Refining Catalysts Industry Revenue (Billion), by Process 2025 & 2033
- Figure 56: Middle East and Africa Refining Catalysts Industry Volume (K Tons), by Process 2025 & 2033
- Figure 57: Middle East and Africa Refining Catalysts Industry Revenue Share (%), by Process 2025 & 2033
- Figure 58: Middle East and Africa Refining Catalysts Industry Volume Share (%), by Process 2025 & 2033
- Figure 59: Middle East and Africa Refining Catalysts Industry Revenue (Billion), by Country 2025 & 2033
- Figure 60: Middle East and Africa Refining Catalysts Industry Volume (K Tons), by Country 2025 & 2033
- Figure 61: Middle East and Africa Refining Catalysts Industry Revenue Share (%), by Country 2025 & 2033
- Figure 62: Middle East and Africa Refining Catalysts Industry Volume Share (%), by Country 2025 & 2033
List of Tables
- Table 1: Global Refining Catalysts Industry Revenue Billion Forecast, by Product 2020 & 2033
- Table 2: Global Refining Catalysts Industry Volume K Tons Forecast, by Product 2020 & 2033
- Table 3: Global Refining Catalysts Industry Revenue Billion Forecast, by Process 2020 & 2033
- Table 4: Global Refining Catalysts Industry Volume K Tons Forecast, by Process 2020 & 2033
- Table 5: Global Refining Catalysts Industry Revenue Billion Forecast, by Region 2020 & 2033
- Table 6: Global Refining Catalysts Industry Volume K Tons Forecast, by Region 2020 & 2033
- Table 7: Global Refining Catalysts Industry Revenue Billion Forecast, by Product 2020 & 2033
- Table 8: Global Refining Catalysts Industry Volume K Tons Forecast, by Product 2020 & 2033
- Table 9: Global Refining Catalysts Industry Revenue Billion Forecast, by Process 2020 & 2033
- Table 10: Global Refining Catalysts Industry Volume K Tons Forecast, by Process 2020 & 2033
- Table 11: Global Refining Catalysts Industry Revenue Billion Forecast, by Country 2020 & 2033
- Table 12: Global Refining Catalysts Industry Volume K Tons Forecast, by Country 2020 & 2033
- Table 13: China Refining Catalysts Industry Revenue (Billion) Forecast, by Application 2020 & 2033
- Table 14: China Refining Catalysts Industry Volume (K Tons) Forecast, by Application 2020 & 2033
- Table 15: India Refining Catalysts Industry Revenue (Billion) Forecast, by Application 2020 & 2033
- Table 16: India Refining Catalysts Industry Volume (K Tons) Forecast, by Application 2020 & 2033
- Table 17: Japan Refining Catalysts Industry Revenue (Billion) Forecast, by Application 2020 & 2033
- Table 18: Japan Refining Catalysts Industry Volume (K Tons) Forecast, by Application 2020 & 2033
- Table 19: South Korea Refining Catalysts Industry Revenue (Billion) Forecast, by Application 2020 & 2033
- Table 20: South Korea Refining Catalysts Industry Volume (K Tons) Forecast, by Application 2020 & 2033
- Table 21: ASEAN Countries Refining Catalysts Industry Revenue (Billion) Forecast, by Application 2020 & 2033
- Table 22: ASEAN Countries Refining Catalysts Industry Volume (K Tons) Forecast, by Application 2020 & 2033
- Table 23: Rest of Asia Pacific Refining Catalysts Industry Revenue (Billion) Forecast, by Application 2020 & 2033
- Table 24: Rest of Asia Pacific Refining Catalysts Industry Volume (K Tons) Forecast, by Application 2020 & 2033
- Table 25: Global Refining Catalysts Industry Revenue Billion Forecast, by Product 2020 & 2033
- Table 26: Global Refining Catalysts Industry Volume K Tons Forecast, by Product 2020 & 2033
- Table 27: Global Refining Catalysts Industry Revenue Billion Forecast, by Process 2020 & 2033
- Table 28: Global Refining Catalysts Industry Volume K Tons Forecast, by Process 2020 & 2033
- Table 29: Global Refining Catalysts Industry Revenue Billion Forecast, by Country 2020 & 2033
- Table 30: Global Refining Catalysts Industry Volume K Tons Forecast, by Country 2020 & 2033
- Table 31: United States Refining Catalysts Industry Revenue (Billion) Forecast, by Application 2020 & 2033
- Table 32: United States Refining Catalysts Industry Volume (K Tons) Forecast, by Application 2020 & 2033
- Table 33: Canada Refining Catalysts Industry Revenue (Billion) Forecast, by Application 2020 & 2033
- Table 34: Canada Refining Catalysts Industry Volume (K Tons) Forecast, by Application 2020 & 2033
- Table 35: Mexico Refining Catalysts Industry Revenue (Billion) Forecast, by Application 2020 & 2033
- Table 36: Mexico Refining Catalysts Industry Volume (K Tons) Forecast, by Application 2020 & 2033
- Table 37: Global Refining Catalysts Industry Revenue Billion Forecast, by Product 2020 & 2033
- Table 38: Global Refining Catalysts Industry Volume K Tons Forecast, by Product 2020 & 2033
- Table 39: Global Refining Catalysts Industry Revenue Billion Forecast, by Process 2020 & 2033
- Table 40: Global Refining Catalysts Industry Volume K Tons Forecast, by Process 2020 & 2033
- Table 41: Global Refining Catalysts Industry Revenue Billion Forecast, by Country 2020 & 2033
- Table 42: Global Refining Catalysts Industry Volume K Tons Forecast, by Country 2020 & 2033
- Table 43: Germany Refining Catalysts Industry Revenue (Billion) Forecast, by Application 2020 & 2033
- Table 44: Germany Refining Catalysts Industry Volume (K Tons) Forecast, by Application 2020 & 2033
- Table 45: United Kingdom Refining Catalysts Industry Revenue (Billion) Forecast, by Application 2020 & 2033
- Table 46: United Kingdom Refining Catalysts Industry Volume (K Tons) Forecast, by Application 2020 & 2033
- Table 47: Italy Refining Catalysts Industry Revenue (Billion) Forecast, by Application 2020 & 2033
- Table 48: Italy Refining Catalysts Industry Volume (K Tons) Forecast, by Application 2020 & 2033
- Table 49: France Refining Catalysts Industry Revenue (Billion) Forecast, by Application 2020 & 2033
- Table 50: France Refining Catalysts Industry Volume (K Tons) Forecast, by Application 2020 & 2033
- Table 51: Spain Refining Catalysts Industry Revenue (Billion) Forecast, by Application 2020 & 2033
- Table 52: Spain Refining Catalysts Industry Volume (K Tons) Forecast, by Application 2020 & 2033
- Table 53: Russia Refining Catalysts Industry Revenue (Billion) Forecast, by Application 2020 & 2033
- Table 54: Russia Refining Catalysts Industry Volume (K Tons) Forecast, by Application 2020 & 2033
- Table 55: Rest of Europe Refining Catalysts Industry Revenue (Billion) Forecast, by Application 2020 & 2033
- Table 56: Rest of Europe Refining Catalysts Industry Volume (K Tons) Forecast, by Application 2020 & 2033
- Table 57: Global Refining Catalysts Industry Revenue Billion Forecast, by Product 2020 & 2033
- Table 58: Global Refining Catalysts Industry Volume K Tons Forecast, by Product 2020 & 2033
- Table 59: Global Refining Catalysts Industry Revenue Billion Forecast, by Process 2020 & 2033
- Table 60: Global Refining Catalysts Industry Volume K Tons Forecast, by Process 2020 & 2033
- Table 61: Global Refining Catalysts Industry Revenue Billion Forecast, by Country 2020 & 2033
- Table 62: Global Refining Catalysts Industry Volume K Tons Forecast, by Country 2020 & 2033
- Table 63: Brazil Refining Catalysts Industry Revenue (Billion) Forecast, by Application 2020 & 2033
- Table 64: Brazil Refining Catalysts Industry Volume (K Tons) Forecast, by Application 2020 & 2033
- Table 65: Argentina Refining Catalysts Industry Revenue (Billion) Forecast, by Application 2020 & 2033
- Table 66: Argentina Refining Catalysts Industry Volume (K Tons) Forecast, by Application 2020 & 2033
- Table 67: Rest of South America Refining Catalysts Industry Revenue (Billion) Forecast, by Application 2020 & 2033
- Table 68: Rest of South America Refining Catalysts Industry Volume (K Tons) Forecast, by Application 2020 & 2033
- Table 69: Global Refining Catalysts Industry Revenue Billion Forecast, by Product 2020 & 2033
- Table 70: Global Refining Catalysts Industry Volume K Tons Forecast, by Product 2020 & 2033
- Table 71: Global Refining Catalysts Industry Revenue Billion Forecast, by Process 2020 & 2033
- Table 72: Global Refining Catalysts Industry Volume K Tons Forecast, by Process 2020 & 2033
- Table 73: Global Refining Catalysts Industry Revenue Billion Forecast, by Country 2020 & 2033
- Table 74: Global Refining Catalysts Industry Volume K Tons Forecast, by Country 2020 & 2033
- Table 75: Saudi Arabia Refining Catalysts Industry Revenue (Billion) Forecast, by Application 2020 & 2033
- Table 76: Saudi Arabia Refining Catalysts Industry Volume (K Tons) Forecast, by Application 2020 & 2033
- Table 77: South Africa Refining Catalysts Industry Revenue (Billion) Forecast, by Application 2020 & 2033
- Table 78: South Africa Refining Catalysts Industry Volume (K Tons) Forecast, by Application 2020 & 2033
- Table 79: Rest of Middle East and Africa Refining Catalysts Industry Revenue (Billion) Forecast, by Application 2020 & 2033
- Table 80: Rest of Middle East and Africa Refining Catalysts Industry Volume (K Tons) Forecast, by Application 2020 & 2033
Frequently Asked Questions
1. What is the projected Compound Annual Growth Rate (CAGR) of the Refining Catalysts Industry?
The projected CAGR is approximately 3.69%.
2. Which companies are prominent players in the Refining Catalysts Industry?
Key companies in the market include Axens, Topsoe, China Petrochemical Corporation, Exxon Mobil Corporation, BASF SE, Honeywell International, Chevron Lummus Global (CLG), JGC C & C, Royal Dutch Shell PLC, Johnson Matthey, KNT Group, W R Grace & Co -Conn, Albemarle Corporation.
3. What are the main segments of the Refining Catalysts Industry?
The market segments include Product, Process.
4. Can you provide details about the market size?
The market size is estimated to be USD 3.9 Billion as of 2022.
5. What are some drivers contributing to market growth?
Accelerating Demand for Higher-Octane Fuel; Expansion of Oil and Gas Activities; Other Drivers.
6. What are the notable trends driving market growth?
Fluid Catalytic Cracking (FCC) Catalysts to Dominate the Market.
7. Are there any restraints impacting market growth?
Volatility in Precious Metal Prices; Other Restraints.
8. Can you provide examples of recent developments in the market?
March 2022: BASF launched Fourtitude, a new Fluid Catalytic Cracking (FCC) catalyst designed to maximize butylenes from resid feedstocks.
9. What pricing options are available for accessing the report?
Pricing options include single-user, multi-user, and enterprise licenses priced at USD 3,950, USD 4,950, and USD 6,950 respectively.
10. Is the market size provided in terms of value or volume?
The market size is provided in terms of value, measured in Billion and volume, measured in K Tons.
11. Are there any specific market keywords associated with the report?
Yes, the market keyword associated with the report is "Refining Catalysts Industry," which aids in identifying and referencing the specific market segment covered.
12. How do I determine which pricing option suits my needs best?
The pricing options vary based on user requirements and access needs. Individual users may opt for single-user licenses, while businesses requiring broader access may choose multi-user or enterprise licenses for cost-effective access to the report.
13. Are there any additional resources or data provided in the Refining Catalysts Industry report?
While the report offers comprehensive insights, it's advisable to review the specific contents or supplementary materials provided to ascertain if additional resources or data are available.
14. How can I stay updated on further developments or reports in the Refining Catalysts Industry?
To stay informed about further developments, trends, and reports in the Refining Catalysts Industry, consider subscribing to industry newsletters, following relevant companies and organizations, or regularly checking reputable industry news sources and publications.
Methodology
Step 1 - Identification of Relevant Samples Size from Population Database


Step 2 - Approaches for Defining Global Market Size (Value, Volume* & Price*)

Note*: In applicable scenarios
Step 3 - Data Sources
Primary Research
- Web Analytics
- Survey Reports
- Research Institute
- Latest Research Reports
- Opinion Leaders
Secondary Research
- Annual Reports
- White Paper
- Latest Press Release
- Industry Association
- Paid Database
- Investor Presentations

Step 4 - Data Triangulation
Involves using different sources of information in order to increase the validity of a study
These sources are likely to be stakeholders in a program - participants, other researchers, program staff, other community members, and so on.
Then we put all data in single framework & apply various statistical tools to find out the dynamic on the market.
During the analysis stage, feedback from the stakeholder groups would be compared to determine areas of agreement as well as areas of divergence