

Key Insights
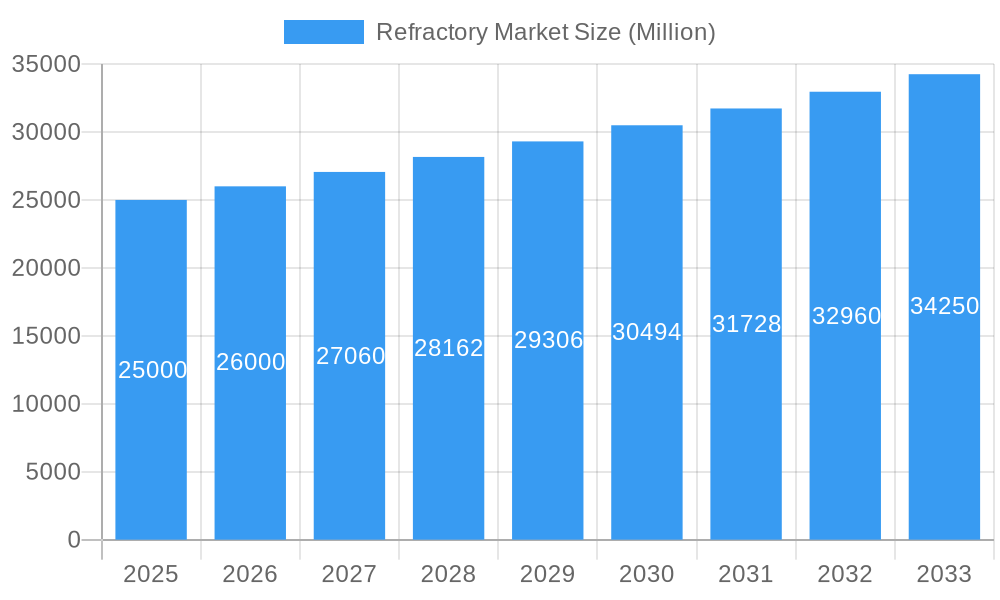
The refractory market, exhibiting a Compound Annual Growth Rate (CAGR) of 4.00% from 2019 to 2033, is poised for steady expansion. Driven by robust growth in the construction, metal production, and chemical processing sectors, the market is witnessing increased demand for high-performance refractory materials capable of withstanding extreme temperatures and corrosive environments. Technological advancements, such as the development of lightweight and energy-efficient refractories, are further fueling market growth. However, fluctuations in raw material prices and environmental concerns related to manufacturing processes present challenges. The market is segmented by material type (e.g., alumina, magnesia, silica), application (e.g., iron and steel, cement, glass), and geography. Key players such as Chosun Refractories, HarbisonWalker International, and RHI Magnesita GmbH are driving innovation and expanding their global reach through strategic partnerships and acquisitions. The market's future growth trajectory is anticipated to remain positive, driven by ongoing industrialization, particularly in developing economies, alongside the increasing adoption of advanced refractory solutions to enhance operational efficiency and reduce energy consumption.
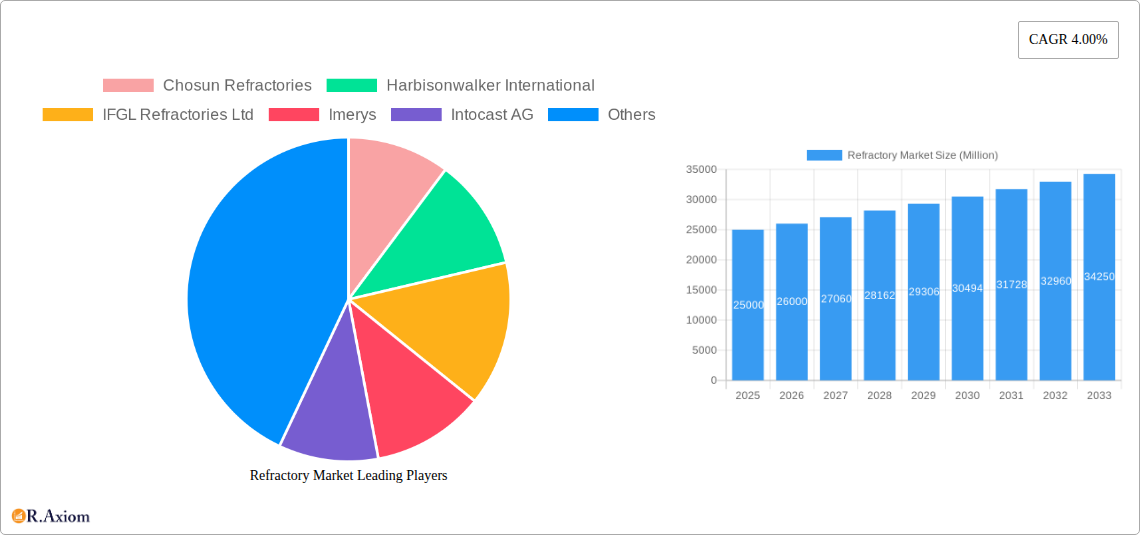
Refractory Market Market Size (In Billion)
The competitive landscape is characterized by a mix of large multinational corporations and regional players. These companies are constantly striving to improve their product offerings, expand their geographical reach, and develop innovative solutions to meet the evolving needs of their customers. Pricing strategies vary depending on the specific product, its performance characteristics, and the customer's needs. The market is also influenced by government regulations and environmental concerns, leading manufacturers to prioritize sustainable practices and the development of eco-friendly refractory solutions. Future market growth will hinge on maintaining innovation, managing supply chain complexities, and adapting to changes in global economic conditions. The continuing expansion of heavy industries globally ensures strong prospects for sustained market growth through 2033. However, careful consideration must be given to managing potential material cost increases and maintaining supply chain resiliency.
Refractory Market Company Market Share
Refractory Market: A Comprehensive Report (2019-2033)
This detailed report provides a comprehensive analysis of the global refractory market, encompassing historical data (2019-2024), the base year (2025), and a forecast period (2025-2033). It delves into market dynamics, competitive landscapes, and future growth prospects, offering actionable insights for industry stakeholders. The report's estimated market size in 2025 is xx Million.
Refractory Market Concentration & Innovation
This section analyzes the level of market concentration, identifying key players and their respective market shares. We explore innovation drivers, including technological advancements in refractory materials and manufacturing processes. The influence of regulatory frameworks, the availability of product substitutes, evolving end-user trends, and the impact of mergers and acquisitions (M&A) activities on market dynamics are also examined.
Market Concentration: The global refractory market exhibits a moderately concentrated structure, with the top five players holding approximately xx% of the market share in 2025. This is expected to remain relatively stable during the forecast period, although increased competition from new entrants is anticipated in certain segments.
Innovation Drivers: Ongoing research and development efforts are focused on developing high-performance refractory materials with improved thermal shock resistance, corrosion resistance, and energy efficiency. This is driven by increasing demands from high-temperature industrial processes.
Regulatory Frameworks: Environmental regulations concerning emissions and waste management are significantly influencing the production and application of refractory materials. Compliance costs and the adoption of sustainable manufacturing practices are key considerations for market players.
Product Substitutes: While traditional refractory materials remain dominant, the emergence of advanced materials like ceramic matrix composites and carbon-based refractories is presenting some level of substitution, particularly in niche applications.
End-User Trends: The growing demand from sectors like steel, cement, and petrochemicals is a major driver for market growth. Shifts in production processes and the increasing adoption of energy-efficient technologies also influence market demand.
M&A Activities: The refractory market has witnessed significant M&A activity in recent years, with several notable transactions impacting market consolidation and technological capabilities. Deal values have ranged from xx Million to xx Million in the past few years, with a trend towards larger acquisitions anticipated in the future.
Refractory Market Industry Trends & Insights
This section explores the major trends shaping the refractory market. We examine market growth drivers, analyzing their influence on the Compound Annual Growth Rate (CAGR) and market penetration. We discuss the impact of technological disruptions, shifting consumer preferences, and intense competitive dynamics. Specific data on CAGR and market penetration for various segments are presented, along with an analysis of their contributing factors. Furthermore, we consider the effects of global economic conditions, geopolitical events, and technological breakthroughs. Specific details regarding the influence of these factors will be given in the full report, with detailed analysis of each trend’s contribution to the overall market size and growth projections.
Dominant Markets & Segments in Refractory Market
This section provides an in-depth analysis of the leading regions, countries, and segments that are shaping the global refractory market. We highlight the key drivers and growth factors contributing to their prominent positions and market share.
- Leading Regions: Asia-Pacific is projected to be the dominant region in 2025, accounting for approximately 45-50% of the global market share. This dominance is primarily attributed to robust industrial growth, substantial investments in infrastructure projects, and a burgeoning manufacturing sector within countries like China and India.
- Leading Countries: China continues to demonstrate unparalleled strength within the Asia-Pacific region, propelled by its massive steel production, extensive construction activities, and supportive government policies aimed at industrial modernization. Other significant contributors include India and the United States, driven by their respective infrastructure development and manufacturing expansion.
- Dominant Segments: The alumina-based refractories segment is currently the largest due to high demand from the steel and cement industries, which represent significant end-users requiring materials with excellent high-temperature resistance and durability. Advancements in processing and formulation are further enhancing their performance characteristics.
Refractory Market Product Developments
Recent product innovations in the refractory market are keenly focused on enhancing critical performance characteristics such as extended durability, superior thermal shock resistance, and improved energy efficiency. Manufacturers are actively developing advanced refractory materials that can withstand more extreme operating conditions and contribute to reduced energy consumption in high-temperature industrial processes. Furthermore, new applications are emerging across diverse sectors, including the rapidly growing renewable energy production (e.g., solar thermal systems, advanced battery manufacturing) and sophisticated advanced manufacturing processes. These cutting-edge innovations provide significant competitive advantages to refractory manufacturers, enabling them to effectively address the evolving and increasingly stringent demands of various end-use industries.
Report Scope & Segmentation Analysis
This report segments the refractory market based on [List the Segmentation criteria e.g., product type, application, and region]. Each segment’s growth projections, market size, and competitive landscape are detailed within the report. Each segment will have a dedicated section detailing market size, growth prospects, key players, and competitive dynamics.
Key Drivers of Refractory Market Growth
Several factors contribute to the growth of the refractory market:
- Technological advancements: The development of high-performance refractory materials and advanced manufacturing processes is driving market expansion.
- Economic growth in key end-use industries: Growth in sectors like steel, cement, and petrochemicals is a significant driver.
- Favorable government policies and regulations: Support for industrial development and infrastructure projects positively impacts market growth.
Challenges in the Refractory Market Sector
The refractory market faces several challenges:
- Stringent environmental regulations: Compliance costs and the need for sustainable manufacturing practices pose significant challenges.
- Supply chain disruptions: Global events and geopolitical instability can disrupt the availability of raw materials.
- Intense competition: The presence of numerous established and emerging players leads to pricing pressure and the need for continuous innovation.
Emerging Opportunities in Refractory Market
The refractory market is ripe with exciting emerging opportunities:
- Growth in renewable energy sectors: The accelerating global adoption of renewable energy technologies, such as advanced solar power generation and hydrogen production, is creating novel and substantial applications for specialized refractory materials designed for these unique environments.
- Advancements in material science: Ongoing breakthroughs in material science are enabling the development of novel composite refractories and highly innovative refractory solutions, offering substantial growth potential for manufacturers who can leverage these advancements to create next-generation products.
- Expansion into new geographical markets: Untapped and rapidly industrializing markets in developing economies, particularly in Southeast Asia and Africa, present significant untapped growth opportunities for refractory products and solutions.
Leading Players in the Refractory Market Market
- Chosun Refractories
- Harbisonwalker International
- IFGL Refractories Ltd
- Imerys
- Intocast AG
- Krosaki Harima Corporation
- Magnezit Group
- Minerals Technologies Inc
- Morgan Advanced Materials
- Puyang Refractories Group Co Ltd
- Refratechnik
- RHI Magnesita GmbH
- Saint-Gobain
- Shinagawa Refractories Co Ltd
- Vesuvius
Key Developments in Refractory Market Industry
- January 2023: RHI Magnesita GmbH completed its acquisition of Dalmia Bharat Refractories Limited's (DBRL) Indian refractory business, adding nearly 300,000 tons of annual capacity.
- December 2022: Shinagawa Refractories Co. Ltd acquired Saint-Gobain's Brazilian refractory and alumina-based ceramics business, strengthening its product portfolio.
- April 2022: Saint-Gobain acquired Monofrax, a fused cast refractories manufacturer, bolstering its American market presence.
Strategic Outlook for Refractory Market Market
The refractory market is poised for continued growth, driven by technological innovation, expansion into new applications, and increasing demand from key end-use industries. Opportunities exist in developing sustainable and energy-efficient refractory solutions, catering to the growing emphasis on environmental protection. The market's future potential is substantial, with sustained growth projected across various segments and regions.
Refractory Market Segmentation
-
1. Product Type
-
1.1. Non-clay Refractory
- 1.1.1. Magnesit
- 1.1.2. Zirconia Brick
- 1.1.3. Silica Brick
- 1.1.4. Chromite Brick
- 1.1.5. Other Product Types (Carbides, Silicates)
-
1.2. Clay Refractory
- 1.2.1. High Alumina
- 1.2.2. Fireclay
- 1.2.3. Insulating
-
1.1. Non-clay Refractory
-
2. End-user Industry
- 2.1. Iron and Steel
- 2.2. Energy and Chemicals
- 2.3. Non-ferrous Metals
- 2.4. Cement
- 2.5. Ceramic
- 2.6. Glass
- 2.7. Other End-user Industries
Refractory Market Segmentation By Geography
-
1. Asia Pacific
- 1.1. China
- 1.2. India
- 1.3. Japan
- 1.4. South Korea
- 1.5. Rest of Asia Pacific
-
2. North America
- 2.1. United States
- 2.2. Canada
- 2.3. Mexico
-
3. Europe
- 3.1. Germany
- 3.2. United Kingdom
- 3.3. Italy
- 3.4. France
- 3.5. Rest of Europe
-
4. South America
- 4.1. Brazil
- 4.2. Argentina
- 4.3. Rest of South America
-
5. Middle East and Africa
- 5.1. Saudi Arabia
- 5.2. South Africa
- 5.3. Rest of Middle East and Africa
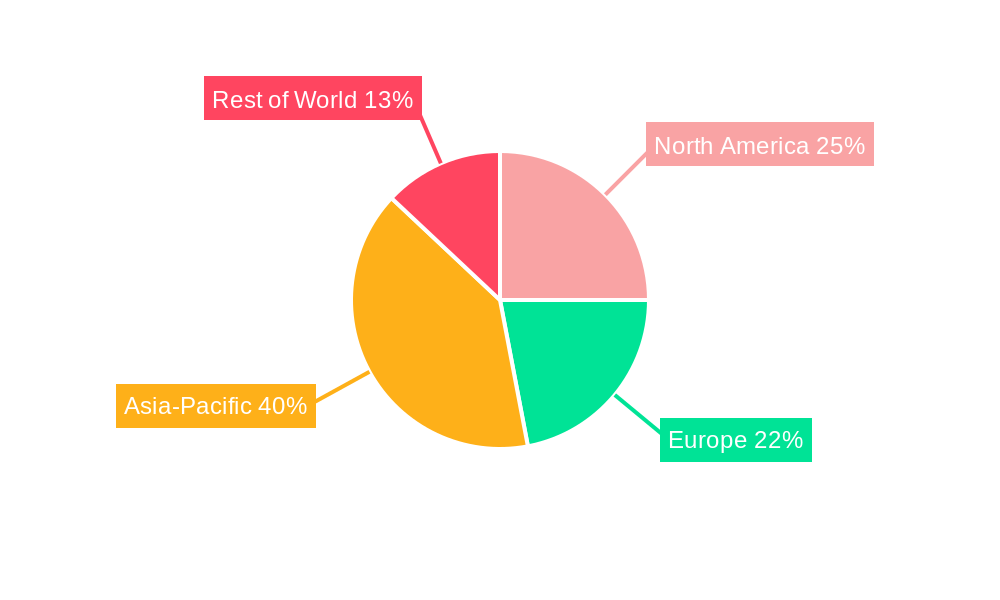
Refractory Market Regional Market Share
Geographic Coverage of Refractory Market
Refractory Market REPORT HIGHLIGHTS
| Aspects | Details |
|---|---|
| Study Period | 2020-2034 |
| Base Year | 2025 |
| Estimated Year | 2026 |
| Forecast Period | 2026-2034 |
| Historical Period | 2020-2025 |
| Growth Rate | CAGR of 9.5% from 2020-2034 |
| Segmentation |
|
Table of Contents
- 1. Introduction
- 1.1. Research Scope
- 1.2. Market Segmentation
- 1.3. Research Objective
- 1.4. Definitions and Assumptions
- 2. Executive Summary
- 2.1. Market Snapshot
- 3. Market Dynamics
- 3.1. Market Drivers
- 3.2. Market Restrains
- 3.3. Market Trends
- 3.4. Market Opportunities
- 4. Market Factor Analysis
- 4.1. Porters Five Forces
- 4.1.1. Bargaining Power of Suppliers
- 4.1.2. Bargaining Power of Buyers
- 4.1.3. Threat of New Entrants
- 4.1.4. Threat of Substitutes
- 4.1.5. Competitive Rivalry
- 4.2. PESTEL analysis
- 4.3. BCG Analysis
- 4.3.1. Stars (High Growth, High Market Share)
- 4.3.2. Cash Cows (Low Growth, High Market Share)
- 4.3.3. Question Mark (High Growth, Low Market Share)
- 4.3.4. Dogs (Low Growth, Low Market Share)
- 4.4. Ansoff Matrix Analysis
- 4.5. Supply Chain Analysis
- 4.6. Regulatory Landscape
- 4.7. Current Market Potential and Opportunity Assessment (TAM–SAM–SOM Framework)
- 4.8. RAX Analyst Note
- 4.1. Porters Five Forces
- 5. Market Analysis, Insights and Forecast 2021-2033
- 5.1. Market Analysis, Insights and Forecast - by Product Type
- 5.1.1. Non-clay Refractory
- 5.1.1.1. Magnesit
- 5.1.1.2. Zirconia Brick
- 5.1.1.3. Silica Brick
- 5.1.1.4. Chromite Brick
- 5.1.1.5. Other Product Types (Carbides, Silicates)
- 5.1.2. Clay Refractory
- 5.1.2.1. High Alumina
- 5.1.2.2. Fireclay
- 5.1.2.3. Insulating
- 5.1.1. Non-clay Refractory
- 5.2. Market Analysis, Insights and Forecast - by End-user Industry
- 5.2.1. Iron and Steel
- 5.2.2. Energy and Chemicals
- 5.2.3. Non-ferrous Metals
- 5.2.4. Cement
- 5.2.5. Ceramic
- 5.2.6. Glass
- 5.2.7. Other End-user Industries
- 5.3. Market Analysis, Insights and Forecast - by Region
- 5.3.1. Asia Pacific
- 5.3.2. North America
- 5.3.3. Europe
- 5.3.4. South America
- 5.3.5. Middle East and Africa
- 5.1. Market Analysis, Insights and Forecast - by Product Type
- 6. Global Refractory Market Analysis, Insights and Forecast, 2021-2033
- 6.1. Market Analysis, Insights and Forecast - by Product Type
- 6.1.1. Non-clay Refractory
- 6.1.1.1. Magnesit
- 6.1.1.2. Zirconia Brick
- 6.1.1.3. Silica Brick
- 6.1.1.4. Chromite Brick
- 6.1.1.5. Other Product Types (Carbides, Silicates)
- 6.1.2. Clay Refractory
- 6.1.2.1. High Alumina
- 6.1.2.2. Fireclay
- 6.1.2.3. Insulating
- 6.1.1. Non-clay Refractory
- 6.2. Market Analysis, Insights and Forecast - by End-user Industry
- 6.2.1. Iron and Steel
- 6.2.2. Energy and Chemicals
- 6.2.3. Non-ferrous Metals
- 6.2.4. Cement
- 6.2.5. Ceramic
- 6.2.6. Glass
- 6.2.7. Other End-user Industries
- 6.1. Market Analysis, Insights and Forecast - by Product Type
- 7. Asia Pacific Refractory Market Analysis, Insights and Forecast, 2020-2032
- 7.1. Market Analysis, Insights and Forecast - by Product Type
- 7.1.1. Non-clay Refractory
- 7.1.1.1. Magnesit
- 7.1.1.2. Zirconia Brick
- 7.1.1.3. Silica Brick
- 7.1.1.4. Chromite Brick
- 7.1.1.5. Other Product Types (Carbides, Silicates)
- 7.1.2. Clay Refractory
- 7.1.2.1. High Alumina
- 7.1.2.2. Fireclay
- 7.1.2.3. Insulating
- 7.1.1. Non-clay Refractory
- 7.2. Market Analysis, Insights and Forecast - by End-user Industry
- 7.2.1. Iron and Steel
- 7.2.2. Energy and Chemicals
- 7.2.3. Non-ferrous Metals
- 7.2.4. Cement
- 7.2.5. Ceramic
- 7.2.6. Glass
- 7.2.7. Other End-user Industries
- 7.1. Market Analysis, Insights and Forecast - by Product Type
- 8. North America Refractory Market Analysis, Insights and Forecast, 2020-2032
- 8.1. Market Analysis, Insights and Forecast - by Product Type
- 8.1.1. Non-clay Refractory
- 8.1.1.1. Magnesit
- 8.1.1.2. Zirconia Brick
- 8.1.1.3. Silica Brick
- 8.1.1.4. Chromite Brick
- 8.1.1.5. Other Product Types (Carbides, Silicates)
- 8.1.2. Clay Refractory
- 8.1.2.1. High Alumina
- 8.1.2.2. Fireclay
- 8.1.2.3. Insulating
- 8.1.1. Non-clay Refractory
- 8.2. Market Analysis, Insights and Forecast - by End-user Industry
- 8.2.1. Iron and Steel
- 8.2.2. Energy and Chemicals
- 8.2.3. Non-ferrous Metals
- 8.2.4. Cement
- 8.2.5. Ceramic
- 8.2.6. Glass
- 8.2.7. Other End-user Industries
- 8.1. Market Analysis, Insights and Forecast - by Product Type
- 9. Europe Refractory Market Analysis, Insights and Forecast, 2020-2032
- 9.1. Market Analysis, Insights and Forecast - by Product Type
- 9.1.1. Non-clay Refractory
- 9.1.1.1. Magnesit
- 9.1.1.2. Zirconia Brick
- 9.1.1.3. Silica Brick
- 9.1.1.4. Chromite Brick
- 9.1.1.5. Other Product Types (Carbides, Silicates)
- 9.1.2. Clay Refractory
- 9.1.2.1. High Alumina
- 9.1.2.2. Fireclay
- 9.1.2.3. Insulating
- 9.1.1. Non-clay Refractory
- 9.2. Market Analysis, Insights and Forecast - by End-user Industry
- 9.2.1. Iron and Steel
- 9.2.2. Energy and Chemicals
- 9.2.3. Non-ferrous Metals
- 9.2.4. Cement
- 9.2.5. Ceramic
- 9.2.6. Glass
- 9.2.7. Other End-user Industries
- 9.1. Market Analysis, Insights and Forecast - by Product Type
- 10. South America Refractory Market Analysis, Insights and Forecast, 2020-2032
- 10.1. Market Analysis, Insights and Forecast - by Product Type
- 10.1.1. Non-clay Refractory
- 10.1.1.1. Magnesit
- 10.1.1.2. Zirconia Brick
- 10.1.1.3. Silica Brick
- 10.1.1.4. Chromite Brick
- 10.1.1.5. Other Product Types (Carbides, Silicates)
- 10.1.2. Clay Refractory
- 10.1.2.1. High Alumina
- 10.1.2.2. Fireclay
- 10.1.2.3. Insulating
- 10.1.1. Non-clay Refractory
- 10.2. Market Analysis, Insights and Forecast - by End-user Industry
- 10.2.1. Iron and Steel
- 10.2.2. Energy and Chemicals
- 10.2.3. Non-ferrous Metals
- 10.2.4. Cement
- 10.2.5. Ceramic
- 10.2.6. Glass
- 10.2.7. Other End-user Industries
- 10.1. Market Analysis, Insights and Forecast - by Product Type
- 11. Middle East and Africa Refractory Market Analysis, Insights and Forecast, 2020-2032
- 11.1. Market Analysis, Insights and Forecast - by Product Type
- 11.1.1. Non-clay Refractory
- 11.1.1.1. Magnesit
- 11.1.1.2. Zirconia Brick
- 11.1.1.3. Silica Brick
- 11.1.1.4. Chromite Brick
- 11.1.1.5. Other Product Types (Carbides, Silicates)
- 11.1.2. Clay Refractory
- 11.1.2.1. High Alumina
- 11.1.2.2. Fireclay
- 11.1.2.3. Insulating
- 11.1.1. Non-clay Refractory
- 11.2. Market Analysis, Insights and Forecast - by End-user Industry
- 11.2.1. Iron and Steel
- 11.2.2. Energy and Chemicals
- 11.2.3. Non-ferrous Metals
- 11.2.4. Cement
- 11.2.5. Ceramic
- 11.2.6. Glass
- 11.2.7. Other End-user Industries
- 11.1. Market Analysis, Insights and Forecast - by Product Type
- 12. Competitive Analysis
- 12.1. Company Profiles
- 12.1.1 Chosun Refractories
- 12.1.1.1. Company Overview
- 12.1.1.2. Products
- 12.1.1.3. Company Financials
- 12.1.1.4. SWOT Analysis
- 12.1.2 Harbisonwalker International
- 12.1.2.1. Company Overview
- 12.1.2.2. Products
- 12.1.2.3. Company Financials
- 12.1.2.4. SWOT Analysis
- 12.1.3 IFGL Refractories Ltd
- 12.1.3.1. Company Overview
- 12.1.3.2. Products
- 12.1.3.3. Company Financials
- 12.1.3.4. SWOT Analysis
- 12.1.4 Imerys
- 12.1.4.1. Company Overview
- 12.1.4.2. Products
- 12.1.4.3. Company Financials
- 12.1.4.4. SWOT Analysis
- 12.1.5 Intocast AG
- 12.1.5.1. Company Overview
- 12.1.5.2. Products
- 12.1.5.3. Company Financials
- 12.1.5.4. SWOT Analysis
- 12.1.6 Krosaki Harima Corporation
- 12.1.6.1. Company Overview
- 12.1.6.2. Products
- 12.1.6.3. Company Financials
- 12.1.6.4. SWOT Analysis
- 12.1.7 Magnezit Group
- 12.1.7.1. Company Overview
- 12.1.7.2. Products
- 12.1.7.3. Company Financials
- 12.1.7.4. SWOT Analysis
- 12.1.8 Minerals Technologies Inc
- 12.1.8.1. Company Overview
- 12.1.8.2. Products
- 12.1.8.3. Company Financials
- 12.1.8.4. SWOT Analysis
- 12.1.9 Morgan Advanced Materials
- 12.1.9.1. Company Overview
- 12.1.9.2. Products
- 12.1.9.3. Company Financials
- 12.1.9.4. SWOT Analysis
- 12.1.10 Puyang Refractories Group Co Ltd
- 12.1.10.1. Company Overview
- 12.1.10.2. Products
- 12.1.10.3. Company Financials
- 12.1.10.4. SWOT Analysis
- 12.1.11 Refratechnik
- 12.1.11.1. Company Overview
- 12.1.11.2. Products
- 12.1.11.3. Company Financials
- 12.1.11.4. SWOT Analysis
- 12.1.12 RHI Magnesita GmbH
- 12.1.12.1. Company Overview
- 12.1.12.2. Products
- 12.1.12.3. Company Financials
- 12.1.12.4. SWOT Analysis
- 12.1.13 Saint-Gobain
- 12.1.13.1. Company Overview
- 12.1.13.2. Products
- 12.1.13.3. Company Financials
- 12.1.13.4. SWOT Analysis
- 12.1.14 Shinagawa Refractories Co Ltd
- 12.1.14.1. Company Overview
- 12.1.14.2. Products
- 12.1.14.3. Company Financials
- 12.1.14.4. SWOT Analysis
- 12.1.15 Vesuvius*List Not Exhaustive
- 12.1.15.1. Company Overview
- 12.1.15.2. Products
- 12.1.15.3. Company Financials
- 12.1.15.4. SWOT Analysis
- 12.1.1 Chosun Refractories
- 12.2. Market Entropy
- 12.2.1 Company's Key Areas Served
- 12.2.2 Recent Developments
- 12.3. Company Market Share Analysis 2025
- 12.3.1 Top 5 Companies Market Share Analysis
- 12.3.2 Top 3 Companies Market Share Analysis
- 12.4. List of Potential Customers
- 13. Research Methodology
List of Figures
- Figure 1: Global Refractory Market Revenue Breakdown (billion, %) by Region 2025 & 2033
- Figure 2: Asia Pacific Refractory Market Revenue (billion), by Product Type 2025 & 2033
- Figure 3: Asia Pacific Refractory Market Revenue Share (%), by Product Type 2025 & 2033
- Figure 4: Asia Pacific Refractory Market Revenue (billion), by End-user Industry 2025 & 2033
- Figure 5: Asia Pacific Refractory Market Revenue Share (%), by End-user Industry 2025 & 2033
- Figure 6: Asia Pacific Refractory Market Revenue (billion), by Country 2025 & 2033
- Figure 7: Asia Pacific Refractory Market Revenue Share (%), by Country 2025 & 2033
- Figure 8: North America Refractory Market Revenue (billion), by Product Type 2025 & 2033
- Figure 9: North America Refractory Market Revenue Share (%), by Product Type 2025 & 2033
- Figure 10: North America Refractory Market Revenue (billion), by End-user Industry 2025 & 2033
- Figure 11: North America Refractory Market Revenue Share (%), by End-user Industry 2025 & 2033
- Figure 12: North America Refractory Market Revenue (billion), by Country 2025 & 2033
- Figure 13: North America Refractory Market Revenue Share (%), by Country 2025 & 2033
- Figure 14: Europe Refractory Market Revenue (billion), by Product Type 2025 & 2033
- Figure 15: Europe Refractory Market Revenue Share (%), by Product Type 2025 & 2033
- Figure 16: Europe Refractory Market Revenue (billion), by End-user Industry 2025 & 2033
- Figure 17: Europe Refractory Market Revenue Share (%), by End-user Industry 2025 & 2033
- Figure 18: Europe Refractory Market Revenue (billion), by Country 2025 & 2033
- Figure 19: Europe Refractory Market Revenue Share (%), by Country 2025 & 2033
- Figure 20: South America Refractory Market Revenue (billion), by Product Type 2025 & 2033
- Figure 21: South America Refractory Market Revenue Share (%), by Product Type 2025 & 2033
- Figure 22: South America Refractory Market Revenue (billion), by End-user Industry 2025 & 2033
- Figure 23: South America Refractory Market Revenue Share (%), by End-user Industry 2025 & 2033
- Figure 24: South America Refractory Market Revenue (billion), by Country 2025 & 2033
- Figure 25: South America Refractory Market Revenue Share (%), by Country 2025 & 2033
- Figure 26: Middle East and Africa Refractory Market Revenue (billion), by Product Type 2025 & 2033
- Figure 27: Middle East and Africa Refractory Market Revenue Share (%), by Product Type 2025 & 2033
- Figure 28: Middle East and Africa Refractory Market Revenue (billion), by End-user Industry 2025 & 2033
- Figure 29: Middle East and Africa Refractory Market Revenue Share (%), by End-user Industry 2025 & 2033
- Figure 30: Middle East and Africa Refractory Market Revenue (billion), by Country 2025 & 2033
- Figure 31: Middle East and Africa Refractory Market Revenue Share (%), by Country 2025 & 2033
List of Tables
- Table 1: Global Refractory Market Revenue billion Forecast, by Product Type 2020 & 2033
- Table 2: Global Refractory Market Revenue billion Forecast, by End-user Industry 2020 & 2033
- Table 3: Global Refractory Market Revenue billion Forecast, by Region 2020 & 2033
- Table 4: Global Refractory Market Revenue billion Forecast, by Product Type 2020 & 2033
- Table 5: Global Refractory Market Revenue billion Forecast, by End-user Industry 2020 & 2033
- Table 6: Global Refractory Market Revenue billion Forecast, by Country 2020 & 2033
- Table 7: China Refractory Market Revenue (billion) Forecast, by Application 2020 & 2033
- Table 8: India Refractory Market Revenue (billion) Forecast, by Application 2020 & 2033
- Table 9: Japan Refractory Market Revenue (billion) Forecast, by Application 2020 & 2033
- Table 10: South Korea Refractory Market Revenue (billion) Forecast, by Application 2020 & 2033
- Table 11: Rest of Asia Pacific Refractory Market Revenue (billion) Forecast, by Application 2020 & 2033
- Table 12: Global Refractory Market Revenue billion Forecast, by Product Type 2020 & 2033
- Table 13: Global Refractory Market Revenue billion Forecast, by End-user Industry 2020 & 2033
- Table 14: Global Refractory Market Revenue billion Forecast, by Country 2020 & 2033
- Table 15: United States Refractory Market Revenue (billion) Forecast, by Application 2020 & 2033
- Table 16: Canada Refractory Market Revenue (billion) Forecast, by Application 2020 & 2033
- Table 17: Mexico Refractory Market Revenue (billion) Forecast, by Application 2020 & 2033
- Table 18: Global Refractory Market Revenue billion Forecast, by Product Type 2020 & 2033
- Table 19: Global Refractory Market Revenue billion Forecast, by End-user Industry 2020 & 2033
- Table 20: Global Refractory Market Revenue billion Forecast, by Country 2020 & 2033
- Table 21: Germany Refractory Market Revenue (billion) Forecast, by Application 2020 & 2033
- Table 22: United Kingdom Refractory Market Revenue (billion) Forecast, by Application 2020 & 2033
- Table 23: Italy Refractory Market Revenue (billion) Forecast, by Application 2020 & 2033
- Table 24: France Refractory Market Revenue (billion) Forecast, by Application 2020 & 2033
- Table 25: Rest of Europe Refractory Market Revenue (billion) Forecast, by Application 2020 & 2033
- Table 26: Global Refractory Market Revenue billion Forecast, by Product Type 2020 & 2033
- Table 27: Global Refractory Market Revenue billion Forecast, by End-user Industry 2020 & 2033
- Table 28: Global Refractory Market Revenue billion Forecast, by Country 2020 & 2033
- Table 29: Brazil Refractory Market Revenue (billion) Forecast, by Application 2020 & 2033
- Table 30: Argentina Refractory Market Revenue (billion) Forecast, by Application 2020 & 2033
- Table 31: Rest of South America Refractory Market Revenue (billion) Forecast, by Application 2020 & 2033
- Table 32: Global Refractory Market Revenue billion Forecast, by Product Type 2020 & 2033
- Table 33: Global Refractory Market Revenue billion Forecast, by End-user Industry 2020 & 2033
- Table 34: Global Refractory Market Revenue billion Forecast, by Country 2020 & 2033
- Table 35: Saudi Arabia Refractory Market Revenue (billion) Forecast, by Application 2020 & 2033
- Table 36: South Africa Refractory Market Revenue (billion) Forecast, by Application 2020 & 2033
- Table 37: Rest of Middle East and Africa Refractory Market Revenue (billion) Forecast, by Application 2020 & 2033
Frequently Asked Questions
1. What is the projected Compound Annual Growth Rate (CAGR) of the Refractory Market?
The projected CAGR is approximately 9.5%.
2. Which companies are prominent players in the Refractory Market?
Key companies in the market include Chosun Refractories, Harbisonwalker International, IFGL Refractories Ltd, Imerys, Intocast AG, Krosaki Harima Corporation, Magnezit Group, Minerals Technologies Inc, Morgan Advanced Materials, Puyang Refractories Group Co Ltd, Refratechnik, RHI Magnesita GmbH, Saint-Gobain, Shinagawa Refractories Co Ltd, Vesuvius*List Not Exhaustive.
3. What are the main segments of the Refractory Market?
The market segments include Product Type, End-user Industry.
4. Can you provide details about the market size?
The market size is estimated to be USD 47.88 billion as of 2022.
5. What are some drivers contributing to market growth?
Continuous Usage of Refractories in the Iron and Steel Industry; Increase in the Production of Non-ferrous Metals.
6. What are the notable trends driving market growth?
Increasing Demand from the Iron and Steel Industry.
7. Are there any restraints impacting market growth?
Continuous Usage of Refractories in the Iron and Steel Industry; Increase in the Production of Non-ferrous Metals.
8. Can you provide examples of recent developments in the market?
January 2023: RHI Magnesita GmbH announced the completion of its acquisition of Dalmia Bharat Refractories Limited's (DBRL) Indian refractory business is expected to add almost 300,000 tons of capacity annually to the existing production footprint in India, enhancing the company's business in the studied market.
9. What pricing options are available for accessing the report?
Pricing options include single-user, multi-user, and enterprise licenses priced at USD 4750, USD 5250, and USD 8750 respectively.
10. Is the market size provided in terms of value or volume?
The market size is provided in terms of value, measured in billion.
11. Are there any specific market keywords associated with the report?
Yes, the market keyword associated with the report is "Refractory Market," which aids in identifying and referencing the specific market segment covered.
12. How do I determine which pricing option suits my needs best?
The pricing options vary based on user requirements and access needs. Individual users may opt for single-user licenses, while businesses requiring broader access may choose multi-user or enterprise licenses for cost-effective access to the report.
13. Are there any additional resources or data provided in the Refractory Market report?
While the report offers comprehensive insights, it's advisable to review the specific contents or supplementary materials provided to ascertain if additional resources or data are available.
14. How can I stay updated on further developments or reports in the Refractory Market?
To stay informed about further developments, trends, and reports in the Refractory Market, consider subscribing to industry newsletters, following relevant companies and organizations, or regularly checking reputable industry news sources and publications.
Methodology
Step 1 - Identification of Relevant Samples Size from Population Database


Step 2 - Approaches for Defining Global Market Size (Value, Volume* & Price*)

Note*: In applicable scenarios
Step 3 - Data Sources
Primary Research
- Web Analytics
- Survey Reports
- Research Institute
- Latest Research Reports
- Opinion Leaders
Secondary Research
- Annual Reports
- White Paper
- Latest Press Release
- Industry Association
- Paid Database
- Investor Presentations

Step 4 - Data Triangulation
Involves using different sources of information in order to increase the validity of a study
These sources are likely to be stakeholders in a program - participants, other researchers, program staff, other community members, and so on.
Then we put all data in single framework & apply various statistical tools to find out the dynamic on the market.
During the analysis stage, feedback from the stakeholder groups would be compared to determine areas of agreement as well as areas of divergence