

Key Insights
The global refrigerated beverage dispenser market is experiencing robust growth, driven by increasing demand in commercial settings like offices, restaurants, and educational institutions. The rising preference for chilled and readily available beverages, coupled with advancements in dispenser technology offering enhanced features like energy efficiency, improved hygiene, and customizable beverage options, are key catalysts. The market's expansion is further fueled by the proliferation of ready-to-drink beverages and the growing health consciousness among consumers, leading to a surge in demand for water dispensers and those offering healthy beverage alternatives. While initial investment costs can be a restraint for smaller businesses, the long-term cost savings achieved through efficient dispensing and reduced reliance on single-use plastic bottles are compelling factors. Competitive landscape analysis shows leading players such as Waterlogic, Follett, and Elkay Manufacturing vying for market share through innovation and strategic partnerships. Furthermore, the growing adoption of smart dispensers integrating technology for remote monitoring and management is shaping future market dynamics.

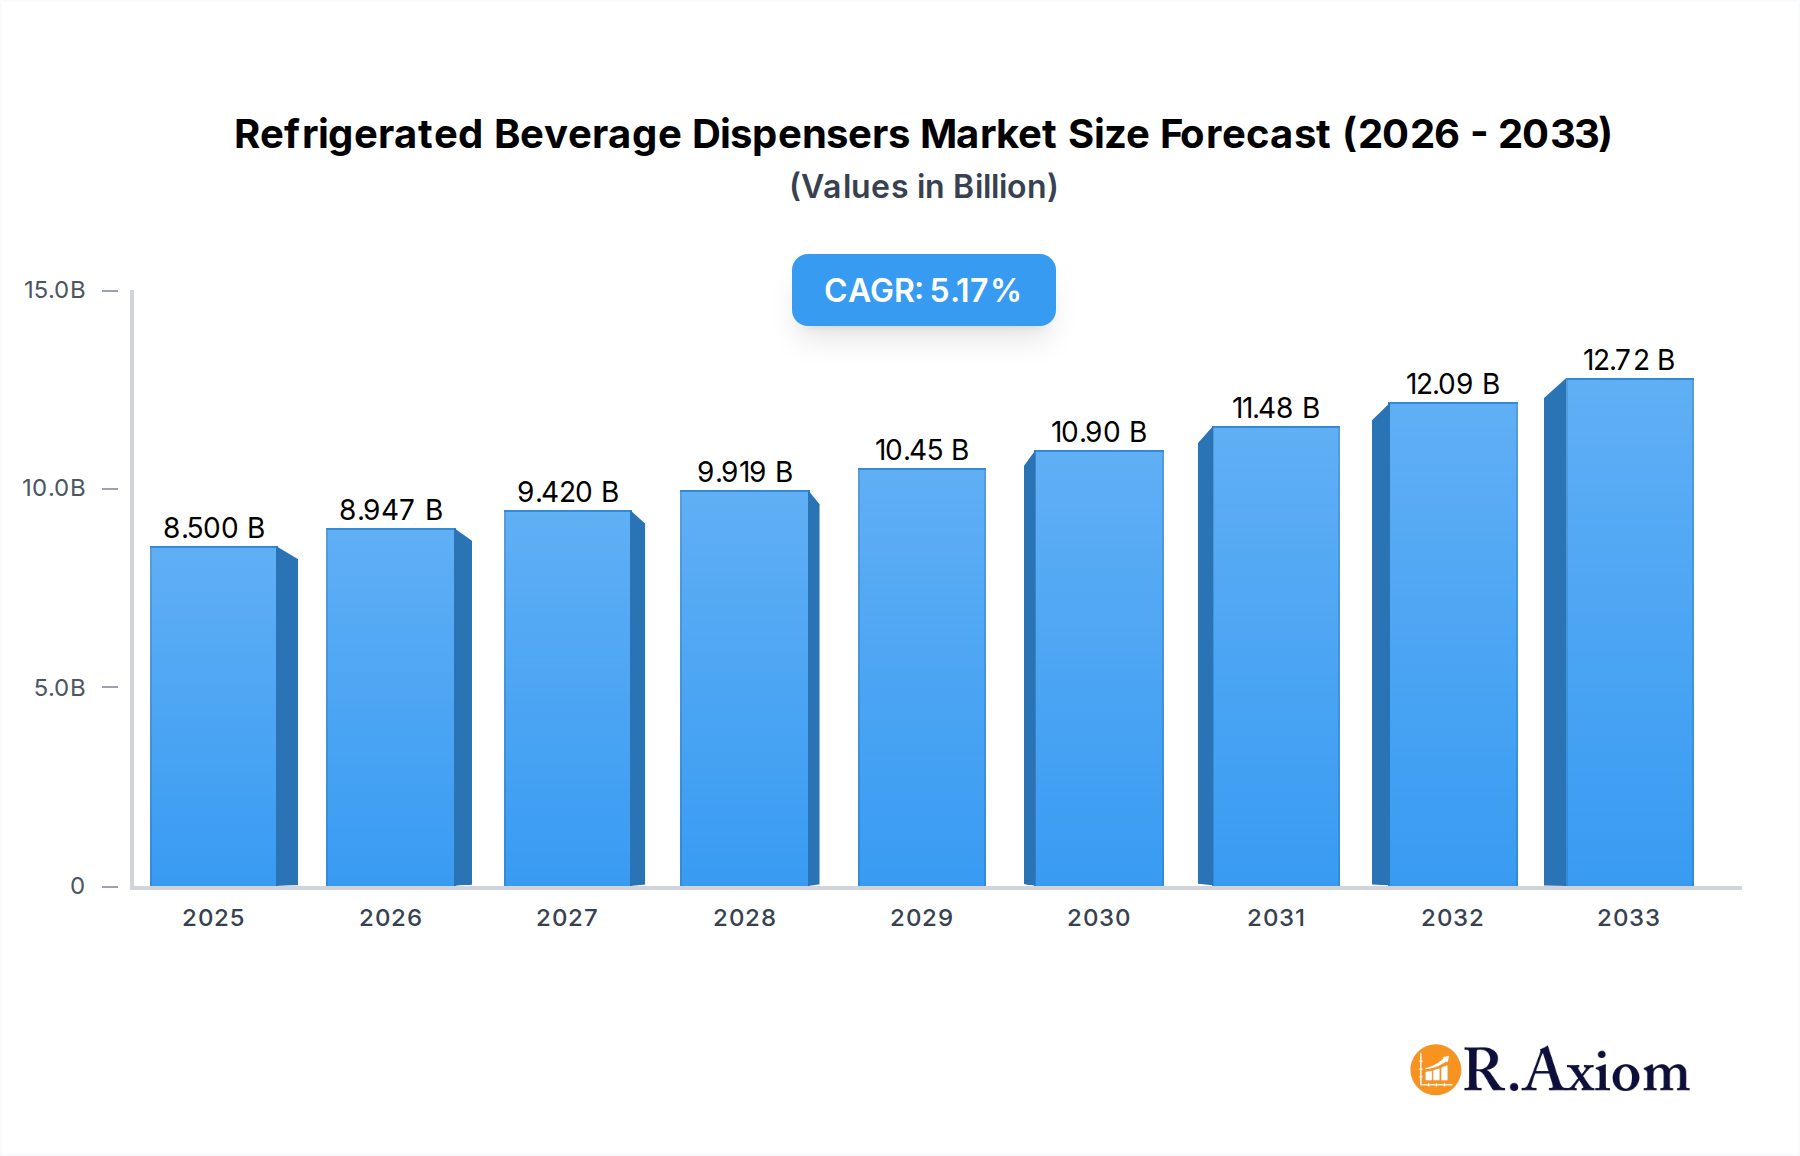
Refrigerated Beverage Dispensers Market Size (In Billion)
The projected Compound Annual Growth Rate (CAGR) suggests a consistent upward trajectory for the market. Regional variations in growth are likely, with developed economies exhibiting steady growth alongside rapid expansion in emerging markets. Segmentation reveals that different types of dispensers catering to specific beverage choices (water, soft drinks, etc.) and various capacities will contribute differently to overall market size. Companies are continually investing in research and development to create more sustainable and efficient models, further propelling market expansion. Analyzing the historical data from 2019 to 2024 alongside current market trends allows for a reliable forecast into 2033, showcasing strong and continued growth potential within this segment. This growth is expected to be primarily driven by the increasing adoption of refrigerated beverage dispensers in various sectors due to their convenience, hygiene, and cost-effectiveness in the long run.
Refrigerated Beverage Dispensers Company Market Share
This comprehensive report provides a detailed analysis of the global refrigerated beverage dispensers market, offering invaluable insights for industry stakeholders, investors, and businesses seeking to navigate this dynamic sector. The study period spans from 2019 to 2033, with 2025 serving as both the base and estimated year. The report projects market trends and growth opportunities through to 2033. The total market value reached approximately $xx million in 2024 and is expected to reach $xx million by 2033, exhibiting a CAGR of xx% during the forecast period (2025-2033).
Refrigerated Beverage Dispensers Market Concentration & Innovation
This section analyzes the competitive landscape, innovation drivers, and regulatory influences shaping the refrigerated beverage dispensers market. The market is moderately consolidated, with several key players holding significant market share. Waterlogic, Follett, and Elkay Manufacturing are among the leading players, each commanding a substantial portion (xx%, xx%, and xx% respectively) of the market as of 2024. However, smaller niche players, particularly those focusing on sustainable and innovative dispensing technologies, are emerging and disrupting the market.
- Market Concentration: The Herfindahl-Hirschman Index (HHI) for the market in 2024 was estimated at xx, indicating a moderately consolidated market.
- Innovation Drivers: Technological advancements in energy efficiency, smart dispensing systems, and hygiene features are driving innovation. The increasing demand for customized beverage solutions fuels further innovation in dispensing technologies.
- Regulatory Frameworks: Regulations concerning water quality, energy consumption, and waste management influence market dynamics. Compliance costs and stringent regulations in specific regions impact the market.
- Product Substitutes: Traditional water coolers and individual beverage packaging present competition. However, the convenience and cost-effectiveness of refrigerated beverage dispensers offer a strong competitive edge.
- End-User Trends: The increasing demand for healthier beverage options, coupled with the need for convenient and efficient dispensing systems across various sectors (office, hospitality, healthcare), is driving market growth.
- M&A Activities: The market has witnessed significant M&A activity in recent years, with total deal values exceeding $xx million between 2019 and 2024. These activities mainly focus on expanding product portfolios, enhancing technological capabilities, and broadening market reach.
Refrigerated Beverage Dispensers Industry Trends & Insights
The refrigerated beverage dispensers market is experiencing robust growth, propelled by several key trends. The rising demand for convenient and readily available beverages in commercial and residential settings significantly contributes to market expansion. Technological advancements, such as smart connectivity and improved energy efficiency features, also attract considerable market interest. Furthermore, increasing awareness of hygiene and sanitation drives the adoption of advanced filtration and disinfection technologies in beverage dispensers. The increasing preference for healthier beverages, such as filtered water and infused water, is significantly bolstering market growth. The growing health consciousness and the demand for environmentally friendly solutions are driving innovation and consumer preference toward sustainable materials and energy-efficient models. The competitive landscape remains intense with established players constantly innovating to retain and expand their market share.
The market exhibits a positive outlook, with a projected CAGR of xx% from 2025 to 2033. Market penetration in key segments, such as office spaces and hospitality venues, remains high, indicating significant growth potential in other sectors.
Dominant Markets & Segments in Refrigerated Beverage Dispensers
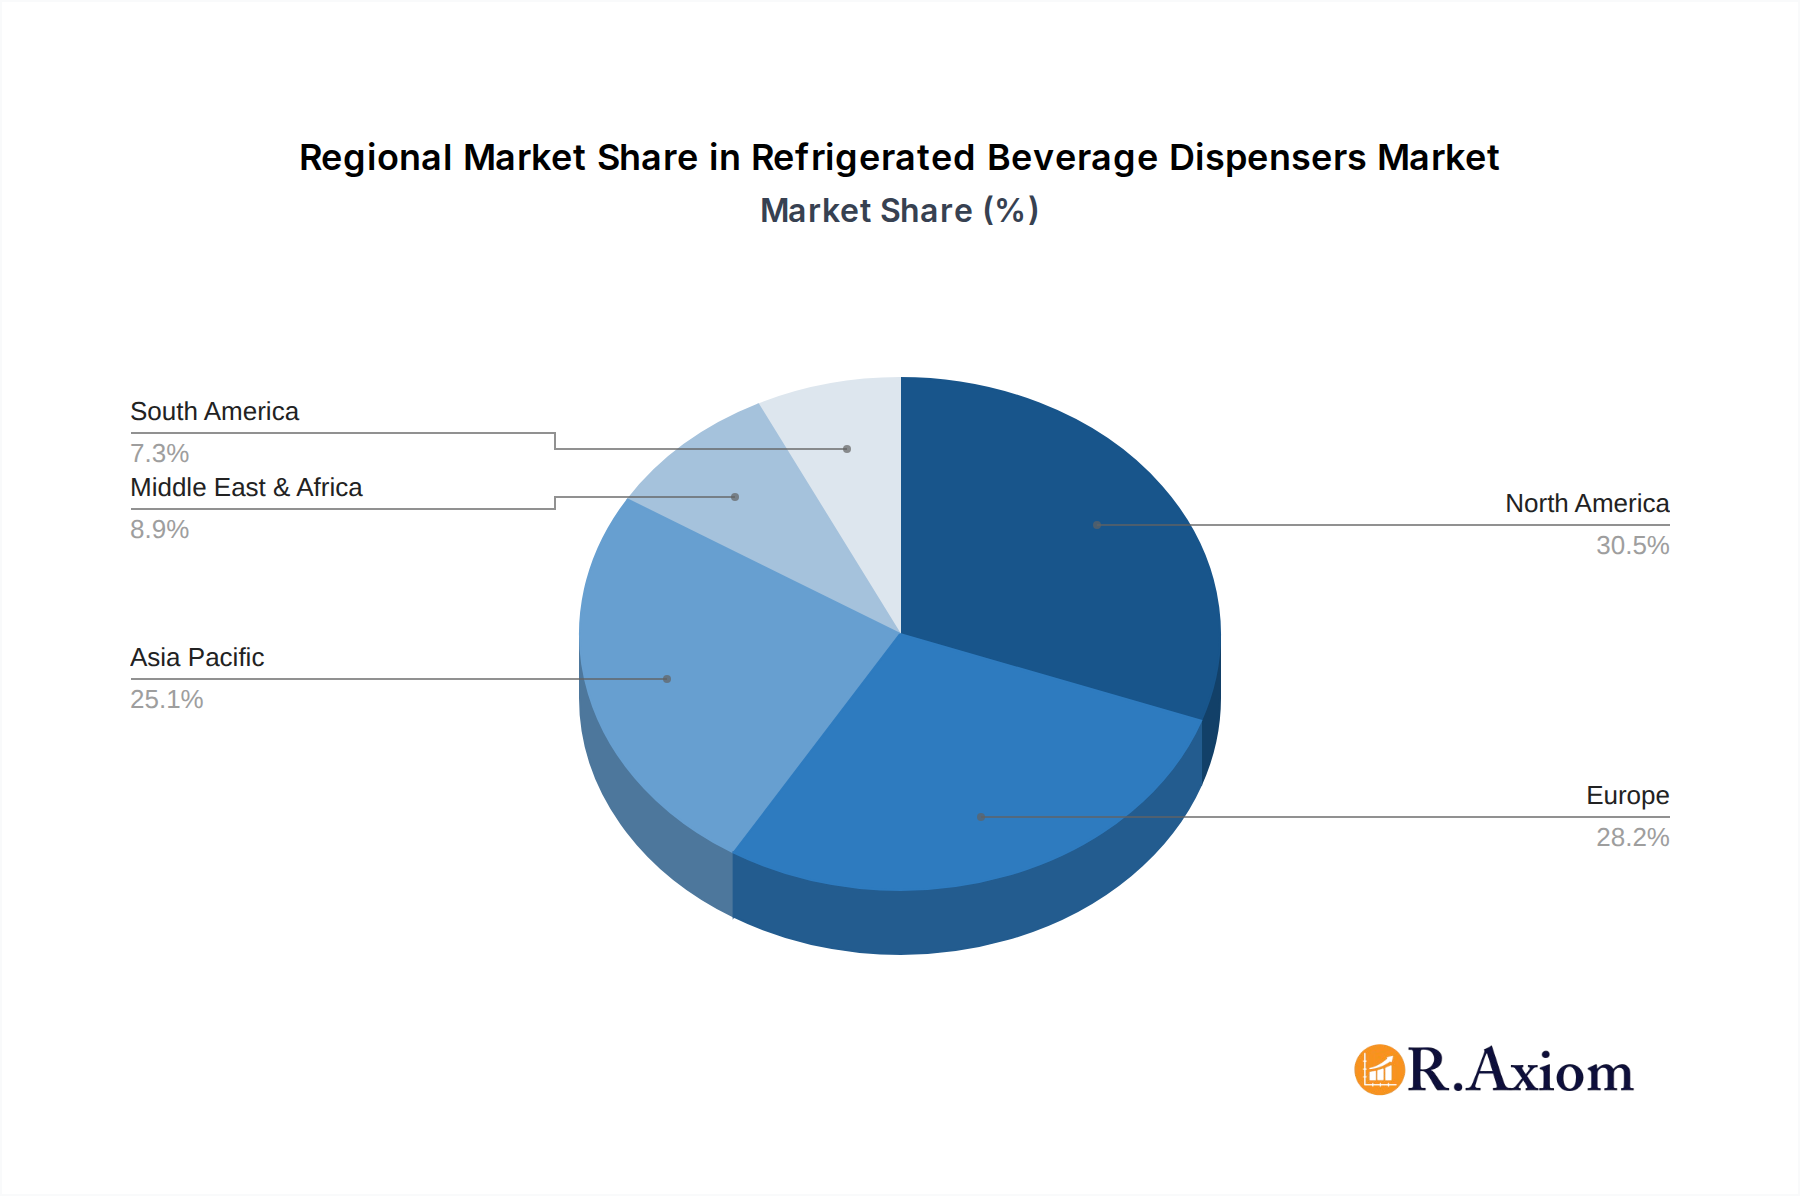
The North American region currently holds the largest market share for refrigerated beverage dispensers, driven by high per capita beverage consumption and strong demand across commercial segments, particularly offices and hospitality businesses.
- Key Drivers in North America:
- Robust economic growth and disposable income.
- Well-developed infrastructure and logistics networks.
- High adoption of advanced technologies.
- Favorable regulatory environment.
- Strong presence of key players with established distribution networks.
The dominance of North America is primarily attributed to a combination of strong economic growth, high disposable income levels, and widespread adoption of technologically advanced dispensing solutions. The region’s well-established infrastructure and logistics networks further facilitate market penetration and growth. The presence of significant manufacturing and distribution facilities within the region lowers operational costs and shortens supply chains. Favorable government regulations and incentives for energy-efficient technologies further boost market expansion.
Refrigerated Beverage Dispensers Product Developments
Recent product innovations focus on enhanced energy efficiency, smart connectivity, improved hygiene features, and customizable beverage options. Manufacturers are integrating advanced filtration systems, UV sterilization, and self-cleaning mechanisms to enhance hygiene and product quality. The introduction of smart dispensers with connectivity features allows for remote monitoring, data analytics, and optimized maintenance. These developments cater to evolving consumer preferences for convenience, hygiene, and sustainability.
Report Scope & Segmentation Analysis
The report segments the market based on product type (countertop, floor-standing, wall-mounted), capacity (under 5 gallons, 5-10 gallons, above 10 gallons), application (commercial, residential), and geography (North America, Europe, Asia-Pacific, etc.). Growth projections vary significantly across segments. For instance, the commercial segment is expected to witness higher growth compared to the residential segment, driven by increasing demand from the hospitality and office sectors. The competitive landscape varies across segments with certain players dominating specific applications or product categories.
Key Drivers of Refrigerated Beverage Dispensers Growth
Several factors are driving the growth of the refrigerated beverage dispensers market. Technological advancements in energy efficiency and smart features are significant drivers. The rising demand for convenient and readily available beverages in both commercial and residential settings contributes significantly. Furthermore, the growing focus on health and hygiene is boosting the adoption of advanced filtration and sanitation technologies. Government regulations promoting energy efficiency are positively impacting market growth.
Challenges in the Refrigerated Beverage Dispensers Sector
The market faces challenges such as the high initial investment cost for advanced models, which can be a barrier for smaller businesses. Supply chain disruptions and rising raw material costs pose significant challenges impacting production and pricing. Intense competition from established and emerging players leads to price pressure and necessitates continuous innovation. Stringent regulations regarding energy consumption and water quality add to the cost of compliance and affect profitability.
Emerging Opportunities in Refrigerated Beverage Dispensers
Emerging opportunities include the increasing demand for sustainable and eco-friendly models, smart dispensers with data analytics capabilities, and customized beverage dispensing solutions. Expansion into untapped markets and emerging economies presents significant growth potential. The integration of advanced technologies, such as IoT and AI, offers opportunities for creating smarter and more efficient dispensing systems.
Leading Players in the Refrigerated Beverage Dispensers Market
- Waterlogic
- Follett
- Elkay Manufacturing
- BRITA
- SodaStream
- Naturizzata Water
- Bevi
- Cornelius
- Natura Water
- Springking Industry
- HOSHIZAKI
- Electrolux Professional
- SantosCornelius,Inc
- ASCO DRINK MACHINES
- Stoeltin
- SPM Drink Systems
Key Developments in Refrigerated Beverage Dispensers Industry
- 2022 Q4: Waterlogic launched a new line of energy-efficient dispensers.
- 2023 Q1: Follett acquired a smaller competitor, expanding its market share.
- 2023 Q3: Elkay introduced a smart dispenser with remote monitoring capabilities.
- 2024 Q2: A significant increase in demand for sustainable and eco-friendly models was observed across the market.
Strategic Outlook for Refrigerated Beverage Dispensers Market
The market is poised for sustained growth, driven by technological innovations, increasing health consciousness, and the growing demand for convenient beverage solutions. Focus on energy efficiency, smart features, and hygiene will be crucial for sustained market success. Expansion into emerging markets and strategic partnerships will be critical for players aiming to gain a competitive advantage. The market will continue to evolve with increased focus on sustainability and personalized beverage options.
Refrigerated Beverage Dispensers Segmentation
-
1. Application
- 1.1. Restaurants
- 1.2. Hotels
- 1.3. Others
-
2. Types
- 2.1. Countertop Dispenser
- 2.2. Floor–Standing Dispenser
Refrigerated Beverage Dispensers Segmentation By Geography
-
1. North America
- 1.1. United States
- 1.2. Canada
- 1.3. Mexico
-
2. South America
- 2.1. Brazil
- 2.2. Argentina
- 2.3. Rest of South America
-
3. Europe
- 3.1. United Kingdom
- 3.2. Germany
- 3.3. France
- 3.4. Italy
- 3.5. Spain
- 3.6. Russia
- 3.7. Benelux
- 3.8. Nordics
- 3.9. Rest of Europe
-
4. Middle East & Africa
- 4.1. Turkey
- 4.2. Israel
- 4.3. GCC
- 4.4. North Africa
- 4.5. South Africa
- 4.6. Rest of Middle East & Africa
-
5. Asia Pacific
- 5.1. China
- 5.2. India
- 5.3. Japan
- 5.4. South Korea
- 5.5. ASEAN
- 5.6. Oceania
- 5.7. Rest of Asia Pacific
Refrigerated Beverage Dispensers Regional Market Share
Geographic Coverage of Refrigerated Beverage Dispensers
Refrigerated Beverage Dispensers REPORT HIGHLIGHTS
| Aspects | Details |
|---|---|
| Study Period | 2020-2034 |
| Base Year | 2025 |
| Estimated Year | 2026 |
| Forecast Period | 2026-2034 |
| Historical Period | 2020-2025 |
| Growth Rate | CAGR of 5.2% from 2020-2034 |
| Segmentation |
|
Table of Contents
- 1. Introduction
- 1.1. Research Scope
- 1.2. Market Segmentation
- 1.3. Research Methodology
- 1.4. Definitions and Assumptions
- 2. Executive Summary
- 2.1. Introduction
- 3. Market Dynamics
- 3.1. Introduction
- 3.2. Market Drivers
- 3.3. Market Restrains
- 3.4. Market Trends
- 4. Market Factor Analysis
- 4.1. Porters Five Forces
- 4.2. Supply/Value Chain
- 4.3. PESTEL analysis
- 4.4. Market Entropy
- 4.5. Patent/Trademark Analysis
- 5. Global Refrigerated Beverage Dispensers Analysis, Insights and Forecast, 2020-2032
- 5.1. Market Analysis, Insights and Forecast - by Application
- 5.1.1. Restaurants
- 5.1.2. Hotels
- 5.1.3. Others
- 5.2. Market Analysis, Insights and Forecast - by Types
- 5.2.1. Countertop Dispenser
- 5.2.2. Floor–Standing Dispenser
- 5.3. Market Analysis, Insights and Forecast - by Region
- 5.3.1. North America
- 5.3.2. South America
- 5.3.3. Europe
- 5.3.4. Middle East & Africa
- 5.3.5. Asia Pacific
- 5.1. Market Analysis, Insights and Forecast - by Application
- 6. North America Refrigerated Beverage Dispensers Analysis, Insights and Forecast, 2020-2032
- 6.1. Market Analysis, Insights and Forecast - by Application
- 6.1.1. Restaurants
- 6.1.2. Hotels
- 6.1.3. Others
- 6.2. Market Analysis, Insights and Forecast - by Types
- 6.2.1. Countertop Dispenser
- 6.2.2. Floor–Standing Dispenser
- 6.1. Market Analysis, Insights and Forecast - by Application
- 7. South America Refrigerated Beverage Dispensers Analysis, Insights and Forecast, 2020-2032
- 7.1. Market Analysis, Insights and Forecast - by Application
- 7.1.1. Restaurants
- 7.1.2. Hotels
- 7.1.3. Others
- 7.2. Market Analysis, Insights and Forecast - by Types
- 7.2.1. Countertop Dispenser
- 7.2.2. Floor–Standing Dispenser
- 7.1. Market Analysis, Insights and Forecast - by Application
- 8. Europe Refrigerated Beverage Dispensers Analysis, Insights and Forecast, 2020-2032
- 8.1. Market Analysis, Insights and Forecast - by Application
- 8.1.1. Restaurants
- 8.1.2. Hotels
- 8.1.3. Others
- 8.2. Market Analysis, Insights and Forecast - by Types
- 8.2.1. Countertop Dispenser
- 8.2.2. Floor–Standing Dispenser
- 8.1. Market Analysis, Insights and Forecast - by Application
- 9. Middle East & Africa Refrigerated Beverage Dispensers Analysis, Insights and Forecast, 2020-2032
- 9.1. Market Analysis, Insights and Forecast - by Application
- 9.1.1. Restaurants
- 9.1.2. Hotels
- 9.1.3. Others
- 9.2. Market Analysis, Insights and Forecast - by Types
- 9.2.1. Countertop Dispenser
- 9.2.2. Floor–Standing Dispenser
- 9.1. Market Analysis, Insights and Forecast - by Application
- 10. Asia Pacific Refrigerated Beverage Dispensers Analysis, Insights and Forecast, 2020-2032
- 10.1. Market Analysis, Insights and Forecast - by Application
- 10.1.1. Restaurants
- 10.1.2. Hotels
- 10.1.3. Others
- 10.2. Market Analysis, Insights and Forecast - by Types
- 10.2.1. Countertop Dispenser
- 10.2.2. Floor–Standing Dispenser
- 10.1. Market Analysis, Insights and Forecast - by Application
- 11. Competitive Analysis
- 11.1. Global Market Share Analysis 2025
- 11.2. Company Profiles
- 11.2.1 Waterlogic
- 11.2.1.1. Overview
- 11.2.1.2. Products
- 11.2.1.3. SWOT Analysis
- 11.2.1.4. Recent Developments
- 11.2.1.5. Financials (Based on Availability)
- 11.2.2 Follett
- 11.2.2.1. Overview
- 11.2.2.2. Products
- 11.2.2.3. SWOT Analysis
- 11.2.2.4. Recent Developments
- 11.2.2.5. Financials (Based on Availability)
- 11.2.3 Elkay Manufacturing
- 11.2.3.1. Overview
- 11.2.3.2. Products
- 11.2.3.3. SWOT Analysis
- 11.2.3.4. Recent Developments
- 11.2.3.5. Financials (Based on Availability)
- 11.2.4 BRITA
- 11.2.4.1. Overview
- 11.2.4.2. Products
- 11.2.4.3. SWOT Analysis
- 11.2.4.4. Recent Developments
- 11.2.4.5. Financials (Based on Availability)
- 11.2.5 SodaStream
- 11.2.5.1. Overview
- 11.2.5.2. Products
- 11.2.5.3. SWOT Analysis
- 11.2.5.4. Recent Developments
- 11.2.5.5. Financials (Based on Availability)
- 11.2.6 Naturizzata Water
- 11.2.6.1. Overview
- 11.2.6.2. Products
- 11.2.6.3. SWOT Analysis
- 11.2.6.4. Recent Developments
- 11.2.6.5. Financials (Based on Availability)
- 11.2.7 Bevi
- 11.2.7.1. Overview
- 11.2.7.2. Products
- 11.2.7.3. SWOT Analysis
- 11.2.7.4. Recent Developments
- 11.2.7.5. Financials (Based on Availability)
- 11.2.8 Cornelius
- 11.2.8.1. Overview
- 11.2.8.2. Products
- 11.2.8.3. SWOT Analysis
- 11.2.8.4. Recent Developments
- 11.2.8.5. Financials (Based on Availability)
- 11.2.9 Natura Water
- 11.2.9.1. Overview
- 11.2.9.2. Products
- 11.2.9.3. SWOT Analysis
- 11.2.9.4. Recent Developments
- 11.2.9.5. Financials (Based on Availability)
- 11.2.10 Springking Industry
- 11.2.10.1. Overview
- 11.2.10.2. Products
- 11.2.10.3. SWOT Analysis
- 11.2.10.4. Recent Developments
- 11.2.10.5. Financials (Based on Availability)
- 11.2.11 HOSHIZAKI
- 11.2.11.1. Overview
- 11.2.11.2. Products
- 11.2.11.3. SWOT Analysis
- 11.2.11.4. Recent Developments
- 11.2.11.5. Financials (Based on Availability)
- 11.2.12 Electrolux Professional
- 11.2.12.1. Overview
- 11.2.12.2. Products
- 11.2.12.3. SWOT Analysis
- 11.2.12.4. Recent Developments
- 11.2.12.5. Financials (Based on Availability)
- 11.2.13 SantosCornelius,Inc
- 11.2.13.1. Overview
- 11.2.13.2. Products
- 11.2.13.3. SWOT Analysis
- 11.2.13.4. Recent Developments
- 11.2.13.5. Financials (Based on Availability)
- 11.2.14 ASCO DRINK MACHINES
- 11.2.14.1. Overview
- 11.2.14.2. Products
- 11.2.14.3. SWOT Analysis
- 11.2.14.4. Recent Developments
- 11.2.14.5. Financials (Based on Availability)
- 11.2.15 Stoeltin
- 11.2.15.1. Overview
- 11.2.15.2. Products
- 11.2.15.3. SWOT Analysis
- 11.2.15.4. Recent Developments
- 11.2.15.5. Financials (Based on Availability)
- 11.2.16 SPM Drink Systems
- 11.2.16.1. Overview
- 11.2.16.2. Products
- 11.2.16.3. SWOT Analysis
- 11.2.16.4. Recent Developments
- 11.2.16.5. Financials (Based on Availability)
- 11.2.1 Waterlogic
List of Figures
- Figure 1: Global Refrigerated Beverage Dispensers Revenue Breakdown (undefined, %) by Region 2025 & 2033
- Figure 2: Global Refrigerated Beverage Dispensers Volume Breakdown (K, %) by Region 2025 & 2033
- Figure 3: North America Refrigerated Beverage Dispensers Revenue (undefined), by Application 2025 & 2033
- Figure 4: North America Refrigerated Beverage Dispensers Volume (K), by Application 2025 & 2033
- Figure 5: North America Refrigerated Beverage Dispensers Revenue Share (%), by Application 2025 & 2033
- Figure 6: North America Refrigerated Beverage Dispensers Volume Share (%), by Application 2025 & 2033
- Figure 7: North America Refrigerated Beverage Dispensers Revenue (undefined), by Types 2025 & 2033
- Figure 8: North America Refrigerated Beverage Dispensers Volume (K), by Types 2025 & 2033
- Figure 9: North America Refrigerated Beverage Dispensers Revenue Share (%), by Types 2025 & 2033
- Figure 10: North America Refrigerated Beverage Dispensers Volume Share (%), by Types 2025 & 2033
- Figure 11: North America Refrigerated Beverage Dispensers Revenue (undefined), by Country 2025 & 2033
- Figure 12: North America Refrigerated Beverage Dispensers Volume (K), by Country 2025 & 2033
- Figure 13: North America Refrigerated Beverage Dispensers Revenue Share (%), by Country 2025 & 2033
- Figure 14: North America Refrigerated Beverage Dispensers Volume Share (%), by Country 2025 & 2033
- Figure 15: South America Refrigerated Beverage Dispensers Revenue (undefined), by Application 2025 & 2033
- Figure 16: South America Refrigerated Beverage Dispensers Volume (K), by Application 2025 & 2033
- Figure 17: South America Refrigerated Beverage Dispensers Revenue Share (%), by Application 2025 & 2033
- Figure 18: South America Refrigerated Beverage Dispensers Volume Share (%), by Application 2025 & 2033
- Figure 19: South America Refrigerated Beverage Dispensers Revenue (undefined), by Types 2025 & 2033
- Figure 20: South America Refrigerated Beverage Dispensers Volume (K), by Types 2025 & 2033
- Figure 21: South America Refrigerated Beverage Dispensers Revenue Share (%), by Types 2025 & 2033
- Figure 22: South America Refrigerated Beverage Dispensers Volume Share (%), by Types 2025 & 2033
- Figure 23: South America Refrigerated Beverage Dispensers Revenue (undefined), by Country 2025 & 2033
- Figure 24: South America Refrigerated Beverage Dispensers Volume (K), by Country 2025 & 2033
- Figure 25: South America Refrigerated Beverage Dispensers Revenue Share (%), by Country 2025 & 2033
- Figure 26: South America Refrigerated Beverage Dispensers Volume Share (%), by Country 2025 & 2033
- Figure 27: Europe Refrigerated Beverage Dispensers Revenue (undefined), by Application 2025 & 2033
- Figure 28: Europe Refrigerated Beverage Dispensers Volume (K), by Application 2025 & 2033
- Figure 29: Europe Refrigerated Beverage Dispensers Revenue Share (%), by Application 2025 & 2033
- Figure 30: Europe Refrigerated Beverage Dispensers Volume Share (%), by Application 2025 & 2033
- Figure 31: Europe Refrigerated Beverage Dispensers Revenue (undefined), by Types 2025 & 2033
- Figure 32: Europe Refrigerated Beverage Dispensers Volume (K), by Types 2025 & 2033
- Figure 33: Europe Refrigerated Beverage Dispensers Revenue Share (%), by Types 2025 & 2033
- Figure 34: Europe Refrigerated Beverage Dispensers Volume Share (%), by Types 2025 & 2033
- Figure 35: Europe Refrigerated Beverage Dispensers Revenue (undefined), by Country 2025 & 2033
- Figure 36: Europe Refrigerated Beverage Dispensers Volume (K), by Country 2025 & 2033
- Figure 37: Europe Refrigerated Beverage Dispensers Revenue Share (%), by Country 2025 & 2033
- Figure 38: Europe Refrigerated Beverage Dispensers Volume Share (%), by Country 2025 & 2033
- Figure 39: Middle East & Africa Refrigerated Beverage Dispensers Revenue (undefined), by Application 2025 & 2033
- Figure 40: Middle East & Africa Refrigerated Beverage Dispensers Volume (K), by Application 2025 & 2033
- Figure 41: Middle East & Africa Refrigerated Beverage Dispensers Revenue Share (%), by Application 2025 & 2033
- Figure 42: Middle East & Africa Refrigerated Beverage Dispensers Volume Share (%), by Application 2025 & 2033
- Figure 43: Middle East & Africa Refrigerated Beverage Dispensers Revenue (undefined), by Types 2025 & 2033
- Figure 44: Middle East & Africa Refrigerated Beverage Dispensers Volume (K), by Types 2025 & 2033
- Figure 45: Middle East & Africa Refrigerated Beverage Dispensers Revenue Share (%), by Types 2025 & 2033
- Figure 46: Middle East & Africa Refrigerated Beverage Dispensers Volume Share (%), by Types 2025 & 2033
- Figure 47: Middle East & Africa Refrigerated Beverage Dispensers Revenue (undefined), by Country 2025 & 2033
- Figure 48: Middle East & Africa Refrigerated Beverage Dispensers Volume (K), by Country 2025 & 2033
- Figure 49: Middle East & Africa Refrigerated Beverage Dispensers Revenue Share (%), by Country 2025 & 2033
- Figure 50: Middle East & Africa Refrigerated Beverage Dispensers Volume Share (%), by Country 2025 & 2033
- Figure 51: Asia Pacific Refrigerated Beverage Dispensers Revenue (undefined), by Application 2025 & 2033
- Figure 52: Asia Pacific Refrigerated Beverage Dispensers Volume (K), by Application 2025 & 2033
- Figure 53: Asia Pacific Refrigerated Beverage Dispensers Revenue Share (%), by Application 2025 & 2033
- Figure 54: Asia Pacific Refrigerated Beverage Dispensers Volume Share (%), by Application 2025 & 2033
- Figure 55: Asia Pacific Refrigerated Beverage Dispensers Revenue (undefined), by Types 2025 & 2033
- Figure 56: Asia Pacific Refrigerated Beverage Dispensers Volume (K), by Types 2025 & 2033
- Figure 57: Asia Pacific Refrigerated Beverage Dispensers Revenue Share (%), by Types 2025 & 2033
- Figure 58: Asia Pacific Refrigerated Beverage Dispensers Volume Share (%), by Types 2025 & 2033
- Figure 59: Asia Pacific Refrigerated Beverage Dispensers Revenue (undefined), by Country 2025 & 2033
- Figure 60: Asia Pacific Refrigerated Beverage Dispensers Volume (K), by Country 2025 & 2033
- Figure 61: Asia Pacific Refrigerated Beverage Dispensers Revenue Share (%), by Country 2025 & 2033
- Figure 62: Asia Pacific Refrigerated Beverage Dispensers Volume Share (%), by Country 2025 & 2033
List of Tables
- Table 1: Global Refrigerated Beverage Dispensers Revenue undefined Forecast, by Application 2020 & 2033
- Table 2: Global Refrigerated Beverage Dispensers Volume K Forecast, by Application 2020 & 2033
- Table 3: Global Refrigerated Beverage Dispensers Revenue undefined Forecast, by Types 2020 & 2033
- Table 4: Global Refrigerated Beverage Dispensers Volume K Forecast, by Types 2020 & 2033
- Table 5: Global Refrigerated Beverage Dispensers Revenue undefined Forecast, by Region 2020 & 2033
- Table 6: Global Refrigerated Beverage Dispensers Volume K Forecast, by Region 2020 & 2033
- Table 7: Global Refrigerated Beverage Dispensers Revenue undefined Forecast, by Application 2020 & 2033
- Table 8: Global Refrigerated Beverage Dispensers Volume K Forecast, by Application 2020 & 2033
- Table 9: Global Refrigerated Beverage Dispensers Revenue undefined Forecast, by Types 2020 & 2033
- Table 10: Global Refrigerated Beverage Dispensers Volume K Forecast, by Types 2020 & 2033
- Table 11: Global Refrigerated Beverage Dispensers Revenue undefined Forecast, by Country 2020 & 2033
- Table 12: Global Refrigerated Beverage Dispensers Volume K Forecast, by Country 2020 & 2033
- Table 13: United States Refrigerated Beverage Dispensers Revenue (undefined) Forecast, by Application 2020 & 2033
- Table 14: United States Refrigerated Beverage Dispensers Volume (K) Forecast, by Application 2020 & 2033
- Table 15: Canada Refrigerated Beverage Dispensers Revenue (undefined) Forecast, by Application 2020 & 2033
- Table 16: Canada Refrigerated Beverage Dispensers Volume (K) Forecast, by Application 2020 & 2033
- Table 17: Mexico Refrigerated Beverage Dispensers Revenue (undefined) Forecast, by Application 2020 & 2033
- Table 18: Mexico Refrigerated Beverage Dispensers Volume (K) Forecast, by Application 2020 & 2033
- Table 19: Global Refrigerated Beverage Dispensers Revenue undefined Forecast, by Application 2020 & 2033
- Table 20: Global Refrigerated Beverage Dispensers Volume K Forecast, by Application 2020 & 2033
- Table 21: Global Refrigerated Beverage Dispensers Revenue undefined Forecast, by Types 2020 & 2033
- Table 22: Global Refrigerated Beverage Dispensers Volume K Forecast, by Types 2020 & 2033
- Table 23: Global Refrigerated Beverage Dispensers Revenue undefined Forecast, by Country 2020 & 2033
- Table 24: Global Refrigerated Beverage Dispensers Volume K Forecast, by Country 2020 & 2033
- Table 25: Brazil Refrigerated Beverage Dispensers Revenue (undefined) Forecast, by Application 2020 & 2033
- Table 26: Brazil Refrigerated Beverage Dispensers Volume (K) Forecast, by Application 2020 & 2033
- Table 27: Argentina Refrigerated Beverage Dispensers Revenue (undefined) Forecast, by Application 2020 & 2033
- Table 28: Argentina Refrigerated Beverage Dispensers Volume (K) Forecast, by Application 2020 & 2033
- Table 29: Rest of South America Refrigerated Beverage Dispensers Revenue (undefined) Forecast, by Application 2020 & 2033
- Table 30: Rest of South America Refrigerated Beverage Dispensers Volume (K) Forecast, by Application 2020 & 2033
- Table 31: Global Refrigerated Beverage Dispensers Revenue undefined Forecast, by Application 2020 & 2033
- Table 32: Global Refrigerated Beverage Dispensers Volume K Forecast, by Application 2020 & 2033
- Table 33: Global Refrigerated Beverage Dispensers Revenue undefined Forecast, by Types 2020 & 2033
- Table 34: Global Refrigerated Beverage Dispensers Volume K Forecast, by Types 2020 & 2033
- Table 35: Global Refrigerated Beverage Dispensers Revenue undefined Forecast, by Country 2020 & 2033
- Table 36: Global Refrigerated Beverage Dispensers Volume K Forecast, by Country 2020 & 2033
- Table 37: United Kingdom Refrigerated Beverage Dispensers Revenue (undefined) Forecast, by Application 2020 & 2033
- Table 38: United Kingdom Refrigerated Beverage Dispensers Volume (K) Forecast, by Application 2020 & 2033
- Table 39: Germany Refrigerated Beverage Dispensers Revenue (undefined) Forecast, by Application 2020 & 2033
- Table 40: Germany Refrigerated Beverage Dispensers Volume (K) Forecast, by Application 2020 & 2033
- Table 41: France Refrigerated Beverage Dispensers Revenue (undefined) Forecast, by Application 2020 & 2033
- Table 42: France Refrigerated Beverage Dispensers Volume (K) Forecast, by Application 2020 & 2033
- Table 43: Italy Refrigerated Beverage Dispensers Revenue (undefined) Forecast, by Application 2020 & 2033
- Table 44: Italy Refrigerated Beverage Dispensers Volume (K) Forecast, by Application 2020 & 2033
- Table 45: Spain Refrigerated Beverage Dispensers Revenue (undefined) Forecast, by Application 2020 & 2033
- Table 46: Spain Refrigerated Beverage Dispensers Volume (K) Forecast, by Application 2020 & 2033
- Table 47: Russia Refrigerated Beverage Dispensers Revenue (undefined) Forecast, by Application 2020 & 2033
- Table 48: Russia Refrigerated Beverage Dispensers Volume (K) Forecast, by Application 2020 & 2033
- Table 49: Benelux Refrigerated Beverage Dispensers Revenue (undefined) Forecast, by Application 2020 & 2033
- Table 50: Benelux Refrigerated Beverage Dispensers Volume (K) Forecast, by Application 2020 & 2033
- Table 51: Nordics Refrigerated Beverage Dispensers Revenue (undefined) Forecast, by Application 2020 & 2033
- Table 52: Nordics Refrigerated Beverage Dispensers Volume (K) Forecast, by Application 2020 & 2033
- Table 53: Rest of Europe Refrigerated Beverage Dispensers Revenue (undefined) Forecast, by Application 2020 & 2033
- Table 54: Rest of Europe Refrigerated Beverage Dispensers Volume (K) Forecast, by Application 2020 & 2033
- Table 55: Global Refrigerated Beverage Dispensers Revenue undefined Forecast, by Application 2020 & 2033
- Table 56: Global Refrigerated Beverage Dispensers Volume K Forecast, by Application 2020 & 2033
- Table 57: Global Refrigerated Beverage Dispensers Revenue undefined Forecast, by Types 2020 & 2033
- Table 58: Global Refrigerated Beverage Dispensers Volume K Forecast, by Types 2020 & 2033
- Table 59: Global Refrigerated Beverage Dispensers Revenue undefined Forecast, by Country 2020 & 2033
- Table 60: Global Refrigerated Beverage Dispensers Volume K Forecast, by Country 2020 & 2033
- Table 61: Turkey Refrigerated Beverage Dispensers Revenue (undefined) Forecast, by Application 2020 & 2033
- Table 62: Turkey Refrigerated Beverage Dispensers Volume (K) Forecast, by Application 2020 & 2033
- Table 63: Israel Refrigerated Beverage Dispensers Revenue (undefined) Forecast, by Application 2020 & 2033
- Table 64: Israel Refrigerated Beverage Dispensers Volume (K) Forecast, by Application 2020 & 2033
- Table 65: GCC Refrigerated Beverage Dispensers Revenue (undefined) Forecast, by Application 2020 & 2033
- Table 66: GCC Refrigerated Beverage Dispensers Volume (K) Forecast, by Application 2020 & 2033
- Table 67: North Africa Refrigerated Beverage Dispensers Revenue (undefined) Forecast, by Application 2020 & 2033
- Table 68: North Africa Refrigerated Beverage Dispensers Volume (K) Forecast, by Application 2020 & 2033
- Table 69: South Africa Refrigerated Beverage Dispensers Revenue (undefined) Forecast, by Application 2020 & 2033
- Table 70: South Africa Refrigerated Beverage Dispensers Volume (K) Forecast, by Application 2020 & 2033
- Table 71: Rest of Middle East & Africa Refrigerated Beverage Dispensers Revenue (undefined) Forecast, by Application 2020 & 2033
- Table 72: Rest of Middle East & Africa Refrigerated Beverage Dispensers Volume (K) Forecast, by Application 2020 & 2033
- Table 73: Global Refrigerated Beverage Dispensers Revenue undefined Forecast, by Application 2020 & 2033
- Table 74: Global Refrigerated Beverage Dispensers Volume K Forecast, by Application 2020 & 2033
- Table 75: Global Refrigerated Beverage Dispensers Revenue undefined Forecast, by Types 2020 & 2033
- Table 76: Global Refrigerated Beverage Dispensers Volume K Forecast, by Types 2020 & 2033
- Table 77: Global Refrigerated Beverage Dispensers Revenue undefined Forecast, by Country 2020 & 2033
- Table 78: Global Refrigerated Beverage Dispensers Volume K Forecast, by Country 2020 & 2033
- Table 79: China Refrigerated Beverage Dispensers Revenue (undefined) Forecast, by Application 2020 & 2033
- Table 80: China Refrigerated Beverage Dispensers Volume (K) Forecast, by Application 2020 & 2033
- Table 81: India Refrigerated Beverage Dispensers Revenue (undefined) Forecast, by Application 2020 & 2033
- Table 82: India Refrigerated Beverage Dispensers Volume (K) Forecast, by Application 2020 & 2033
- Table 83: Japan Refrigerated Beverage Dispensers Revenue (undefined) Forecast, by Application 2020 & 2033
- Table 84: Japan Refrigerated Beverage Dispensers Volume (K) Forecast, by Application 2020 & 2033
- Table 85: South Korea Refrigerated Beverage Dispensers Revenue (undefined) Forecast, by Application 2020 & 2033
- Table 86: South Korea Refrigerated Beverage Dispensers Volume (K) Forecast, by Application 2020 & 2033
- Table 87: ASEAN Refrigerated Beverage Dispensers Revenue (undefined) Forecast, by Application 2020 & 2033
- Table 88: ASEAN Refrigerated Beverage Dispensers Volume (K) Forecast, by Application 2020 & 2033
- Table 89: Oceania Refrigerated Beverage Dispensers Revenue (undefined) Forecast, by Application 2020 & 2033
- Table 90: Oceania Refrigerated Beverage Dispensers Volume (K) Forecast, by Application 2020 & 2033
- Table 91: Rest of Asia Pacific Refrigerated Beverage Dispensers Revenue (undefined) Forecast, by Application 2020 & 2033
- Table 92: Rest of Asia Pacific Refrigerated Beverage Dispensers Volume (K) Forecast, by Application 2020 & 2033
Frequently Asked Questions
1. What is the projected Compound Annual Growth Rate (CAGR) of the Refrigerated Beverage Dispensers?
The projected CAGR is approximately 5.2%.
2. Which companies are prominent players in the Refrigerated Beverage Dispensers?
Key companies in the market include Waterlogic, Follett, Elkay Manufacturing, BRITA, SodaStream, Naturizzata Water, Bevi, Cornelius, Natura Water, Springking Industry, HOSHIZAKI, Electrolux Professional, SantosCornelius,Inc, ASCO DRINK MACHINES, Stoeltin, SPM Drink Systems.
3. What are the main segments of the Refrigerated Beverage Dispensers?
The market segments include Application, Types.
4. Can you provide details about the market size?
The market size is estimated to be USD XXX N/A as of 2022.
5. What are some drivers contributing to market growth?
N/A
6. What are the notable trends driving market growth?
N/A
7. Are there any restraints impacting market growth?
N/A
8. Can you provide examples of recent developments in the market?
N/A
9. What pricing options are available for accessing the report?
Pricing options include single-user, multi-user, and enterprise licenses priced at USD 3350.00, USD 5025.00, and USD 6700.00 respectively.
10. Is the market size provided in terms of value or volume?
The market size is provided in terms of value, measured in N/A and volume, measured in K.
11. Are there any specific market keywords associated with the report?
Yes, the market keyword associated with the report is "Refrigerated Beverage Dispensers," which aids in identifying and referencing the specific market segment covered.
12. How do I determine which pricing option suits my needs best?
The pricing options vary based on user requirements and access needs. Individual users may opt for single-user licenses, while businesses requiring broader access may choose multi-user or enterprise licenses for cost-effective access to the report.
13. Are there any additional resources or data provided in the Refrigerated Beverage Dispensers report?
While the report offers comprehensive insights, it's advisable to review the specific contents or supplementary materials provided to ascertain if additional resources or data are available.
14. How can I stay updated on further developments or reports in the Refrigerated Beverage Dispensers?
To stay informed about further developments, trends, and reports in the Refrigerated Beverage Dispensers, consider subscribing to industry newsletters, following relevant companies and organizations, or regularly checking reputable industry news sources and publications.
Methodology
Step 1 - Identification of Relevant Samples Size from Population Database


Step 2 - Approaches for Defining Global Market Size (Value, Volume* & Price*)

Note*: In applicable scenarios
Step 3 - Data Sources
Primary Research
- Web Analytics
- Survey Reports
- Research Institute
- Latest Research Reports
- Opinion Leaders
Secondary Research
- Annual Reports
- White Paper
- Latest Press Release
- Industry Association
- Paid Database
- Investor Presentations

Step 4 - Data Triangulation
Involves using different sources of information in order to increase the validity of a study
These sources are likely to be stakeholders in a program - participants, other researchers, program staff, other community members, and so on.
Then we put all data in single framework & apply various statistical tools to find out the dynamic on the market.
During the analysis stage, feedback from the stakeholder groups would be compared to determine areas of agreement as well as areas of divergence