

Key Insights
The Remote Sensing Technology market is poised for significant expansion, driven by escalating demand across key sectors. Advancements in satellite technology, sensor miniaturization, and accessible data processing are primary growth enablers. Government initiatives in space exploration and national security, alongside the increasing use of remote sensing for precision agriculture, environmental monitoring, and urban planning, are crucial market catalysts. The market is segmented by end-user (commercial, military & government), satellite mass (<10kg to >1000kg), and orbit class (GEO, LEO, MEO). Commercial applications, particularly in agriculture and mapping, represent substantial market share. The proliferation of high-resolution imagery and advanced analytics further fuels this growth. While initial costs can be a consideration, the declining cost of satellite technology enhances accessibility. Innovations in hyperspectral imaging, LiDAR, and radar systems continually broaden remote sensing capabilities. Intense competition exists between established aerospace leaders and emerging players. The predicted CAGR of 11.59% indicates robust growth through 2033, presenting considerable market opportunities. Strategic partnerships and M&A activities are expected to shape the future market landscape.
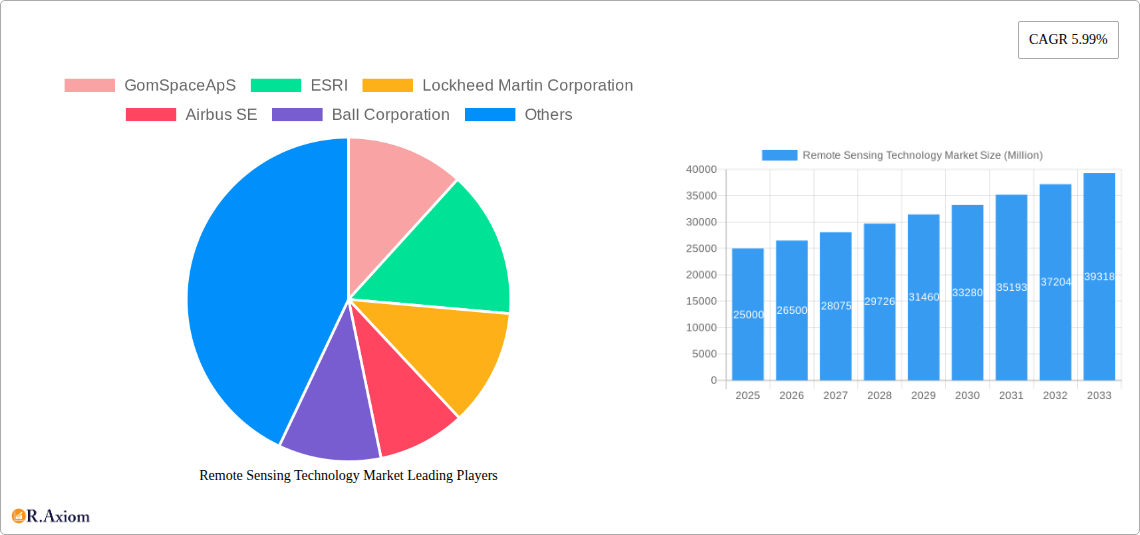
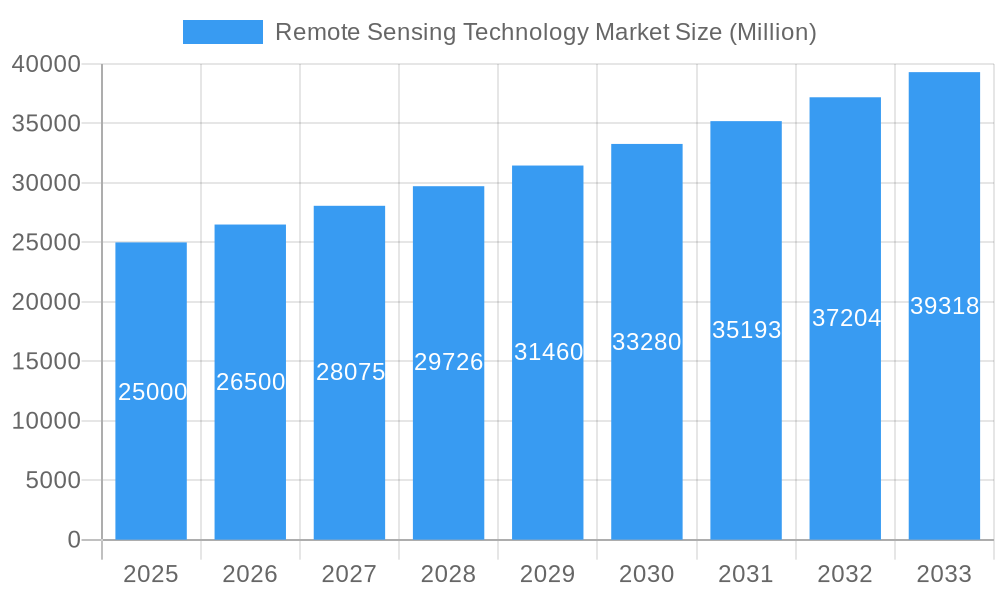
Remote Sensing Technology Market Market Size (In Billion)
The competitive environment features a blend of established entities and innovative startups. Key players are prioritizing strategic alliances, technological advancements, and global expansion. The 100-500kg satellite mass segment is projected for substantial growth due to its application versatility. LEO orbit class is anticipated to dominate due to cost-effectiveness and rapid small satellite deployment. Market expansion will be influenced by regulatory frameworks, technological breakthroughs, and evolving data analytics for processing the vast volumes of remote sensing data, including AI and machine learning for enhanced image analysis and predictive modeling. Continued satellite miniaturization and cost reduction are vital for broader accessibility and market growth.
Remote Sensing Technology Market Company Market Share
Remote Sensing Technology Market: Analysis and Forecast (2025-2033)
This comprehensive report analyzes the Remote Sensing Technology market, detailing market size, growth projections, segmentation, key players, and future trends. The base year is 2025, with an estimated market size of 25.37 billion. The forecast period extends from 2025 to 2033. This report is essential for investors, stakeholders, and decision-makers navigating this dynamic market and seeking to capitalize on emerging opportunities.
Remote Sensing Technology Market Market Concentration & Innovation
The Remote Sensing Technology market exhibits a moderately concentrated landscape, with several key players holding significant market share. However, the emergence of new technologies and innovative business models is fostering increased competition. Market concentration is influenced by factors including technological advancements, R&D investments, and M&A activities. The market share held by the top five players is estimated at xx%, while the remaining share is distributed among numerous smaller companies. Recent M&A activity has been characterized by strategic acquisitions aiming to expand market reach and technological capabilities. The total value of M&A deals in the past five years is estimated to be approximately $xx Million.
- Market Share Concentration: Top 5 players hold xx% of the market.
- M&A Activity: Total deal value (past 5 years) ~$xx Million.
- Innovation Drivers: Miniaturization of satellites, AI-powered image analysis, and advancements in sensor technology.
- Regulatory Frameworks: Government regulations regarding data privacy, spectrum allocation, and space debris mitigation significantly influence market dynamics.
- Product Substitutes: The limited availability of direct substitutes for remote sensing technology makes this market relatively resilient to substitution pressures.
- End-User Trends: Growing demand for high-resolution imagery and data analytics across diverse sectors drives market growth.
Remote Sensing Technology Market Industry Trends & Insights
The Remote Sensing Technology market is experiencing robust growth, driven by a confluence of factors. The compound annual growth rate (CAGR) during the forecast period (2025-2033) is projected to be xx%, fueled by increasing demand across various sectors, including agriculture, environmental monitoring, urban planning, and defense. Technological advancements, such as the development of smaller, more efficient satellites and improved data processing capabilities, are further accelerating market expansion. Market penetration in key sectors like precision agriculture and disaster management is witnessing significant improvement. Increased adoption of cloud-based data storage and analysis solutions is also driving market growth. Intense competition among established players and new entrants is shaping pricing strategies and technological innovation, leading to a dynamic market landscape. The market size is expected to reach $xx Million by 2033.
Dominant Markets & Segments in Remote Sensing Technology Market
The North American region currently dominates the Remote Sensing Technology market, followed by Europe and Asia-Pacific. This dominance is attributed to substantial government investments in space research, a robust private sector presence, and advanced technological capabilities. Within market segments:
- End User: The Military & Government segment holds the largest market share due to high demand for high-resolution imagery and intelligence gathering.
- Satellite Mass: The 10-100kg segment dominates due to cost-effectiveness and increasing availability of smallsat technologies.
- Orbit Class: The LEO (Low Earth Orbit) segment holds the largest share due to its advantages in image resolution and data acquisition frequency.
- Satellite Subsystem: The Satellite Bus & Subsystems segment accounts for a significant portion, reflecting the crucial role of robust satellite platforms.
Key Drivers for Regional Dominance:
- North America: Strong government support for space research, a flourishing private sector, and technological advancement.
- Europe: Significant investments in space exploration and Earth observation programs, coupled with a strong aerospace industry.
- Asia-Pacific: Rapid economic growth, increasing demand for environmental monitoring and infrastructure development.
Remote Sensing Technology Market Product Developments
Recent product innovations have focused on miniaturization of satellites, enabling more frequent and cost-effective data acquisition. Advancements in sensor technology are providing higher resolution imagery and more diverse data types. This is complemented by the development of sophisticated data analytics platforms that leverage AI and machine learning to extract valuable insights from the collected data. This aligns with the growing market demand for actionable information from remote sensing data across numerous sectors, enhancing the competitive advantages of providers.
Report Scope & Segmentation Analysis
This report comprehensively analyzes the Remote Sensing Technology market across several segments:
- End User: Commercial, Military & Government, Other – Growth projections vary significantly across these segments, with Military & Government showing strong growth due to national security applications.
- Satellite Mass: Below 10 Kg, 10-100kg, 100-500kg, 500-1000kg, above 1000kg – Market size and growth projections differ substantially, with smaller satellites driving significant market expansion.
- Orbit Class: GEO, LEO, MEO – LEO segment is projected to witness substantial growth, driven by its benefits in high-resolution imaging and data acquisition.
- Satellite Subsystem: Propulsion Hardware and Propellant, Satellite Bus & Subsystems, Solar Array & Power Hardware, Structures, Harness & Mechanisms – Each subsystem presents a unique market dynamic, with growth influenced by technological advancements and demand patterns. Market sizes and competitive landscapes are detailed for each.
Key Drivers of Remote Sensing Technology Market Growth
The Remote Sensing Technology market is experiencing significant growth, primarily due to technological advancements, such as the development of smaller, more efficient satellites and sophisticated data analytics platforms. Increased government funding for space exploration and earth observation initiatives, coupled with growing demand from commercial sectors like agriculture and infrastructure development, further fuels this growth. Stringent environmental regulations and the need for effective resource management create a compelling case for increased adoption of remote sensing technology.
Challenges in the Remote Sensing Technology Market Sector
Several challenges hinder the growth of the Remote Sensing Technology market. These include high initial investment costs, the complexity of data analysis, and potential regulatory hurdles related to data privacy and spectrum allocation. Supply chain disruptions and competition from established players can also impact market expansion. These challenges often result in limited market entry for new players and slower-than-expected adoption rates in some regions.
Emerging Opportunities in Remote Sensing Technology Market
The Remote Sensing Technology market offers significant emerging opportunities. The increasing adoption of IoT (Internet of Things) devices, the development of new sensor technologies (hyperspectral, LiDAR), and the rise of big data analytics create exciting prospects. Moreover, the potential for new applications in areas such as precision agriculture, climate change monitoring, and disaster response holds immense growth potential. The expansion into emerging markets, coupled with strategic partnerships, will further unlock market opportunities.
Leading Players in the Remote Sensing Technology Market Market
- GomSpace ApS
- ESRI
- Lockheed Martin Corporation
- Airbus SE
- Ball Corporation
- Japan Aerospace Exploration Agency (JAXA)
- China Aerospace Science and Technology Corporation (CASC)
- Maxar Technologies Inc
- ROSCOSMOS
- Thale
- Planet Labs Inc
- Northrop Grumman Corporation
- Indian Space Research Organisation (ISRO)
- IHI Corporation
- Spire Global Inc
Key Developments in Remote Sensing Technology Market Industry
- March 2023: JAXA scheduled the launch of the H3 Launch Vehicle with the ALOS-3 satellite, signaling advancements in Earth observation capabilities.
- February 2023: The NASA-Esri agreement broadened access to geospatial data, fostering collaboration and innovation in research and exploration.
- January 2023: Airbus Defence and Space secured a contract with Poland for two high-performance Earth observation satellites, showcasing growing demand for advanced geospatial intelligence systems.
Strategic Outlook for Remote Sensing Technology Market Market
The Remote Sensing Technology market is poised for significant growth, driven by technological advancements, increasing data demand, and substantial government and private sector investment. New applications in diverse sectors and the expansion into emerging markets will be major growth catalysts. Strategic partnerships, technological innovation, and efficient data management will be crucial for companies to gain a competitive edge in this expanding market. The long-term outlook is positive, indicating substantial market expansion in the coming years.
Remote Sensing Technology Market Segmentation
-
1. Satellite Mass
- 1.1. 10-100kg
- 1.2. 100-500kg
- 1.3. 500-1000kg
- 1.4. Below 10 Kg
- 1.5. above 1000kg
-
2. Orbit Class
- 2.1. GEO
- 2.2. LEO
- 2.3. MEO
-
3. Satellite Subsystem
- 3.1. Propulsion Hardware and Propellant
- 3.2. Satellite Bus & Subsystems
- 3.3. Solar Array & Power Hardware
- 3.4. Structures, Harness & Mechanisms
-
4. End User
- 4.1. Commercial
- 4.2. Military & Government
- 4.3. Other
Remote Sensing Technology Market Segmentation By Geography
-
1. North America
- 1.1. United States
- 1.2. Canada
- 1.3. Mexico
-
2. South America
- 2.1. Brazil
- 2.2. Argentina
- 2.3. Rest of South America
-
3. Europe
- 3.1. United Kingdom
- 3.2. Germany
- 3.3. France
- 3.4. Italy
- 3.5. Spain
- 3.6. Russia
- 3.7. Benelux
- 3.8. Nordics
- 3.9. Rest of Europe
-
4. Middle East & Africa
- 4.1. Turkey
- 4.2. Israel
- 4.3. GCC
- 4.4. North Africa
- 4.5. South Africa
- 4.6. Rest of Middle East & Africa
-
5. Asia Pacific
- 5.1. China
- 5.2. India
- 5.3. Japan
- 5.4. South Korea
- 5.5. ASEAN
- 5.6. Oceania
- 5.7. Rest of Asia Pacific
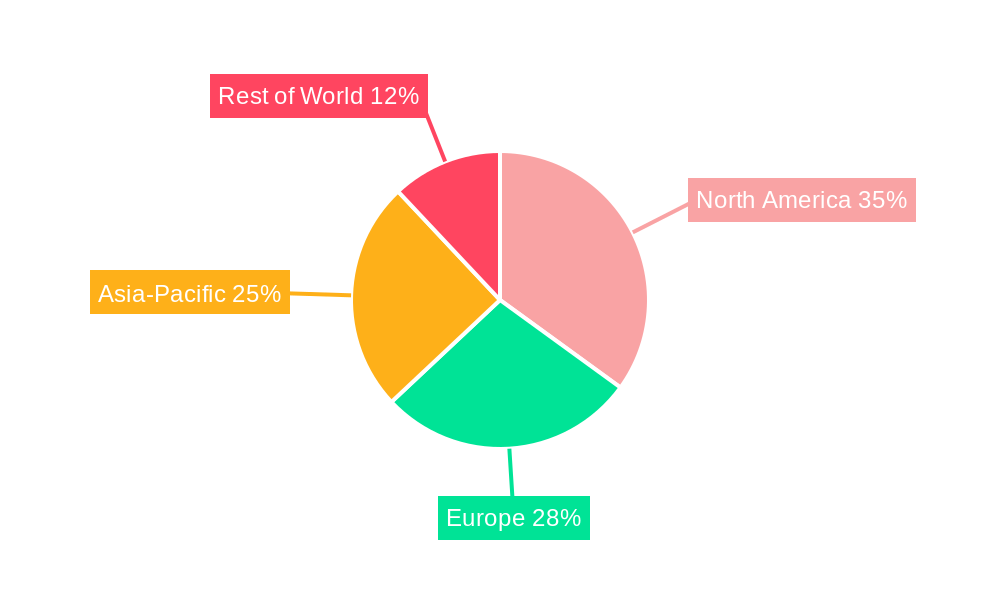
Remote Sensing Technology Market Regional Market Share
Geographic Coverage of Remote Sensing Technology Market
Remote Sensing Technology Market REPORT HIGHLIGHTS
| Aspects | Details |
|---|---|
| Study Period | 2020-2034 |
| Base Year | 2025 |
| Estimated Year | 2026 |
| Forecast Period | 2026-2034 |
| Historical Period | 2020-2025 |
| Growth Rate | CAGR of 11.59% from 2020-2034 |
| Segmentation |
|
Table of Contents
- 1. Introduction
- 1.1. Research Scope
- 1.2. Market Segmentation
- 1.3. Research Objective
- 1.4. Definitions and Assumptions
- 2. Executive Summary
- 2.1. Market Snapshot
- 3. Market Dynamics
- 3.1. Market Drivers
- 3.2. Market Restrains
- 3.3. Market Trends
- 3.4. Market Opportunities
- 4. Market Factor Analysis
- 4.1. Porters Five Forces
- 4.1.1. Bargaining Power of Suppliers
- 4.1.2. Bargaining Power of Buyers
- 4.1.3. Threat of New Entrants
- 4.1.4. Threat of Substitutes
- 4.1.5. Competitive Rivalry
- 4.2. PESTEL analysis
- 4.3. BCG Analysis
- 4.3.1. Stars (High Growth, High Market Share)
- 4.3.2. Cash Cows (Low Growth, High Market Share)
- 4.3.3. Question Mark (High Growth, Low Market Share)
- 4.3.4. Dogs (Low Growth, Low Market Share)
- 4.4. Ansoff Matrix Analysis
- 4.5. Supply Chain Analysis
- 4.6. Regulatory Landscape
- 4.7. Current Market Potential and Opportunity Assessment (TAM–SAM–SOM Framework)
- 4.8. RAX Analyst Note
- 4.1. Porters Five Forces
- 5. Market Analysis, Insights and Forecast 2021-2033
- 5.1. Market Analysis, Insights and Forecast - by Satellite Mass
- 5.1.1. 10-100kg
- 5.1.2. 100-500kg
- 5.1.3. 500-1000kg
- 5.1.4. Below 10 Kg
- 5.1.5. above 1000kg
- 5.2. Market Analysis, Insights and Forecast - by Orbit Class
- 5.2.1. GEO
- 5.2.2. LEO
- 5.2.3. MEO
- 5.3. Market Analysis, Insights and Forecast - by Satellite Subsystem
- 5.3.1. Propulsion Hardware and Propellant
- 5.3.2. Satellite Bus & Subsystems
- 5.3.3. Solar Array & Power Hardware
- 5.3.4. Structures, Harness & Mechanisms
- 5.4. Market Analysis, Insights and Forecast - by End User
- 5.4.1. Commercial
- 5.4.2. Military & Government
- 5.4.3. Other
- 5.5. Market Analysis, Insights and Forecast - by Region
- 5.5.1. North America
- 5.5.2. South America
- 5.5.3. Europe
- 5.5.4. Middle East & Africa
- 5.5.5. Asia Pacific
- 5.1. Market Analysis, Insights and Forecast - by Satellite Mass
- 6. Global Remote Sensing Technology Market Analysis, Insights and Forecast, 2021-2033
- 6.1. Market Analysis, Insights and Forecast - by Satellite Mass
- 6.1.1. 10-100kg
- 6.1.2. 100-500kg
- 6.1.3. 500-1000kg
- 6.1.4. Below 10 Kg
- 6.1.5. above 1000kg
- 6.2. Market Analysis, Insights and Forecast - by Orbit Class
- 6.2.1. GEO
- 6.2.2. LEO
- 6.2.3. MEO
- 6.3. Market Analysis, Insights and Forecast - by Satellite Subsystem
- 6.3.1. Propulsion Hardware and Propellant
- 6.3.2. Satellite Bus & Subsystems
- 6.3.3. Solar Array & Power Hardware
- 6.3.4. Structures, Harness & Mechanisms
- 6.4. Market Analysis, Insights and Forecast - by End User
- 6.4.1. Commercial
- 6.4.2. Military & Government
- 6.4.3. Other
- 6.1. Market Analysis, Insights and Forecast - by Satellite Mass
- 7. North America Remote Sensing Technology Market Analysis, Insights and Forecast, 2020-2032
- 7.1. Market Analysis, Insights and Forecast - by Satellite Mass
- 7.1.1. 10-100kg
- 7.1.2. 100-500kg
- 7.1.3. 500-1000kg
- 7.1.4. Below 10 Kg
- 7.1.5. above 1000kg
- 7.2. Market Analysis, Insights and Forecast - by Orbit Class
- 7.2.1. GEO
- 7.2.2. LEO
- 7.2.3. MEO
- 7.3. Market Analysis, Insights and Forecast - by Satellite Subsystem
- 7.3.1. Propulsion Hardware and Propellant
- 7.3.2. Satellite Bus & Subsystems
- 7.3.3. Solar Array & Power Hardware
- 7.3.4. Structures, Harness & Mechanisms
- 7.4. Market Analysis, Insights and Forecast - by End User
- 7.4.1. Commercial
- 7.4.2. Military & Government
- 7.4.3. Other
- 7.1. Market Analysis, Insights and Forecast - by Satellite Mass
- 8. South America Remote Sensing Technology Market Analysis, Insights and Forecast, 2020-2032
- 8.1. Market Analysis, Insights and Forecast - by Satellite Mass
- 8.1.1. 10-100kg
- 8.1.2. 100-500kg
- 8.1.3. 500-1000kg
- 8.1.4. Below 10 Kg
- 8.1.5. above 1000kg
- 8.2. Market Analysis, Insights and Forecast - by Orbit Class
- 8.2.1. GEO
- 8.2.2. LEO
- 8.2.3. MEO
- 8.3. Market Analysis, Insights and Forecast - by Satellite Subsystem
- 8.3.1. Propulsion Hardware and Propellant
- 8.3.2. Satellite Bus & Subsystems
- 8.3.3. Solar Array & Power Hardware
- 8.3.4. Structures, Harness & Mechanisms
- 8.4. Market Analysis, Insights and Forecast - by End User
- 8.4.1. Commercial
- 8.4.2. Military & Government
- 8.4.3. Other
- 8.1. Market Analysis, Insights and Forecast - by Satellite Mass
- 9. Europe Remote Sensing Technology Market Analysis, Insights and Forecast, 2020-2032
- 9.1. Market Analysis, Insights and Forecast - by Satellite Mass
- 9.1.1. 10-100kg
- 9.1.2. 100-500kg
- 9.1.3. 500-1000kg
- 9.1.4. Below 10 Kg
- 9.1.5. above 1000kg
- 9.2. Market Analysis, Insights and Forecast - by Orbit Class
- 9.2.1. GEO
- 9.2.2. LEO
- 9.2.3. MEO
- 9.3. Market Analysis, Insights and Forecast - by Satellite Subsystem
- 9.3.1. Propulsion Hardware and Propellant
- 9.3.2. Satellite Bus & Subsystems
- 9.3.3. Solar Array & Power Hardware
- 9.3.4. Structures, Harness & Mechanisms
- 9.4. Market Analysis, Insights and Forecast - by End User
- 9.4.1. Commercial
- 9.4.2. Military & Government
- 9.4.3. Other
- 9.1. Market Analysis, Insights and Forecast - by Satellite Mass
- 10. Middle East & Africa Remote Sensing Technology Market Analysis, Insights and Forecast, 2020-2032
- 10.1. Market Analysis, Insights and Forecast - by Satellite Mass
- 10.1.1. 10-100kg
- 10.1.2. 100-500kg
- 10.1.3. 500-1000kg
- 10.1.4. Below 10 Kg
- 10.1.5. above 1000kg
- 10.2. Market Analysis, Insights and Forecast - by Orbit Class
- 10.2.1. GEO
- 10.2.2. LEO
- 10.2.3. MEO
- 10.3. Market Analysis, Insights and Forecast - by Satellite Subsystem
- 10.3.1. Propulsion Hardware and Propellant
- 10.3.2. Satellite Bus & Subsystems
- 10.3.3. Solar Array & Power Hardware
- 10.3.4. Structures, Harness & Mechanisms
- 10.4. Market Analysis, Insights and Forecast - by End User
- 10.4.1. Commercial
- 10.4.2. Military & Government
- 10.4.3. Other
- 10.1. Market Analysis, Insights and Forecast - by Satellite Mass
- 11. Asia Pacific Remote Sensing Technology Market Analysis, Insights and Forecast, 2020-2032
- 11.1. Market Analysis, Insights and Forecast - by Satellite Mass
- 11.1.1. 10-100kg
- 11.1.2. 100-500kg
- 11.1.3. 500-1000kg
- 11.1.4. Below 10 Kg
- 11.1.5. above 1000kg
- 11.2. Market Analysis, Insights and Forecast - by Orbit Class
- 11.2.1. GEO
- 11.2.2. LEO
- 11.2.3. MEO
- 11.3. Market Analysis, Insights and Forecast - by Satellite Subsystem
- 11.3.1. Propulsion Hardware and Propellant
- 11.3.2. Satellite Bus & Subsystems
- 11.3.3. Solar Array & Power Hardware
- 11.3.4. Structures, Harness & Mechanisms
- 11.4. Market Analysis, Insights and Forecast - by End User
- 11.4.1. Commercial
- 11.4.2. Military & Government
- 11.4.3. Other
- 11.1. Market Analysis, Insights and Forecast - by Satellite Mass
- 12. Competitive Analysis
- 12.1. Company Profiles
- 12.1.1 GomSpaceApS
- 12.1.1.1. Company Overview
- 12.1.1.2. Products
- 12.1.1.3. Company Financials
- 12.1.1.4. SWOT Analysis
- 12.1.2 ESRI
- 12.1.2.1. Company Overview
- 12.1.2.2. Products
- 12.1.2.3. Company Financials
- 12.1.2.4. SWOT Analysis
- 12.1.3 Lockheed Martin Corporation
- 12.1.3.1. Company Overview
- 12.1.3.2. Products
- 12.1.3.3. Company Financials
- 12.1.3.4. SWOT Analysis
- 12.1.4 Airbus SE
- 12.1.4.1. Company Overview
- 12.1.4.2. Products
- 12.1.4.3. Company Financials
- 12.1.4.4. SWOT Analysis
- 12.1.5 Ball Corporation
- 12.1.5.1. Company Overview
- 12.1.5.2. Products
- 12.1.5.3. Company Financials
- 12.1.5.4. SWOT Analysis
- 12.1.6 Japan Aerospace Exploration Agency (JAXA)
- 12.1.6.1. Company Overview
- 12.1.6.2. Products
- 12.1.6.3. Company Financials
- 12.1.6.4. SWOT Analysis
- 12.1.7 China Aerospace Science and Technology Corporation (CASC)
- 12.1.7.1. Company Overview
- 12.1.7.2. Products
- 12.1.7.3. Company Financials
- 12.1.7.4. SWOT Analysis
- 12.1.8 Maxar Technologies Inc
- 12.1.8.1. Company Overview
- 12.1.8.2. Products
- 12.1.8.3. Company Financials
- 12.1.8.4. SWOT Analysis
- 12.1.9 ROSCOSMOS
- 12.1.9.1. Company Overview
- 12.1.9.2. Products
- 12.1.9.3. Company Financials
- 12.1.9.4. SWOT Analysis
- 12.1.10 Thale
- 12.1.10.1. Company Overview
- 12.1.10.2. Products
- 12.1.10.3. Company Financials
- 12.1.10.4. SWOT Analysis
- 12.1.11 Planet Labs Inc
- 12.1.11.1. Company Overview
- 12.1.11.2. Products
- 12.1.11.3. Company Financials
- 12.1.11.4. SWOT Analysis
- 12.1.12 Northrop Grumman Corporation
- 12.1.12.1. Company Overview
- 12.1.12.2. Products
- 12.1.12.3. Company Financials
- 12.1.12.4. SWOT Analysis
- 12.1.13 Indian Space Research Organisation (ISRO)
- 12.1.13.1. Company Overview
- 12.1.13.2. Products
- 12.1.13.3. Company Financials
- 12.1.13.4. SWOT Analysis
- 12.1.14 IHI Corporation
- 12.1.14.1. Company Overview
- 12.1.14.2. Products
- 12.1.14.3. Company Financials
- 12.1.14.4. SWOT Analysis
- 12.1.15 Spire Global Inc
- 12.1.15.1. Company Overview
- 12.1.15.2. Products
- 12.1.15.3. Company Financials
- 12.1.15.4. SWOT Analysis
- 12.1.1 GomSpaceApS
- 12.2. Market Entropy
- 12.2.1 Company's Key Areas Served
- 12.2.2 Recent Developments
- 12.3. Company Market Share Analysis 2025
- 12.3.1 Top 5 Companies Market Share Analysis
- 12.3.2 Top 3 Companies Market Share Analysis
- 12.4. List of Potential Customers
- 13. Research Methodology
List of Figures
- Figure 1: Global Remote Sensing Technology Market Revenue Breakdown (billion, %) by Region 2025 & 2033
- Figure 2: North America Remote Sensing Technology Market Revenue (billion), by Satellite Mass 2025 & 2033
- Figure 3: North America Remote Sensing Technology Market Revenue Share (%), by Satellite Mass 2025 & 2033
- Figure 4: North America Remote Sensing Technology Market Revenue (billion), by Orbit Class 2025 & 2033
- Figure 5: North America Remote Sensing Technology Market Revenue Share (%), by Orbit Class 2025 & 2033
- Figure 6: North America Remote Sensing Technology Market Revenue (billion), by Satellite Subsystem 2025 & 2033
- Figure 7: North America Remote Sensing Technology Market Revenue Share (%), by Satellite Subsystem 2025 & 2033
- Figure 8: North America Remote Sensing Technology Market Revenue (billion), by End User 2025 & 2033
- Figure 9: North America Remote Sensing Technology Market Revenue Share (%), by End User 2025 & 2033
- Figure 10: North America Remote Sensing Technology Market Revenue (billion), by Country 2025 & 2033
- Figure 11: North America Remote Sensing Technology Market Revenue Share (%), by Country 2025 & 2033
- Figure 12: South America Remote Sensing Technology Market Revenue (billion), by Satellite Mass 2025 & 2033
- Figure 13: South America Remote Sensing Technology Market Revenue Share (%), by Satellite Mass 2025 & 2033
- Figure 14: South America Remote Sensing Technology Market Revenue (billion), by Orbit Class 2025 & 2033
- Figure 15: South America Remote Sensing Technology Market Revenue Share (%), by Orbit Class 2025 & 2033
- Figure 16: South America Remote Sensing Technology Market Revenue (billion), by Satellite Subsystem 2025 & 2033
- Figure 17: South America Remote Sensing Technology Market Revenue Share (%), by Satellite Subsystem 2025 & 2033
- Figure 18: South America Remote Sensing Technology Market Revenue (billion), by End User 2025 & 2033
- Figure 19: South America Remote Sensing Technology Market Revenue Share (%), by End User 2025 & 2033
- Figure 20: South America Remote Sensing Technology Market Revenue (billion), by Country 2025 & 2033
- Figure 21: South America Remote Sensing Technology Market Revenue Share (%), by Country 2025 & 2033
- Figure 22: Europe Remote Sensing Technology Market Revenue (billion), by Satellite Mass 2025 & 2033
- Figure 23: Europe Remote Sensing Technology Market Revenue Share (%), by Satellite Mass 2025 & 2033
- Figure 24: Europe Remote Sensing Technology Market Revenue (billion), by Orbit Class 2025 & 2033
- Figure 25: Europe Remote Sensing Technology Market Revenue Share (%), by Orbit Class 2025 & 2033
- Figure 26: Europe Remote Sensing Technology Market Revenue (billion), by Satellite Subsystem 2025 & 2033
- Figure 27: Europe Remote Sensing Technology Market Revenue Share (%), by Satellite Subsystem 2025 & 2033
- Figure 28: Europe Remote Sensing Technology Market Revenue (billion), by End User 2025 & 2033
- Figure 29: Europe Remote Sensing Technology Market Revenue Share (%), by End User 2025 & 2033
- Figure 30: Europe Remote Sensing Technology Market Revenue (billion), by Country 2025 & 2033
- Figure 31: Europe Remote Sensing Technology Market Revenue Share (%), by Country 2025 & 2033
- Figure 32: Middle East & Africa Remote Sensing Technology Market Revenue (billion), by Satellite Mass 2025 & 2033
- Figure 33: Middle East & Africa Remote Sensing Technology Market Revenue Share (%), by Satellite Mass 2025 & 2033
- Figure 34: Middle East & Africa Remote Sensing Technology Market Revenue (billion), by Orbit Class 2025 & 2033
- Figure 35: Middle East & Africa Remote Sensing Technology Market Revenue Share (%), by Orbit Class 2025 & 2033
- Figure 36: Middle East & Africa Remote Sensing Technology Market Revenue (billion), by Satellite Subsystem 2025 & 2033
- Figure 37: Middle East & Africa Remote Sensing Technology Market Revenue Share (%), by Satellite Subsystem 2025 & 2033
- Figure 38: Middle East & Africa Remote Sensing Technology Market Revenue (billion), by End User 2025 & 2033
- Figure 39: Middle East & Africa Remote Sensing Technology Market Revenue Share (%), by End User 2025 & 2033
- Figure 40: Middle East & Africa Remote Sensing Technology Market Revenue (billion), by Country 2025 & 2033
- Figure 41: Middle East & Africa Remote Sensing Technology Market Revenue Share (%), by Country 2025 & 2033
- Figure 42: Asia Pacific Remote Sensing Technology Market Revenue (billion), by Satellite Mass 2025 & 2033
- Figure 43: Asia Pacific Remote Sensing Technology Market Revenue Share (%), by Satellite Mass 2025 & 2033
- Figure 44: Asia Pacific Remote Sensing Technology Market Revenue (billion), by Orbit Class 2025 & 2033
- Figure 45: Asia Pacific Remote Sensing Technology Market Revenue Share (%), by Orbit Class 2025 & 2033
- Figure 46: Asia Pacific Remote Sensing Technology Market Revenue (billion), by Satellite Subsystem 2025 & 2033
- Figure 47: Asia Pacific Remote Sensing Technology Market Revenue Share (%), by Satellite Subsystem 2025 & 2033
- Figure 48: Asia Pacific Remote Sensing Technology Market Revenue (billion), by End User 2025 & 2033
- Figure 49: Asia Pacific Remote Sensing Technology Market Revenue Share (%), by End User 2025 & 2033
- Figure 50: Asia Pacific Remote Sensing Technology Market Revenue (billion), by Country 2025 & 2033
- Figure 51: Asia Pacific Remote Sensing Technology Market Revenue Share (%), by Country 2025 & 2033
List of Tables
- Table 1: Global Remote Sensing Technology Market Revenue billion Forecast, by Satellite Mass 2020 & 2033
- Table 2: Global Remote Sensing Technology Market Revenue billion Forecast, by Orbit Class 2020 & 2033
- Table 3: Global Remote Sensing Technology Market Revenue billion Forecast, by Satellite Subsystem 2020 & 2033
- Table 4: Global Remote Sensing Technology Market Revenue billion Forecast, by End User 2020 & 2033
- Table 5: Global Remote Sensing Technology Market Revenue billion Forecast, by Region 2020 & 2033
- Table 6: Global Remote Sensing Technology Market Revenue billion Forecast, by Satellite Mass 2020 & 2033
- Table 7: Global Remote Sensing Technology Market Revenue billion Forecast, by Orbit Class 2020 & 2033
- Table 8: Global Remote Sensing Technology Market Revenue billion Forecast, by Satellite Subsystem 2020 & 2033
- Table 9: Global Remote Sensing Technology Market Revenue billion Forecast, by End User 2020 & 2033
- Table 10: Global Remote Sensing Technology Market Revenue billion Forecast, by Country 2020 & 2033
- Table 11: United States Remote Sensing Technology Market Revenue (billion) Forecast, by Application 2020 & 2033
- Table 12: Canada Remote Sensing Technology Market Revenue (billion) Forecast, by Application 2020 & 2033
- Table 13: Mexico Remote Sensing Technology Market Revenue (billion) Forecast, by Application 2020 & 2033
- Table 14: Global Remote Sensing Technology Market Revenue billion Forecast, by Satellite Mass 2020 & 2033
- Table 15: Global Remote Sensing Technology Market Revenue billion Forecast, by Orbit Class 2020 & 2033
- Table 16: Global Remote Sensing Technology Market Revenue billion Forecast, by Satellite Subsystem 2020 & 2033
- Table 17: Global Remote Sensing Technology Market Revenue billion Forecast, by End User 2020 & 2033
- Table 18: Global Remote Sensing Technology Market Revenue billion Forecast, by Country 2020 & 2033
- Table 19: Brazil Remote Sensing Technology Market Revenue (billion) Forecast, by Application 2020 & 2033
- Table 20: Argentina Remote Sensing Technology Market Revenue (billion) Forecast, by Application 2020 & 2033
- Table 21: Rest of South America Remote Sensing Technology Market Revenue (billion) Forecast, by Application 2020 & 2033
- Table 22: Global Remote Sensing Technology Market Revenue billion Forecast, by Satellite Mass 2020 & 2033
- Table 23: Global Remote Sensing Technology Market Revenue billion Forecast, by Orbit Class 2020 & 2033
- Table 24: Global Remote Sensing Technology Market Revenue billion Forecast, by Satellite Subsystem 2020 & 2033
- Table 25: Global Remote Sensing Technology Market Revenue billion Forecast, by End User 2020 & 2033
- Table 26: Global Remote Sensing Technology Market Revenue billion Forecast, by Country 2020 & 2033
- Table 27: United Kingdom Remote Sensing Technology Market Revenue (billion) Forecast, by Application 2020 & 2033
- Table 28: Germany Remote Sensing Technology Market Revenue (billion) Forecast, by Application 2020 & 2033
- Table 29: France Remote Sensing Technology Market Revenue (billion) Forecast, by Application 2020 & 2033
- Table 30: Italy Remote Sensing Technology Market Revenue (billion) Forecast, by Application 2020 & 2033
- Table 31: Spain Remote Sensing Technology Market Revenue (billion) Forecast, by Application 2020 & 2033
- Table 32: Russia Remote Sensing Technology Market Revenue (billion) Forecast, by Application 2020 & 2033
- Table 33: Benelux Remote Sensing Technology Market Revenue (billion) Forecast, by Application 2020 & 2033
- Table 34: Nordics Remote Sensing Technology Market Revenue (billion) Forecast, by Application 2020 & 2033
- Table 35: Rest of Europe Remote Sensing Technology Market Revenue (billion) Forecast, by Application 2020 & 2033
- Table 36: Global Remote Sensing Technology Market Revenue billion Forecast, by Satellite Mass 2020 & 2033
- Table 37: Global Remote Sensing Technology Market Revenue billion Forecast, by Orbit Class 2020 & 2033
- Table 38: Global Remote Sensing Technology Market Revenue billion Forecast, by Satellite Subsystem 2020 & 2033
- Table 39: Global Remote Sensing Technology Market Revenue billion Forecast, by End User 2020 & 2033
- Table 40: Global Remote Sensing Technology Market Revenue billion Forecast, by Country 2020 & 2033
- Table 41: Turkey Remote Sensing Technology Market Revenue (billion) Forecast, by Application 2020 & 2033
- Table 42: Israel Remote Sensing Technology Market Revenue (billion) Forecast, by Application 2020 & 2033
- Table 43: GCC Remote Sensing Technology Market Revenue (billion) Forecast, by Application 2020 & 2033
- Table 44: North Africa Remote Sensing Technology Market Revenue (billion) Forecast, by Application 2020 & 2033
- Table 45: South Africa Remote Sensing Technology Market Revenue (billion) Forecast, by Application 2020 & 2033
- Table 46: Rest of Middle East & Africa Remote Sensing Technology Market Revenue (billion) Forecast, by Application 2020 & 2033
- Table 47: Global Remote Sensing Technology Market Revenue billion Forecast, by Satellite Mass 2020 & 2033
- Table 48: Global Remote Sensing Technology Market Revenue billion Forecast, by Orbit Class 2020 & 2033
- Table 49: Global Remote Sensing Technology Market Revenue billion Forecast, by Satellite Subsystem 2020 & 2033
- Table 50: Global Remote Sensing Technology Market Revenue billion Forecast, by End User 2020 & 2033
- Table 51: Global Remote Sensing Technology Market Revenue billion Forecast, by Country 2020 & 2033
- Table 52: China Remote Sensing Technology Market Revenue (billion) Forecast, by Application 2020 & 2033
- Table 53: India Remote Sensing Technology Market Revenue (billion) Forecast, by Application 2020 & 2033
- Table 54: Japan Remote Sensing Technology Market Revenue (billion) Forecast, by Application 2020 & 2033
- Table 55: South Korea Remote Sensing Technology Market Revenue (billion) Forecast, by Application 2020 & 2033
- Table 56: ASEAN Remote Sensing Technology Market Revenue (billion) Forecast, by Application 2020 & 2033
- Table 57: Oceania Remote Sensing Technology Market Revenue (billion) Forecast, by Application 2020 & 2033
- Table 58: Rest of Asia Pacific Remote Sensing Technology Market Revenue (billion) Forecast, by Application 2020 & 2033
Frequently Asked Questions
1. What is the projected Compound Annual Growth Rate (CAGR) of the Remote Sensing Technology Market?
The projected CAGR is approximately 11.59%.
2. Which companies are prominent players in the Remote Sensing Technology Market?
Key companies in the market include GomSpaceApS, ESRI, Lockheed Martin Corporation, Airbus SE, Ball Corporation, Japan Aerospace Exploration Agency (JAXA), China Aerospace Science and Technology Corporation (CASC), Maxar Technologies Inc, ROSCOSMOS, Thale, Planet Labs Inc, Northrop Grumman Corporation, Indian Space Research Organisation (ISRO), IHI Corporation, Spire Global Inc.
3. What are the main segments of the Remote Sensing Technology Market?
The market segments include Satellite Mass, Orbit Class, Satellite Subsystem, End User.
4. Can you provide details about the market size?
The market size is estimated to be USD 25.37 billion as of 2022.
5. What are some drivers contributing to market growth?
N/A
6. What are the notable trends driving market growth?
OTHER KEY INDUSTRY TRENDS COVERED IN THE REPORT.
7. Are there any restraints impacting market growth?
N/A
8. Can you provide examples of recent developments in the market?
March 2023: The Japan Aerospace Exploration Agency (JAXA) had scheduled the launch of the first H3 Launch Vehicle with the Advanced Land Observing Satellite "Daichi 3" (ALOS-3) onboard from the Tanegashima Space Center.February 2023: NASA and geographic information service provider Esri will grant wider access to the space agency's geospatial content for research and exploration purposes through the Space Act Agreement.January 2023: Airbus Defence and Space has signed a contract with Poland to provide a geospatial intelligence system including the development, manufacture, launch and delivery in orbit of two high-performance optical Earth observation satellites.
9. What pricing options are available for accessing the report?
Pricing options include single-user, multi-user, and enterprise licenses priced at USD 3800, USD 4500, and USD 5800 respectively.
10. Is the market size provided in terms of value or volume?
The market size is provided in terms of value, measured in billion.
11. Are there any specific market keywords associated with the report?
Yes, the market keyword associated with the report is "Remote Sensing Technology Market," which aids in identifying and referencing the specific market segment covered.
12. How do I determine which pricing option suits my needs best?
The pricing options vary based on user requirements and access needs. Individual users may opt for single-user licenses, while businesses requiring broader access may choose multi-user or enterprise licenses for cost-effective access to the report.
13. Are there any additional resources or data provided in the Remote Sensing Technology Market report?
While the report offers comprehensive insights, it's advisable to review the specific contents or supplementary materials provided to ascertain if additional resources or data are available.
14. How can I stay updated on further developments or reports in the Remote Sensing Technology Market?
To stay informed about further developments, trends, and reports in the Remote Sensing Technology Market, consider subscribing to industry newsletters, following relevant companies and organizations, or regularly checking reputable industry news sources and publications.
Methodology
Step 1 - Identification of Relevant Samples Size from Population Database


Step 2 - Approaches for Defining Global Market Size (Value, Volume* & Price*)

Note*: In applicable scenarios
Step 3 - Data Sources
Primary Research
- Web Analytics
- Survey Reports
- Research Institute
- Latest Research Reports
- Opinion Leaders
Secondary Research
- Annual Reports
- White Paper
- Latest Press Release
- Industry Association
- Paid Database
- Investor Presentations

Step 4 - Data Triangulation
Involves using different sources of information in order to increase the validity of a study
These sources are likely to be stakeholders in a program - participants, other researchers, program staff, other community members, and so on.
Then we put all data in single framework & apply various statistical tools to find out the dynamic on the market.
During the analysis stage, feedback from the stakeholder groups would be compared to determine areas of agreement as well as areas of divergence