

Key Insights
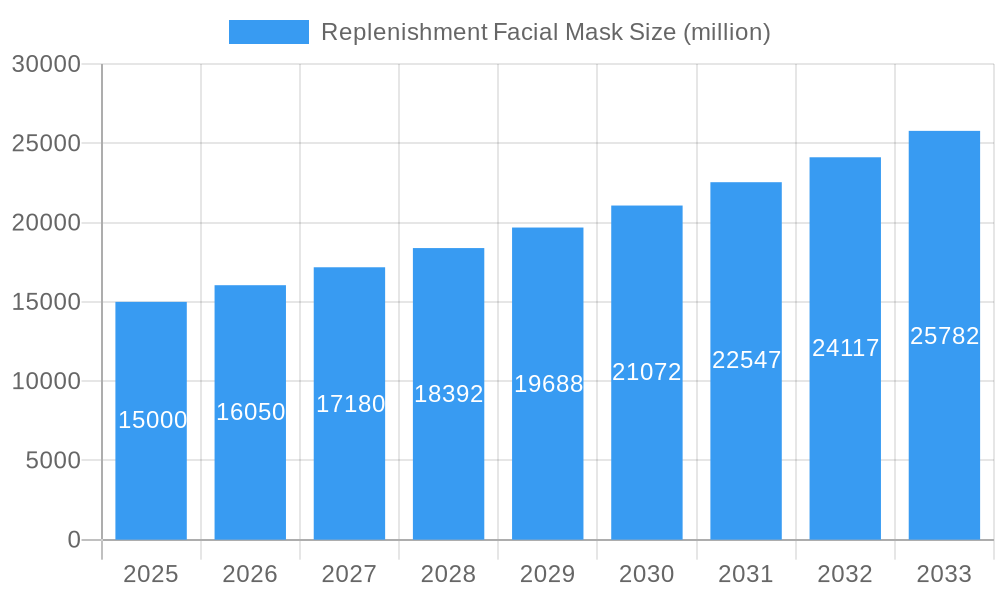
The global replenishment facial mask market is experiencing robust growth, driven by increasing consumer awareness of skincare benefits and the rising popularity of at-home beauty treatments. The market, estimated at $15 billion in 2025, is projected to witness a Compound Annual Growth Rate (CAGR) of 7% from 2025 to 2033, reaching approximately $25 billion by the end of the forecast period. This growth is fueled by several key factors. The diversification of mask types, encompassing non-woven, silk, bio-cellulose, and paper masks, caters to diverse consumer preferences and budgets. Furthermore, targeted formulations for different skin types (oily, normal, dry, combination) enhance market penetration. The Asia-Pacific region, particularly China, South Korea, and Japan, dominates the market, owing to established skincare routines and high disposable incomes. However, increasing competition among numerous established and emerging brands requires continuous innovation in product formulations and marketing strategies. North America and Europe are also significant markets, showing strong growth potential, driven by the increasing adoption of K-beauty trends and a focus on self-care.
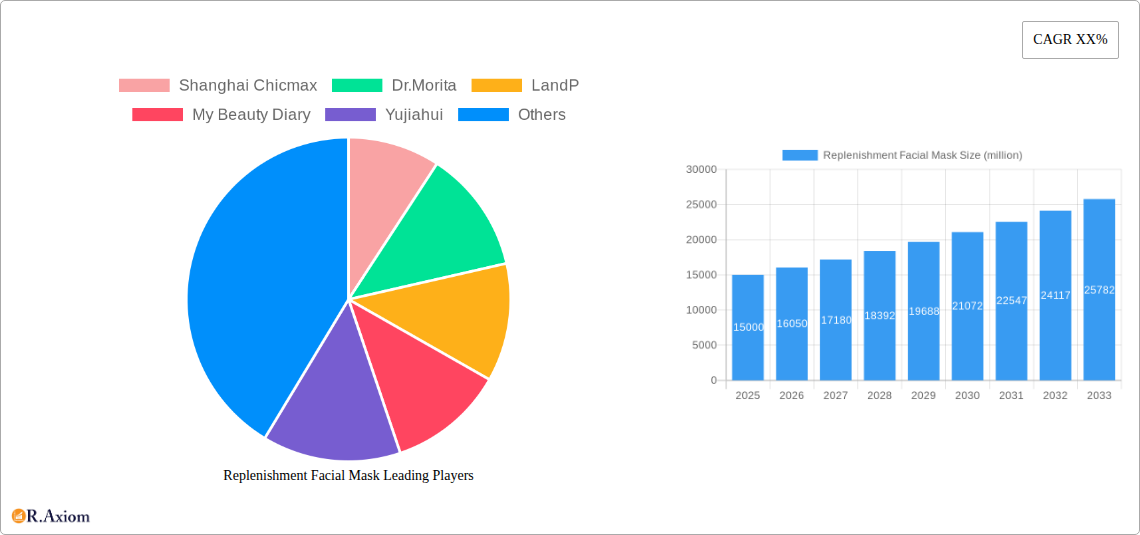
Replenishment Facial Mask Market Size (In Billion)
Market restraints include the potential for skin irritation from certain mask ingredients and concerns regarding sustainability and environmental impact of single-use masks. The rising popularity of sheet masks has also created intense competition, necessitating brands to differentiate themselves through innovative features, unique formulations, and compelling marketing approaches. The increasing adoption of reusable and eco-friendly alternatives, such as washable cotton masks, is a notable trend that presents both a challenge and an opportunity for the market. Companies must strategically adapt their offerings to meet the evolving consumer demand for sustainable and effective replenishment facial masks. The segment of bio-cellulose masks is projected to show the highest growth rate due to its superior efficacy and premium positioning. Successful companies will need to balance cost-effectiveness with innovation to retain their market share in this competitive landscape.
Replenishment Facial Mask Company Market Share
Replenishment Facial Mask Market Report: 2019-2033
This comprehensive report provides a detailed analysis of the global replenishment facial mask market from 2019 to 2033, offering invaluable insights for industry stakeholders, investors, and market entrants. The report covers market size, segmentation, growth drivers, challenges, and competitive landscape, with a focus on key players and emerging trends. The study period covers 2019-2033, with 2025 as the base and estimated year, and the forecast period spanning 2025-2033. The historical period analyzed is 2019-2024. Total market value predictions are in millions.
Replenishment Facial Mask Market Concentration & Innovation
The global replenishment facial mask market exhibits a moderately concentrated landscape, with a few major players holding significant market share. In 2025, the top five companies—estimated to be Estée Lauder, Shiseido, L'Oréal, SK-II, and Proya—are projected to collectively hold approximately xx% of the market. Smaller players, including Shanghai Chicmax, Dr. Morita, LandP, My Beauty Diary, Yujiahui, Costory, Shanghai Yuemu, Herborist, Pechoin, THE FACE SHOP, Choiskycn, Kose, Avon, Inoherb, Olay, Yalget, and Cel-derma, contribute to the remaining market share, fostering competition and innovation.
- Market Share: Estée Lauder (xx%), Shiseido (xx%), L'Oréal (xx%), SK-II (xx%), Proya (xx%), Others (xx%).
- M&A Activity: The market has witnessed xx million worth of mergers and acquisitions (M&A) deals in the historical period (2019-2024), primarily driven by strategic expansions and the acquisition of smaller brands with niche product lines. The forecast period is expected to see a further increase in M&A activity, potentially reaching xx million.
- Innovation Drivers: Growing consumer demand for natural and organic ingredients, advancements in mask material technology (bio-cellulose, silk), and personalized skincare solutions are key drivers of innovation.
- Regulatory Frameworks: Stringent regulations regarding ingredient safety and labeling are influencing product formulations and marketing claims.
- Product Substitutes: Other skincare products like serums and creams offer some level of substitution, but the convenience and targeted application of facial masks maintain strong market demand.
- End-user Trends: Increasing awareness of skincare benefits and rising disposable incomes, particularly in Asia, are fueling market growth.
Replenishment Facial Mask Industry Trends & Insights
The global replenishment facial mask market is experiencing significant growth, driven by several key factors. The market is projected to achieve a Compound Annual Growth Rate (CAGR) of xx% during the forecast period (2025-2033), expanding from an estimated value of xx million in 2025 to xx million by 2033. This growth is primarily attributed to the rising popularity of sheet masks as a convenient and effective skincare solution, particularly among millennials and Gen Z. Technological advancements, such as the development of bio-cellulose masks and the incorporation of advanced ingredients, are further propelling market expansion. Changing consumer preferences towards natural and organic ingredients, along with increased demand for personalized skincare, are creating new opportunities for innovation. However, intense competition among established brands and the emergence of new players create a dynamic and competitive landscape. Market penetration is expected to increase significantly, with a growing number of consumers adopting replenishment facial masks as part of their regular skincare routines. The market is also witnessing a shift towards online sales channels and the growing adoption of e-commerce platforms which significantly aids market penetration.
Dominant Markets & Segments in Replenishment Facial Mask
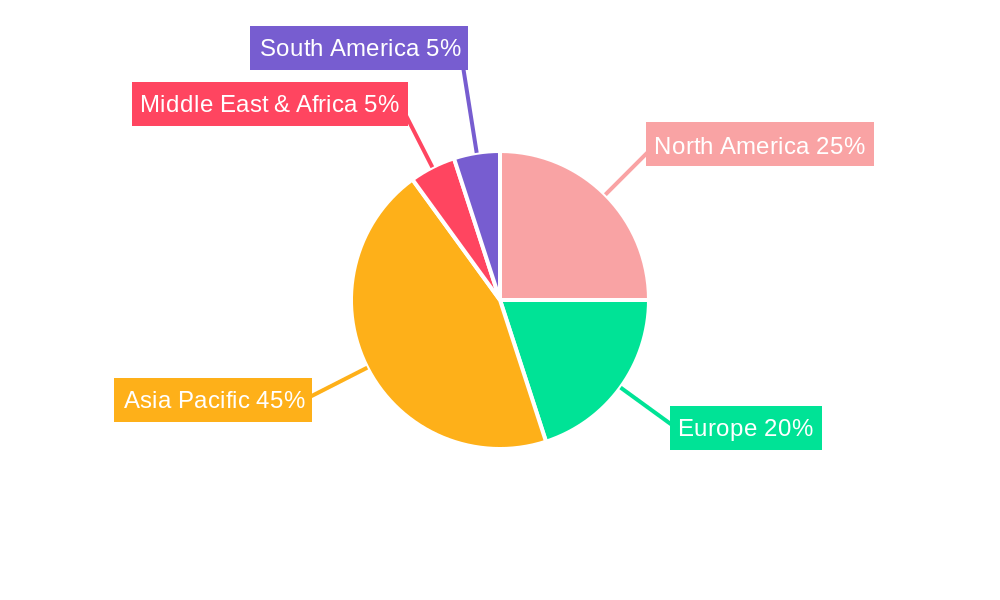
The Asia-Pacific region, particularly China, Japan, and South Korea, dominates the global replenishment facial mask market due to strong consumer demand and a robust manufacturing base. The high concentration of beauty conscious consumers with disposable income leads to high market demand in the region.
- Leading Region: Asia-Pacific (estimated xx% market share in 2025)
- Dominant Segment (Application): Combination skin segment accounts for significant market share given its widespread applicability to various demographics. Oil and normal skin types also show substantial demand.
- Dominant Segment (Type): Non-woven masks hold the largest market share due to affordability and wide availability. However, the bio-cellulose segment shows significant growth potential due to its superior efficacy and premium positioning.
Key Drivers for APAC Dominance:
- Strong consumer base: High disposable income and significant awareness of skincare products are major market drivers.
- Established manufacturing infrastructure: A large number of established facial mask manufacturers are present, significantly reducing production costs.
- Favorable economic policies: Government support to beauty related industries increases economic development.
- Advanced distribution network: Robust retail and e-commerce channels facilitate market access.
Replenishment Facial Mask Product Developments
Recent product innovations focus on incorporating advanced ingredients like hyaluronic acid, vitamin C, and various extracts to cater to specific skin concerns. Bio-cellulose masks are gaining popularity due to their superior fit and ability to deliver high concentrations of active ingredients. The market is also witnessing the launch of customized mask solutions tailored to individual skin types and needs, reflecting the increasing demand for personalized skincare.
Report Scope & Segmentation Analysis
This report segments the replenishment facial mask market based on application (Oil Skin, Normal Skin, Dry Skin, Combination Skin) and type (Non-Woven Mask, Silk Mask, Bio-Cellulose Mask, Paper Mask, Others). Each segment exhibits unique growth trajectories and competitive dynamics. The Non-woven mask segment dominates currently, but the bio-cellulose segment is projected to demonstrate the fastest growth in the forecast period. The combination skin application segment holds the largest market share owing to its widespread appeal. Growth projections are presented for each segment with detailed market size analysis and competitive landscapes.
Key Drivers of Replenishment Facial Mask Growth
Several factors fuel the market's growth. Rising consumer awareness of skincare benefits, coupled with growing disposable incomes, especially in emerging economies, drives demand. The convenience and efficacy of facial masks, coupled with the innovation of new materials and ingredients (such as bio-cellulose and customized formulations), contribute significantly. Furthermore, the expansion of e-commerce channels offers readily available access to consumers, and increased marketing expenditure by established players enhances brand awareness, facilitating market growth.
Challenges in the Replenishment Facial Mask Sector
The industry faces challenges like fluctuating raw material prices impacting profitability and the need for continuous innovation to stay ahead in a highly competitive market. Maintaining consistent product quality and ensuring ethical sourcing of raw materials are also significant concerns. The increasing number of regulations around ingredient safety and labeling also puts pressure on manufacturers. Competition from substitutes like serums and creams presents another challenge. The estimated negative impact of these challenges on market growth is approximately xx million in lost revenue during the forecast period.
Emerging Opportunities in Replenishment Facial Mask
Emerging opportunities lie in the development of sustainable and eco-friendly masks using biodegradable materials. The rising demand for personalized skincare solutions creates avenues for customized masks tailored to individual skin types and needs. The increasing penetration of e-commerce, direct-to-consumer channels, and personalization of the customer journey create new opportunities. Finally, exploring new markets in developing countries and regions presents further expansion possibilities.
Leading Players in the Replenishment Facial Mask Market
- Shanghai Chicmax
- Dr.Morita
- LandP
- My Beauty Diary
- Yujiahui
- Costory
- Shanghai Yuemu
- Herborist
- Pechoin
- THE FACE SHOP
- Estée Lauder
- SK-II
- Choiskycn
- Kose
- Avon
- L'Oréal
- Inoherb
- Olay
- Shiseido
- Yalget
- Cel-derma
- PROYA
Key Developments in Replenishment Facial Mask Industry
- 2020 Q4: L'Oréal launches a new line of sustainable bio-cellulose masks.
- 2021 Q2: Estée Lauder acquires a smaller skincare brand specializing in personalized mask solutions.
- 2022 Q3: Shiseido introduces a new range of masks incorporating advanced anti-aging ingredients.
- 2023 Q1: Significant increase in online sales for replenishment facial masks. (Data reflects increasing market trend)
- 2024 Q4: A new regulation on ingredient safety affects several major mask brands.
Strategic Outlook for Replenishment Facial Mask Market
The replenishment facial mask market presents significant growth potential, driven by several factors. Continued innovation in mask materials and formulations, coupled with rising consumer demand for personalized skincare and the expanding e-commerce landscape, are key growth catalysts. Strategic partnerships, mergers and acquisitions, and the expansion into new markets will further shape the industry's future. The market is projected to maintain strong growth throughout the forecast period, offering ample opportunities for both established players and new entrants.
Replenishment Facial Mask Segmentation
-
1. Application
- 1.1. Oil Skin
- 1.2. Normal Skin
- 1.3. Dry Skin
- 1.4. Combination Skin
-
2. Types
- 2.1. Non-Woven Mask
- 2.2. Silk Mask
- 2.3. Bio-Cellulose Mask
- 2.4. Paper Mask
- 2.5. Others
Replenishment Facial Mask Segmentation By Geography
-
1. North America
- 1.1. United States
- 1.2. Canada
- 1.3. Mexico
-
2. South America
- 2.1. Brazil
- 2.2. Argentina
- 2.3. Rest of South America
-
3. Europe
- 3.1. United Kingdom
- 3.2. Germany
- 3.3. France
- 3.4. Italy
- 3.5. Spain
- 3.6. Russia
- 3.7. Benelux
- 3.8. Nordics
- 3.9. Rest of Europe
-
4. Middle East & Africa
- 4.1. Turkey
- 4.2. Israel
- 4.3. GCC
- 4.4. North Africa
- 4.5. South Africa
- 4.6. Rest of Middle East & Africa
-
5. Asia Pacific
- 5.1. China
- 5.2. India
- 5.3. Japan
- 5.4. South Korea
- 5.5. ASEAN
- 5.6. Oceania
- 5.7. Rest of Asia Pacific
Replenishment Facial Mask Regional Market Share
Geographic Coverage of Replenishment Facial Mask
Replenishment Facial Mask REPORT HIGHLIGHTS
| Aspects | Details |
|---|---|
| Study Period | 2020-2034 |
| Base Year | 2025 |
| Estimated Year | 2026 |
| Forecast Period | 2026-2034 |
| Historical Period | 2020-2025 |
| Growth Rate | CAGR of 12.59% from 2020-2034 |
| Segmentation |
|
Table of Contents
- 1. Introduction
- 1.1. Research Scope
- 1.2. Market Segmentation
- 1.3. Research Objective
- 1.4. Definitions and Assumptions
- 2. Executive Summary
- 2.1. Market Snapshot
- 3. Market Dynamics
- 3.1. Market Drivers
- 3.2. Market Restrains
- 3.3. Market Trends
- 3.4. Market Opportunities
- 4. Market Factor Analysis
- 4.1. Porters Five Forces
- 4.1.1. Bargaining Power of Suppliers
- 4.1.2. Bargaining Power of Buyers
- 4.1.3. Threat of New Entrants
- 4.1.4. Threat of Substitutes
- 4.1.5. Competitive Rivalry
- 4.2. PESTEL analysis
- 4.3. BCG Analysis
- 4.3.1. Stars (High Growth, High Market Share)
- 4.3.2. Cash Cows (Low Growth, High Market Share)
- 4.3.3. Question Mark (High Growth, Low Market Share)
- 4.3.4. Dogs (Low Growth, Low Market Share)
- 4.4. Ansoff Matrix Analysis
- 4.5. Supply Chain Analysis
- 4.6. Regulatory Landscape
- 4.7. Current Market Potential and Opportunity Assessment (TAM–SAM–SOM Framework)
- 4.8. RAX Analyst Note
- 4.1. Porters Five Forces
- 5. Market Analysis, Insights and Forecast 2021-2033
- 5.1. Market Analysis, Insights and Forecast - by Application
- 5.1.1. Oil Skin
- 5.1.2. Normal Skin
- 5.1.3. Dry Skin
- 5.1.4. Combination Skin
- 5.2. Market Analysis, Insights and Forecast - by Types
- 5.2.1. Non-Woven Mask
- 5.2.2. Silk Mask
- 5.2.3. Bio-Cellulose Mask
- 5.2.4. Paper Mask
- 5.2.5. Others
- 5.3. Market Analysis, Insights and Forecast - by Region
- 5.3.1. North America
- 5.3.2. South America
- 5.3.3. Europe
- 5.3.4. Middle East & Africa
- 5.3.5. Asia Pacific
- 5.1. Market Analysis, Insights and Forecast - by Application
- 6. Global Replenishment Facial Mask Analysis, Insights and Forecast, 2021-2033
- 6.1. Market Analysis, Insights and Forecast - by Application
- 6.1.1. Oil Skin
- 6.1.2. Normal Skin
- 6.1.3. Dry Skin
- 6.1.4. Combination Skin
- 6.2. Market Analysis, Insights and Forecast - by Types
- 6.2.1. Non-Woven Mask
- 6.2.2. Silk Mask
- 6.2.3. Bio-Cellulose Mask
- 6.2.4. Paper Mask
- 6.2.5. Others
- 6.1. Market Analysis, Insights and Forecast - by Application
- 7. North America Replenishment Facial Mask Analysis, Insights and Forecast, 2020-2032
- 7.1. Market Analysis, Insights and Forecast - by Application
- 7.1.1. Oil Skin
- 7.1.2. Normal Skin
- 7.1.3. Dry Skin
- 7.1.4. Combination Skin
- 7.2. Market Analysis, Insights and Forecast - by Types
- 7.2.1. Non-Woven Mask
- 7.2.2. Silk Mask
- 7.2.3. Bio-Cellulose Mask
- 7.2.4. Paper Mask
- 7.2.5. Others
- 7.1. Market Analysis, Insights and Forecast - by Application
- 8. South America Replenishment Facial Mask Analysis, Insights and Forecast, 2020-2032
- 8.1. Market Analysis, Insights and Forecast - by Application
- 8.1.1. Oil Skin
- 8.1.2. Normal Skin
- 8.1.3. Dry Skin
- 8.1.4. Combination Skin
- 8.2. Market Analysis, Insights and Forecast - by Types
- 8.2.1. Non-Woven Mask
- 8.2.2. Silk Mask
- 8.2.3. Bio-Cellulose Mask
- 8.2.4. Paper Mask
- 8.2.5. Others
- 8.1. Market Analysis, Insights and Forecast - by Application
- 9. Europe Replenishment Facial Mask Analysis, Insights and Forecast, 2020-2032
- 9.1. Market Analysis, Insights and Forecast - by Application
- 9.1.1. Oil Skin
- 9.1.2. Normal Skin
- 9.1.3. Dry Skin
- 9.1.4. Combination Skin
- 9.2. Market Analysis, Insights and Forecast - by Types
- 9.2.1. Non-Woven Mask
- 9.2.2. Silk Mask
- 9.2.3. Bio-Cellulose Mask
- 9.2.4. Paper Mask
- 9.2.5. Others
- 9.1. Market Analysis, Insights and Forecast - by Application
- 10. Middle East & Africa Replenishment Facial Mask Analysis, Insights and Forecast, 2020-2032
- 10.1. Market Analysis, Insights and Forecast - by Application
- 10.1.1. Oil Skin
- 10.1.2. Normal Skin
- 10.1.3. Dry Skin
- 10.1.4. Combination Skin
- 10.2. Market Analysis, Insights and Forecast - by Types
- 10.2.1. Non-Woven Mask
- 10.2.2. Silk Mask
- 10.2.3. Bio-Cellulose Mask
- 10.2.4. Paper Mask
- 10.2.5. Others
- 10.1. Market Analysis, Insights and Forecast - by Application
- 11. Asia Pacific Replenishment Facial Mask Analysis, Insights and Forecast, 2020-2032
- 11.1. Market Analysis, Insights and Forecast - by Application
- 11.1.1. Oil Skin
- 11.1.2. Normal Skin
- 11.1.3. Dry Skin
- 11.1.4. Combination Skin
- 11.2. Market Analysis, Insights and Forecast - by Types
- 11.2.1. Non-Woven Mask
- 11.2.2. Silk Mask
- 11.2.3. Bio-Cellulose Mask
- 11.2.4. Paper Mask
- 11.2.5. Others
- 11.1. Market Analysis, Insights and Forecast - by Application
- 12. Competitive Analysis
- 12.1. Company Profiles
- 12.1.1 Shanghai Chicmax
- 12.1.1.1. Company Overview
- 12.1.1.2. Products
- 12.1.1.3. Company Financials
- 12.1.1.4. SWOT Analysis
- 12.1.2 Dr.Morita
- 12.1.2.1. Company Overview
- 12.1.2.2. Products
- 12.1.2.3. Company Financials
- 12.1.2.4. SWOT Analysis
- 12.1.3 LandP
- 12.1.3.1. Company Overview
- 12.1.3.2. Products
- 12.1.3.3. Company Financials
- 12.1.3.4. SWOT Analysis
- 12.1.4 My Beauty Diary
- 12.1.4.1. Company Overview
- 12.1.4.2. Products
- 12.1.4.3. Company Financials
- 12.1.4.4. SWOT Analysis
- 12.1.5 Yujiahui
- 12.1.5.1. Company Overview
- 12.1.5.2. Products
- 12.1.5.3. Company Financials
- 12.1.5.4. SWOT Analysis
- 12.1.6 Costory
- 12.1.6.1. Company Overview
- 12.1.6.2. Products
- 12.1.6.3. Company Financials
- 12.1.6.4. SWOT Analysis
- 12.1.7 Shanghai Yuemu
- 12.1.7.1. Company Overview
- 12.1.7.2. Products
- 12.1.7.3. Company Financials
- 12.1.7.4. SWOT Analysis
- 12.1.8 Herborist
- 12.1.8.1. Company Overview
- 12.1.8.2. Products
- 12.1.8.3. Company Financials
- 12.1.8.4. SWOT Analysis
- 12.1.9 Pechoin
- 12.1.9.1. Company Overview
- 12.1.9.2. Products
- 12.1.9.3. Company Financials
- 12.1.9.4. SWOT Analysis
- 12.1.10 THE FACE SHOP
- 12.1.10.1. Company Overview
- 12.1.10.2. Products
- 12.1.10.3. Company Financials
- 12.1.10.4. SWOT Analysis
- 12.1.11 Estee Lauder
- 12.1.11.1. Company Overview
- 12.1.11.2. Products
- 12.1.11.3. Company Financials
- 12.1.11.4. SWOT Analysis
- 12.1.12 SK-II
- 12.1.12.1. Company Overview
- 12.1.12.2. Products
- 12.1.12.3. Company Financials
- 12.1.12.4. SWOT Analysis
- 12.1.13 Choiskycn
- 12.1.13.1. Company Overview
- 12.1.13.2. Products
- 12.1.13.3. Company Financials
- 12.1.13.4. SWOT Analysis
- 12.1.14 Kose
- 12.1.14.1. Company Overview
- 12.1.14.2. Products
- 12.1.14.3. Company Financials
- 12.1.14.4. SWOT Analysis
- 12.1.15 Avon
- 12.1.15.1. Company Overview
- 12.1.15.2. Products
- 12.1.15.3. Company Financials
- 12.1.15.4. SWOT Analysis
- 12.1.16 Loreal
- 12.1.16.1. Company Overview
- 12.1.16.2. Products
- 12.1.16.3. Company Financials
- 12.1.16.4. SWOT Analysis
- 12.1.17 Inoherb
- 12.1.17.1. Company Overview
- 12.1.17.2. Products
- 12.1.17.3. Company Financials
- 12.1.17.4. SWOT Analysis
- 12.1.18 Olay
- 12.1.18.1. Company Overview
- 12.1.18.2. Products
- 12.1.18.3. Company Financials
- 12.1.18.4. SWOT Analysis
- 12.1.19 Shiseido
- 12.1.19.1. Company Overview
- 12.1.19.2. Products
- 12.1.19.3. Company Financials
- 12.1.19.4. SWOT Analysis
- 12.1.20 Yalget
- 12.1.20.1. Company Overview
- 12.1.20.2. Products
- 12.1.20.3. Company Financials
- 12.1.20.4. SWOT Analysis
- 12.1.21 Cel-derma
- 12.1.21.1. Company Overview
- 12.1.21.2. Products
- 12.1.21.3. Company Financials
- 12.1.21.4. SWOT Analysis
- 12.1.22 PROYA
- 12.1.22.1. Company Overview
- 12.1.22.2. Products
- 12.1.22.3. Company Financials
- 12.1.22.4. SWOT Analysis
- 12.1.1 Shanghai Chicmax
- 12.2. Market Entropy
- 12.2.1 Company's Key Areas Served
- 12.2.2 Recent Developments
- 12.3. Company Market Share Analysis 2025
- 12.3.1 Top 5 Companies Market Share Analysis
- 12.3.2 Top 3 Companies Market Share Analysis
- 12.4. List of Potential Customers
- 13. Research Methodology
List of Figures
- Figure 1: Global Replenishment Facial Mask Revenue Breakdown (undefined, %) by Region 2025 & 2033
- Figure 2: Global Replenishment Facial Mask Volume Breakdown (K, %) by Region 2025 & 2033
- Figure 3: North America Replenishment Facial Mask Revenue (undefined), by Application 2025 & 2033
- Figure 4: North America Replenishment Facial Mask Volume (K), by Application 2025 & 2033
- Figure 5: North America Replenishment Facial Mask Revenue Share (%), by Application 2025 & 2033
- Figure 6: North America Replenishment Facial Mask Volume Share (%), by Application 2025 & 2033
- Figure 7: North America Replenishment Facial Mask Revenue (undefined), by Types 2025 & 2033
- Figure 8: North America Replenishment Facial Mask Volume (K), by Types 2025 & 2033
- Figure 9: North America Replenishment Facial Mask Revenue Share (%), by Types 2025 & 2033
- Figure 10: North America Replenishment Facial Mask Volume Share (%), by Types 2025 & 2033
- Figure 11: North America Replenishment Facial Mask Revenue (undefined), by Country 2025 & 2033
- Figure 12: North America Replenishment Facial Mask Volume (K), by Country 2025 & 2033
- Figure 13: North America Replenishment Facial Mask Revenue Share (%), by Country 2025 & 2033
- Figure 14: North America Replenishment Facial Mask Volume Share (%), by Country 2025 & 2033
- Figure 15: South America Replenishment Facial Mask Revenue (undefined), by Application 2025 & 2033
- Figure 16: South America Replenishment Facial Mask Volume (K), by Application 2025 & 2033
- Figure 17: South America Replenishment Facial Mask Revenue Share (%), by Application 2025 & 2033
- Figure 18: South America Replenishment Facial Mask Volume Share (%), by Application 2025 & 2033
- Figure 19: South America Replenishment Facial Mask Revenue (undefined), by Types 2025 & 2033
- Figure 20: South America Replenishment Facial Mask Volume (K), by Types 2025 & 2033
- Figure 21: South America Replenishment Facial Mask Revenue Share (%), by Types 2025 & 2033
- Figure 22: South America Replenishment Facial Mask Volume Share (%), by Types 2025 & 2033
- Figure 23: South America Replenishment Facial Mask Revenue (undefined), by Country 2025 & 2033
- Figure 24: South America Replenishment Facial Mask Volume (K), by Country 2025 & 2033
- Figure 25: South America Replenishment Facial Mask Revenue Share (%), by Country 2025 & 2033
- Figure 26: South America Replenishment Facial Mask Volume Share (%), by Country 2025 & 2033
- Figure 27: Europe Replenishment Facial Mask Revenue (undefined), by Application 2025 & 2033
- Figure 28: Europe Replenishment Facial Mask Volume (K), by Application 2025 & 2033
- Figure 29: Europe Replenishment Facial Mask Revenue Share (%), by Application 2025 & 2033
- Figure 30: Europe Replenishment Facial Mask Volume Share (%), by Application 2025 & 2033
- Figure 31: Europe Replenishment Facial Mask Revenue (undefined), by Types 2025 & 2033
- Figure 32: Europe Replenishment Facial Mask Volume (K), by Types 2025 & 2033
- Figure 33: Europe Replenishment Facial Mask Revenue Share (%), by Types 2025 & 2033
- Figure 34: Europe Replenishment Facial Mask Volume Share (%), by Types 2025 & 2033
- Figure 35: Europe Replenishment Facial Mask Revenue (undefined), by Country 2025 & 2033
- Figure 36: Europe Replenishment Facial Mask Volume (K), by Country 2025 & 2033
- Figure 37: Europe Replenishment Facial Mask Revenue Share (%), by Country 2025 & 2033
- Figure 38: Europe Replenishment Facial Mask Volume Share (%), by Country 2025 & 2033
- Figure 39: Middle East & Africa Replenishment Facial Mask Revenue (undefined), by Application 2025 & 2033
- Figure 40: Middle East & Africa Replenishment Facial Mask Volume (K), by Application 2025 & 2033
- Figure 41: Middle East & Africa Replenishment Facial Mask Revenue Share (%), by Application 2025 & 2033
- Figure 42: Middle East & Africa Replenishment Facial Mask Volume Share (%), by Application 2025 & 2033
- Figure 43: Middle East & Africa Replenishment Facial Mask Revenue (undefined), by Types 2025 & 2033
- Figure 44: Middle East & Africa Replenishment Facial Mask Volume (K), by Types 2025 & 2033
- Figure 45: Middle East & Africa Replenishment Facial Mask Revenue Share (%), by Types 2025 & 2033
- Figure 46: Middle East & Africa Replenishment Facial Mask Volume Share (%), by Types 2025 & 2033
- Figure 47: Middle East & Africa Replenishment Facial Mask Revenue (undefined), by Country 2025 & 2033
- Figure 48: Middle East & Africa Replenishment Facial Mask Volume (K), by Country 2025 & 2033
- Figure 49: Middle East & Africa Replenishment Facial Mask Revenue Share (%), by Country 2025 & 2033
- Figure 50: Middle East & Africa Replenishment Facial Mask Volume Share (%), by Country 2025 & 2033
- Figure 51: Asia Pacific Replenishment Facial Mask Revenue (undefined), by Application 2025 & 2033
- Figure 52: Asia Pacific Replenishment Facial Mask Volume (K), by Application 2025 & 2033
- Figure 53: Asia Pacific Replenishment Facial Mask Revenue Share (%), by Application 2025 & 2033
- Figure 54: Asia Pacific Replenishment Facial Mask Volume Share (%), by Application 2025 & 2033
- Figure 55: Asia Pacific Replenishment Facial Mask Revenue (undefined), by Types 2025 & 2033
- Figure 56: Asia Pacific Replenishment Facial Mask Volume (K), by Types 2025 & 2033
- Figure 57: Asia Pacific Replenishment Facial Mask Revenue Share (%), by Types 2025 & 2033
- Figure 58: Asia Pacific Replenishment Facial Mask Volume Share (%), by Types 2025 & 2033
- Figure 59: Asia Pacific Replenishment Facial Mask Revenue (undefined), by Country 2025 & 2033
- Figure 60: Asia Pacific Replenishment Facial Mask Volume (K), by Country 2025 & 2033
- Figure 61: Asia Pacific Replenishment Facial Mask Revenue Share (%), by Country 2025 & 2033
- Figure 62: Asia Pacific Replenishment Facial Mask Volume Share (%), by Country 2025 & 2033
List of Tables
- Table 1: Global Replenishment Facial Mask Revenue undefined Forecast, by Application 2020 & 2033
- Table 2: Global Replenishment Facial Mask Volume K Forecast, by Application 2020 & 2033
- Table 3: Global Replenishment Facial Mask Revenue undefined Forecast, by Types 2020 & 2033
- Table 4: Global Replenishment Facial Mask Volume K Forecast, by Types 2020 & 2033
- Table 5: Global Replenishment Facial Mask Revenue undefined Forecast, by Region 2020 & 2033
- Table 6: Global Replenishment Facial Mask Volume K Forecast, by Region 2020 & 2033
- Table 7: Global Replenishment Facial Mask Revenue undefined Forecast, by Application 2020 & 2033
- Table 8: Global Replenishment Facial Mask Volume K Forecast, by Application 2020 & 2033
- Table 9: Global Replenishment Facial Mask Revenue undefined Forecast, by Types 2020 & 2033
- Table 10: Global Replenishment Facial Mask Volume K Forecast, by Types 2020 & 2033
- Table 11: Global Replenishment Facial Mask Revenue undefined Forecast, by Country 2020 & 2033
- Table 12: Global Replenishment Facial Mask Volume K Forecast, by Country 2020 & 2033
- Table 13: United States Replenishment Facial Mask Revenue (undefined) Forecast, by Application 2020 & 2033
- Table 14: United States Replenishment Facial Mask Volume (K) Forecast, by Application 2020 & 2033
- Table 15: Canada Replenishment Facial Mask Revenue (undefined) Forecast, by Application 2020 & 2033
- Table 16: Canada Replenishment Facial Mask Volume (K) Forecast, by Application 2020 & 2033
- Table 17: Mexico Replenishment Facial Mask Revenue (undefined) Forecast, by Application 2020 & 2033
- Table 18: Mexico Replenishment Facial Mask Volume (K) Forecast, by Application 2020 & 2033
- Table 19: Global Replenishment Facial Mask Revenue undefined Forecast, by Application 2020 & 2033
- Table 20: Global Replenishment Facial Mask Volume K Forecast, by Application 2020 & 2033
- Table 21: Global Replenishment Facial Mask Revenue undefined Forecast, by Types 2020 & 2033
- Table 22: Global Replenishment Facial Mask Volume K Forecast, by Types 2020 & 2033
- Table 23: Global Replenishment Facial Mask Revenue undefined Forecast, by Country 2020 & 2033
- Table 24: Global Replenishment Facial Mask Volume K Forecast, by Country 2020 & 2033
- Table 25: Brazil Replenishment Facial Mask Revenue (undefined) Forecast, by Application 2020 & 2033
- Table 26: Brazil Replenishment Facial Mask Volume (K) Forecast, by Application 2020 & 2033
- Table 27: Argentina Replenishment Facial Mask Revenue (undefined) Forecast, by Application 2020 & 2033
- Table 28: Argentina Replenishment Facial Mask Volume (K) Forecast, by Application 2020 & 2033
- Table 29: Rest of South America Replenishment Facial Mask Revenue (undefined) Forecast, by Application 2020 & 2033
- Table 30: Rest of South America Replenishment Facial Mask Volume (K) Forecast, by Application 2020 & 2033
- Table 31: Global Replenishment Facial Mask Revenue undefined Forecast, by Application 2020 & 2033
- Table 32: Global Replenishment Facial Mask Volume K Forecast, by Application 2020 & 2033
- Table 33: Global Replenishment Facial Mask Revenue undefined Forecast, by Types 2020 & 2033
- Table 34: Global Replenishment Facial Mask Volume K Forecast, by Types 2020 & 2033
- Table 35: Global Replenishment Facial Mask Revenue undefined Forecast, by Country 2020 & 2033
- Table 36: Global Replenishment Facial Mask Volume K Forecast, by Country 2020 & 2033
- Table 37: United Kingdom Replenishment Facial Mask Revenue (undefined) Forecast, by Application 2020 & 2033
- Table 38: United Kingdom Replenishment Facial Mask Volume (K) Forecast, by Application 2020 & 2033
- Table 39: Germany Replenishment Facial Mask Revenue (undefined) Forecast, by Application 2020 & 2033
- Table 40: Germany Replenishment Facial Mask Volume (K) Forecast, by Application 2020 & 2033
- Table 41: France Replenishment Facial Mask Revenue (undefined) Forecast, by Application 2020 & 2033
- Table 42: France Replenishment Facial Mask Volume (K) Forecast, by Application 2020 & 2033
- Table 43: Italy Replenishment Facial Mask Revenue (undefined) Forecast, by Application 2020 & 2033
- Table 44: Italy Replenishment Facial Mask Volume (K) Forecast, by Application 2020 & 2033
- Table 45: Spain Replenishment Facial Mask Revenue (undefined) Forecast, by Application 2020 & 2033
- Table 46: Spain Replenishment Facial Mask Volume (K) Forecast, by Application 2020 & 2033
- Table 47: Russia Replenishment Facial Mask Revenue (undefined) Forecast, by Application 2020 & 2033
- Table 48: Russia Replenishment Facial Mask Volume (K) Forecast, by Application 2020 & 2033
- Table 49: Benelux Replenishment Facial Mask Revenue (undefined) Forecast, by Application 2020 & 2033
- Table 50: Benelux Replenishment Facial Mask Volume (K) Forecast, by Application 2020 & 2033
- Table 51: Nordics Replenishment Facial Mask Revenue (undefined) Forecast, by Application 2020 & 2033
- Table 52: Nordics Replenishment Facial Mask Volume (K) Forecast, by Application 2020 & 2033
- Table 53: Rest of Europe Replenishment Facial Mask Revenue (undefined) Forecast, by Application 2020 & 2033
- Table 54: Rest of Europe Replenishment Facial Mask Volume (K) Forecast, by Application 2020 & 2033
- Table 55: Global Replenishment Facial Mask Revenue undefined Forecast, by Application 2020 & 2033
- Table 56: Global Replenishment Facial Mask Volume K Forecast, by Application 2020 & 2033
- Table 57: Global Replenishment Facial Mask Revenue undefined Forecast, by Types 2020 & 2033
- Table 58: Global Replenishment Facial Mask Volume K Forecast, by Types 2020 & 2033
- Table 59: Global Replenishment Facial Mask Revenue undefined Forecast, by Country 2020 & 2033
- Table 60: Global Replenishment Facial Mask Volume K Forecast, by Country 2020 & 2033
- Table 61: Turkey Replenishment Facial Mask Revenue (undefined) Forecast, by Application 2020 & 2033
- Table 62: Turkey Replenishment Facial Mask Volume (K) Forecast, by Application 2020 & 2033
- Table 63: Israel Replenishment Facial Mask Revenue (undefined) Forecast, by Application 2020 & 2033
- Table 64: Israel Replenishment Facial Mask Volume (K) Forecast, by Application 2020 & 2033
- Table 65: GCC Replenishment Facial Mask Revenue (undefined) Forecast, by Application 2020 & 2033
- Table 66: GCC Replenishment Facial Mask Volume (K) Forecast, by Application 2020 & 2033
- Table 67: North Africa Replenishment Facial Mask Revenue (undefined) Forecast, by Application 2020 & 2033
- Table 68: North Africa Replenishment Facial Mask Volume (K) Forecast, by Application 2020 & 2033
- Table 69: South Africa Replenishment Facial Mask Revenue (undefined) Forecast, by Application 2020 & 2033
- Table 70: South Africa Replenishment Facial Mask Volume (K) Forecast, by Application 2020 & 2033
- Table 71: Rest of Middle East & Africa Replenishment Facial Mask Revenue (undefined) Forecast, by Application 2020 & 2033
- Table 72: Rest of Middle East & Africa Replenishment Facial Mask Volume (K) Forecast, by Application 2020 & 2033
- Table 73: Global Replenishment Facial Mask Revenue undefined Forecast, by Application 2020 & 2033
- Table 74: Global Replenishment Facial Mask Volume K Forecast, by Application 2020 & 2033
- Table 75: Global Replenishment Facial Mask Revenue undefined Forecast, by Types 2020 & 2033
- Table 76: Global Replenishment Facial Mask Volume K Forecast, by Types 2020 & 2033
- Table 77: Global Replenishment Facial Mask Revenue undefined Forecast, by Country 2020 & 2033
- Table 78: Global Replenishment Facial Mask Volume K Forecast, by Country 2020 & 2033
- Table 79: China Replenishment Facial Mask Revenue (undefined) Forecast, by Application 2020 & 2033
- Table 80: China Replenishment Facial Mask Volume (K) Forecast, by Application 2020 & 2033
- Table 81: India Replenishment Facial Mask Revenue (undefined) Forecast, by Application 2020 & 2033
- Table 82: India Replenishment Facial Mask Volume (K) Forecast, by Application 2020 & 2033
- Table 83: Japan Replenishment Facial Mask Revenue (undefined) Forecast, by Application 2020 & 2033
- Table 84: Japan Replenishment Facial Mask Volume (K) Forecast, by Application 2020 & 2033
- Table 85: South Korea Replenishment Facial Mask Revenue (undefined) Forecast, by Application 2020 & 2033
- Table 86: South Korea Replenishment Facial Mask Volume (K) Forecast, by Application 2020 & 2033
- Table 87: ASEAN Replenishment Facial Mask Revenue (undefined) Forecast, by Application 2020 & 2033
- Table 88: ASEAN Replenishment Facial Mask Volume (K) Forecast, by Application 2020 & 2033
- Table 89: Oceania Replenishment Facial Mask Revenue (undefined) Forecast, by Application 2020 & 2033
- Table 90: Oceania Replenishment Facial Mask Volume (K) Forecast, by Application 2020 & 2033
- Table 91: Rest of Asia Pacific Replenishment Facial Mask Revenue (undefined) Forecast, by Application 2020 & 2033
- Table 92: Rest of Asia Pacific Replenishment Facial Mask Volume (K) Forecast, by Application 2020 & 2033
Frequently Asked Questions
1. What is the projected Compound Annual Growth Rate (CAGR) of the Replenishment Facial Mask?
The projected CAGR is approximately 12.59%.
2. Which companies are prominent players in the Replenishment Facial Mask?
Key companies in the market include Shanghai Chicmax, Dr.Morita, LandP, My Beauty Diary, Yujiahui, Costory, Shanghai Yuemu, Herborist, Pechoin, THE FACE SHOP, Estee Lauder, SK-II, Choiskycn, Kose, Avon, Loreal, Inoherb, Olay, Shiseido, Yalget, Cel-derma, PROYA.
3. What are the main segments of the Replenishment Facial Mask?
The market segments include Application, Types.
4. Can you provide details about the market size?
The market size is estimated to be USD XXX N/A as of 2022.
5. What are some drivers contributing to market growth?
N/A
6. What are the notable trends driving market growth?
N/A
7. Are there any restraints impacting market growth?
N/A
8. Can you provide examples of recent developments in the market?
N/A
9. What pricing options are available for accessing the report?
Pricing options include single-user, multi-user, and enterprise licenses priced at USD 3350.00, USD 5025.00, and USD 6700.00 respectively.
10. Is the market size provided in terms of value or volume?
The market size is provided in terms of value, measured in N/A and volume, measured in K.
11. Are there any specific market keywords associated with the report?
Yes, the market keyword associated with the report is "Replenishment Facial Mask," which aids in identifying and referencing the specific market segment covered.
12. How do I determine which pricing option suits my needs best?
The pricing options vary based on user requirements and access needs. Individual users may opt for single-user licenses, while businesses requiring broader access may choose multi-user or enterprise licenses for cost-effective access to the report.
13. Are there any additional resources or data provided in the Replenishment Facial Mask report?
While the report offers comprehensive insights, it's advisable to review the specific contents or supplementary materials provided to ascertain if additional resources or data are available.
14. How can I stay updated on further developments or reports in the Replenishment Facial Mask?
To stay informed about further developments, trends, and reports in the Replenishment Facial Mask, consider subscribing to industry newsletters, following relevant companies and organizations, or regularly checking reputable industry news sources and publications.
Methodology
Step 1 - Identification of Relevant Samples Size from Population Database


Step 2 - Approaches for Defining Global Market Size (Value, Volume* & Price*)

Note*: In applicable scenarios
Step 3 - Data Sources
Primary Research
- Web Analytics
- Survey Reports
- Research Institute
- Latest Research Reports
- Opinion Leaders
Secondary Research
- Annual Reports
- White Paper
- Latest Press Release
- Industry Association
- Paid Database
- Investor Presentations

Step 4 - Data Triangulation
Involves using different sources of information in order to increase the validity of a study
These sources are likely to be stakeholders in a program - participants, other researchers, program staff, other community members, and so on.
Then we put all data in single framework & apply various statistical tools to find out the dynamic on the market.
During the analysis stage, feedback from the stakeholder groups would be compared to determine areas of agreement as well as areas of divergence