Key Insights
The Returnable Transit Packaging (RTP) market is projected to reach $257.7 billion by 2025, expanding at a robust compound annual growth rate (CAGR) of 7.19% from 2025 to 2033. This expansion is driven by the escalating demand for efficient and sustainable supply chain solutions, as businesses prioritize reusable packaging to minimize waste and environmental impact. The proliferation of e-commerce and the imperative for enhanced product protection during transit are significant contributors. Innovations in material science, yielding lighter, stronger, and more durable RTP options, further stimulate market growth. The plastic segment currently leads due to its cost-effectiveness and versatility, though increasing environmental awareness is fostering the adoption of sustainable alternatives such as wood and metal in specialized applications. Growth is evident across all major regions, with North America and Europe maintaining substantial market shares owing to established supply chains and high adoption rates. However, the Asia-Pacific region is anticipated to experience considerable growth, fueled by rapid industrialization and increasing e-commerce penetration. Challenges such as fluctuating raw material prices and potential supply chain disruptions exist, but the long-term growth trajectory remains strong, underpinned by the growing emphasis on circular economy principles and supply chain optimization.
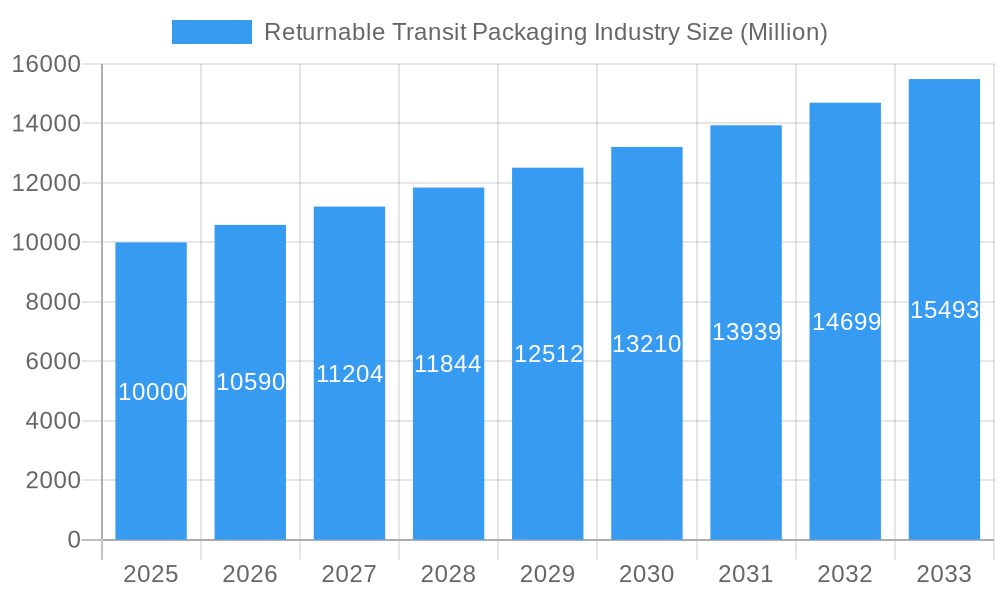
Returnable Transit Packaging Industry Market Size (In Billion)
The RTP market exhibits diverse segmentation. Key revenue generators include product types like containers, drums & barrels, and Intermediate Bulk Containers (IBCs), with pallets and crates also holding significant market share. Application-wise, the automotive, food & beverage, and consumer goods sectors are primary consumers of RTP, underscoring its critical role in preserving product integrity across industries. Leading entities such as Polymer Logistics NV, SSI Schaefer Group, and Brambles Limited (CHEP) are influencing the market through innovation and strategic alliances, while smaller players serve niche segments. Regional analysis indicates a strong presence in developed markets, yet emerging economies in Asia-Pacific and South America present substantial untapped potential. Future growth is contingent upon continuous technological advancements, government regulations promoting sustainability, and the evolving demands of a globally integrated supply chain. Strategic acquisitions and partnerships will be instrumental in shaping the competitive landscape.
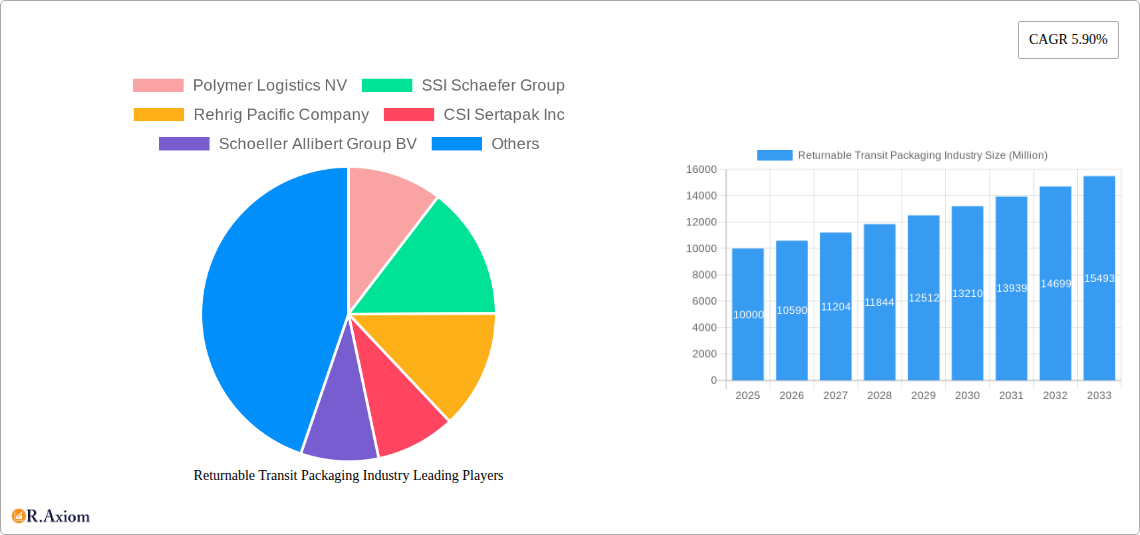
Returnable Transit Packaging Industry Company Market Share
Returnable Transit Packaging Industry Market Report: 2019-2033
This comprehensive report provides a detailed analysis of the Returnable Transit Packaging (RTP) industry, offering invaluable insights for stakeholders seeking to navigate this dynamic market. The study period covers 2019-2033, with 2025 serving as the base and estimated year. The forecast period extends from 2025 to 2033, building upon historical data from 2019-2024. The report analyzes market trends, key players, and future opportunities across various segments, including materials (plastic, metal, wood), product types (containers, pallets, IBCs, etc.), and applications (automotive, food & beverage, etc.). The report projects a market value exceeding XX Million by 2033, driven by factors detailed within.
Returnable Transit Packaging Industry Market Concentration & Innovation
The Returnable Transit Packaging industry exhibits a moderately concentrated market structure, with several large players holding significant market share. Polymer Logistics NV, SSI Schaefer Group, Rehrig Pacific Company, CSI Sertapak Inc, Schoeller Allibert Group BV, Nefab AB, IFCO Systems, Mugele Group, Lamar Packaging Systems, and Brambles Limited (CHEP, Orbis Corporation) are key players shaping the industry landscape. Their combined market share is estimated at approximately 60% in 2025.
Innovation is driven by the need for sustainable, efficient, and cost-effective packaging solutions. The industry is witnessing increased adoption of lightweight materials, improved designs for enhanced stacking and load stability, and integration of smart technologies for tracking and management. Regulatory frameworks focused on sustainability and waste reduction are significant drivers of innovation, pushing companies to develop reusable and recyclable packaging options. Product substitution is a factor, with companies continually seeking improvements in materials and designs, influencing market share. Mergers and acquisitions (M&A) activities are playing a crucial role in shaping market consolidation and expanding product portfolios, with total M&A deal values exceeding XX Million in the past five years.
- Market Share Concentration: Top 10 players hold ~60% market share (2025 estimate).
- Innovation Drivers: Sustainability regulations, efficiency demands, technological advancements.
- M&A Activity: Total deal value exceeding XX Million in the last 5 years.
- Key Innovation Areas: Lightweight materials, smart tracking, improved designs.
Returnable Transit Packaging Industry Industry Trends & Insights
The Returnable Transit Packaging industry is experiencing robust growth, driven by the increasing demand for efficient and sustainable logistics solutions across various sectors. The global market is projected to witness a Compound Annual Growth Rate (CAGR) of xx% during the forecast period (2025-2033), reaching a value of XX Million by 2033. This growth is fueled by several factors, including the rising adoption of e-commerce, the growing emphasis on supply chain optimization, and the increasing awareness of environmental sustainability. Technological disruptions, such as the integration of IoT sensors for real-time tracking and data analytics, are transforming industry operations and creating new opportunities for growth. Consumer preferences for eco-friendly and reusable packaging are also influencing market trends. The competitive landscape is characterized by intense rivalry among existing players, with companies vying for market share through product innovation, strategic partnerships, and aggressive pricing strategies. Market penetration of returnable packaging solutions is steadily increasing across various sectors, particularly in the food & beverage and automotive industries.
Dominant Markets & Segments in Returnable Transit Packaging Industry
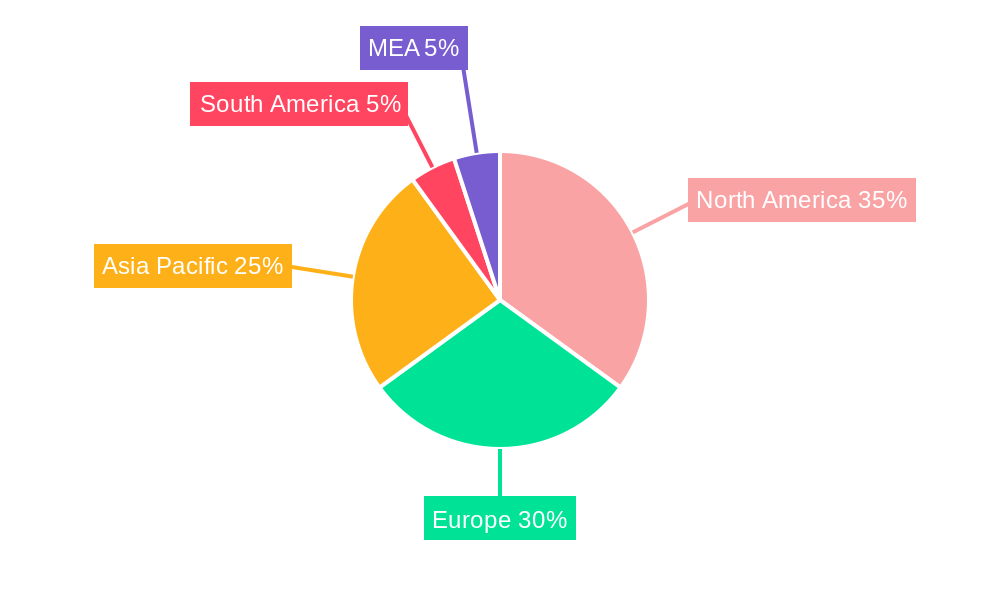
The Returnable Transit Packaging market is geographically diverse, with significant regional variations in growth rates and market size. While detailed country-level dominance requires further analysis, the European region currently holds a leading position in terms of market size and adoption, followed by North America and Asia Pacific. The dominance of Europe is largely attributed to stringent environmental regulations and the presence of large, established players within the region. The strong automotive and industrial sectors in Europe also contribute significantly to the demand for returnable transit packaging.
- Leading Region: Europe (Market Size: XX Million in 2025)
- Dominant Segment (Material): Plastic (Market share: XX% in 2025) - driven by its versatility, durability, and cost-effectiveness.
- Dominant Segment (Product): Pallets (Market share: xx% in 2025) – due to high demand in logistics and supply chains.
- Dominant Segment (Application): Automotive (Market share: xx% in 2025) – driven by the industry's need for robust and standardized packaging for efficient transport.
Key Drivers:
- Stringent environmental regulations in Europe
- Well-established manufacturing base and logistics infrastructure in Europe
- High demand from automotive and industrial sectors
- Increasing adoption of returnable packaging across different sectors
Returnable Transit Packaging Industry Product Developments
Recent product innovations focus on enhancing durability, hygiene, and sustainability. Lightweight designs using advanced polymers reduce transport costs and carbon footprint. Integration of RFID tags enables real-time tracking and improved inventory management. The market is witnessing a shift towards modular and customizable packaging systems, enabling companies to optimize their packaging solutions based on specific needs. Companies are also developing specialized coatings and treatments to ensure packaging hygiene and maintain product quality during transit. These developments are improving efficiency and lowering the total cost of ownership for businesses using returnable packaging solutions.
Report Scope & Segmentation Analysis
This report segments the Returnable Transit Packaging market based on Material (Plastic, Metal, Wood), Product (Containers, Drums & Barrels, Pallets, Crates, Totes, Trays & Bins, Intermediate Bulk Containers (IBCs), Other Product Types), and Application (Automotive, Food and Beverages, Consumer Goods, Industrial, Others). Each segment is analyzed in detail, providing growth projections, market sizes, and competitive dynamics. Plastic dominates due to cost-effectiveness and versatility, while pallets and containers are leading product types. The automotive and food & beverage sectors drive high demand across various product types.
Key Drivers of Returnable Transit Packaging Industry Growth
The Returnable Transit Packaging industry's growth is fueled by several key factors. Stringent environmental regulations promoting sustainability are driving demand for reusable packaging. The push for supply chain optimization and cost reduction incentivizes businesses to adopt efficient RTP solutions. Technological advancements, such as real-time tracking and data analytics, further enhance efficiency and reduce waste. The rise of e-commerce is also a major contributor, increasing the demand for secure and reliable packaging solutions.
Challenges in the Returnable Transit Packaging Industry Sector
The industry faces challenges including high initial investment costs for implementing RTP systems, complexities in managing reverse logistics, and the potential for damage or loss during transit. Fluctuations in raw material prices also impact profitability. Intense competition among established players and new entrants creates pricing pressures. Furthermore, achieving high levels of cleaning and sanitation in returnable packaging can be difficult and requires careful management. These factors can constrain growth and profitability if not properly addressed.
Emerging Opportunities in Returnable Transit Packaging Industry
Emerging opportunities lie in the development of innovative materials with enhanced durability and recyclability. The integration of smart technologies for real-time tracking and condition monitoring opens up new possibilities for supply chain optimization. Expansion into new geographical markets, especially in developing economies with growing industrial sectors, presents significant growth potential. The increasing demand for sustainable packaging solutions offers a considerable opportunity for companies that can deliver eco-friendly, cost-effective alternatives.
Leading Players in the Returnable Transit Packaging Industry Market
- Polymer Logistics NV
- SSI Schaefer Group
- Rehrig Pacific Company
- CSI Sertapak Inc
- Schoeller Allibert Group BV
- Nefab AB
- IFCO Systems
- Mugele Group
- Lamar Packaging Systems
- Brambles Limited (CHEP, Orbis Corporation)
Key Developments in Returnable Transit Packaging Industry Industry
- 2022 Q3: Schoeller Allibert launched a new range of sustainable plastic pallets.
- 2023 Q1: Polymer Logistics announced a significant expansion of its manufacturing facilities.
- 2024 Q2: Brambles (CHEP) invested in advanced tracking technology for its pallet pooling services.
- (Further developments will be included in the final report)
Strategic Outlook for Returnable Transit Packaging Industry Market
The Returnable Transit Packaging industry is poised for sustained growth, driven by factors such as increasing environmental consciousness, technological advancements, and the need for efficient logistics solutions. Further consolidation through M&A is likely, leading to larger, more integrated players. Focus on sustainability and circular economy principles will continue to shape industry innovation. Opportunities exist in developing customized and intelligent packaging solutions to meet the specific needs of various industries and regions. The market's future potential is significant, particularly in emerging markets and industries demanding enhanced supply chain visibility and sustainability.
Returnable Transit Packaging Industry Segmentation
-
1. Material
- 1.1. Plastic
- 1.2. Metal
- 1.3. Wood
-
2. Product
- 2.1. Containers
- 2.2. Drums & Barrels
- 2.3. Pallets
- 2.4. Crates, Totes, Trays & Bins
- 2.5. Intermediate Bulk Containers (IBC's)
- 2.6. Other Product Types
-
3. Application
- 3.1. Automotive
- 3.2. Food and Beverages
- 3.3. Consumer Goods
- 3.4. Industrial
- 3.5. Others
Returnable Transit Packaging Industry Segmentation By Geography
- 1. North America
- 2. Europe
- 3. Asia Pacific
- 4. Latin America
- 5. Middle East and Africa
Returnable Transit Packaging Industry Regional Market Share
Geographic Coverage of Returnable Transit Packaging Industry
Returnable Transit Packaging Industry REPORT HIGHLIGHTS
| Aspects | Details |
|---|---|
| Study Period | 2020-2034 |
| Base Year | 2025 |
| Estimated Year | 2026 |
| Forecast Period | 2026-2034 |
| Historical Period | 2020-2025 |
| Growth Rate | CAGR of 7.19% from 2020-2034 |
| Segmentation |
|
Table of Contents
- 1. Introduction
- 1.1. Research Scope
- 1.2. Market Segmentation
- 1.3. Research Objective
- 1.4. Definitions and Assumptions
- 2. Executive Summary
- 2.1. Market Snapshot
- 3. Market Dynamics
- 3.1. Market Drivers
- 3.2. Market Restrains
- 3.3. Market Trends
- 3.4. Market Opportunities
- 4. Market Factor Analysis
- 4.1. Porters Five Forces
- 4.1.1. Bargaining Power of Suppliers
- 4.1.2. Bargaining Power of Buyers
- 4.1.3. Threat of New Entrants
- 4.1.4. Threat of Substitutes
- 4.1.5. Competitive Rivalry
- 4.2. PESTEL analysis
- 4.3. BCG Analysis
- 4.3.1. Stars (High Growth, High Market Share)
- 4.3.2. Cash Cows (Low Growth, High Market Share)
- 4.3.3. Question Mark (High Growth, Low Market Share)
- 4.3.4. Dogs (Low Growth, Low Market Share)
- 4.4. Ansoff Matrix Analysis
- 4.5. Supply Chain Analysis
- 4.6. Regulatory Landscape
- 4.7. Current Market Potential and Opportunity Assessment (TAM–SAM–SOM Framework)
- 4.8. RAX Analyst Note
- 4.1. Porters Five Forces
- 5. Market Analysis, Insights and Forecast 2021-2033
- 5.1. Market Analysis, Insights and Forecast - by Material
- 5.1.1. Plastic
- 5.1.2. Metal
- 5.1.3. Wood
- 5.2. Market Analysis, Insights and Forecast - by Product
- 5.2.1. Containers
- 5.2.2. Drums & Barrels
- 5.2.3. Pallets
- 5.2.4. Crates, Totes, Trays & Bins
- 5.2.5. Intermediate Bulk Containers (IBC's)
- 5.2.6. Other Product Types
- 5.3. Market Analysis, Insights and Forecast - by Application
- 5.3.1. Automotive
- 5.3.2. Food and Beverages
- 5.3.3. Consumer Goods
- 5.3.4. Industrial
- 5.3.5. Others
- 5.4. Market Analysis, Insights and Forecast - by Region
- 5.4.1. North America
- 5.4.2. Europe
- 5.4.3. Asia Pacific
- 5.4.4. Latin America
- 5.4.5. Middle East and Africa
- 5.1. Market Analysis, Insights and Forecast - by Material
- 6. Global Returnable Transit Packaging Industry Analysis, Insights and Forecast, 2021-2033
- 6.1. Market Analysis, Insights and Forecast - by Material
- 6.1.1. Plastic
- 6.1.2. Metal
- 6.1.3. Wood
- 6.2. Market Analysis, Insights and Forecast - by Product
- 6.2.1. Containers
- 6.2.2. Drums & Barrels
- 6.2.3. Pallets
- 6.2.4. Crates, Totes, Trays & Bins
- 6.2.5. Intermediate Bulk Containers (IBC's)
- 6.2.6. Other Product Types
- 6.3. Market Analysis, Insights and Forecast - by Application
- 6.3.1. Automotive
- 6.3.2. Food and Beverages
- 6.3.3. Consumer Goods
- 6.3.4. Industrial
- 6.3.5. Others
- 6.1. Market Analysis, Insights and Forecast - by Material
- 7. North America Returnable Transit Packaging Industry Analysis, Insights and Forecast, 2020-2032
- 7.1. Market Analysis, Insights and Forecast - by Material
- 7.1.1. Plastic
- 7.1.2. Metal
- 7.1.3. Wood
- 7.2. Market Analysis, Insights and Forecast - by Product
- 7.2.1. Containers
- 7.2.2. Drums & Barrels
- 7.2.3. Pallets
- 7.2.4. Crates, Totes, Trays & Bins
- 7.2.5. Intermediate Bulk Containers (IBC's)
- 7.2.6. Other Product Types
- 7.3. Market Analysis, Insights and Forecast - by Application
- 7.3.1. Automotive
- 7.3.2. Food and Beverages
- 7.3.3. Consumer Goods
- 7.3.4. Industrial
- 7.3.5. Others
- 7.1. Market Analysis, Insights and Forecast - by Material
- 8. Europe Returnable Transit Packaging Industry Analysis, Insights and Forecast, 2020-2032
- 8.1. Market Analysis, Insights and Forecast - by Material
- 8.1.1. Plastic
- 8.1.2. Metal
- 8.1.3. Wood
- 8.2. Market Analysis, Insights and Forecast - by Product
- 8.2.1. Containers
- 8.2.2. Drums & Barrels
- 8.2.3. Pallets
- 8.2.4. Crates, Totes, Trays & Bins
- 8.2.5. Intermediate Bulk Containers (IBC's)
- 8.2.6. Other Product Types
- 8.3. Market Analysis, Insights and Forecast - by Application
- 8.3.1. Automotive
- 8.3.2. Food and Beverages
- 8.3.3. Consumer Goods
- 8.3.4. Industrial
- 8.3.5. Others
- 8.1. Market Analysis, Insights and Forecast - by Material
- 9. Asia Pacific Returnable Transit Packaging Industry Analysis, Insights and Forecast, 2020-2032
- 9.1. Market Analysis, Insights and Forecast - by Material
- 9.1.1. Plastic
- 9.1.2. Metal
- 9.1.3. Wood
- 9.2. Market Analysis, Insights and Forecast - by Product
- 9.2.1. Containers
- 9.2.2. Drums & Barrels
- 9.2.3. Pallets
- 9.2.4. Crates, Totes, Trays & Bins
- 9.2.5. Intermediate Bulk Containers (IBC's)
- 9.2.6. Other Product Types
- 9.3. Market Analysis, Insights and Forecast - by Application
- 9.3.1. Automotive
- 9.3.2. Food and Beverages
- 9.3.3. Consumer Goods
- 9.3.4. Industrial
- 9.3.5. Others
- 9.1. Market Analysis, Insights and Forecast - by Material
- 10. Latin America Returnable Transit Packaging Industry Analysis, Insights and Forecast, 2020-2032
- 10.1. Market Analysis, Insights and Forecast - by Material
- 10.1.1. Plastic
- 10.1.2. Metal
- 10.1.3. Wood
- 10.2. Market Analysis, Insights and Forecast - by Product
- 10.2.1. Containers
- 10.2.2. Drums & Barrels
- 10.2.3. Pallets
- 10.2.4. Crates, Totes, Trays & Bins
- 10.2.5. Intermediate Bulk Containers (IBC's)
- 10.2.6. Other Product Types
- 10.3. Market Analysis, Insights and Forecast - by Application
- 10.3.1. Automotive
- 10.3.2. Food and Beverages
- 10.3.3. Consumer Goods
- 10.3.4. Industrial
- 10.3.5. Others
- 10.1. Market Analysis, Insights and Forecast - by Material
- 11. Middle East and Africa Returnable Transit Packaging Industry Analysis, Insights and Forecast, 2020-2032
- 11.1. Market Analysis, Insights and Forecast - by Material
- 11.1.1. Plastic
- 11.1.2. Metal
- 11.1.3. Wood
- 11.2. Market Analysis, Insights and Forecast - by Product
- 11.2.1. Containers
- 11.2.2. Drums & Barrels
- 11.2.3. Pallets
- 11.2.4. Crates, Totes, Trays & Bins
- 11.2.5. Intermediate Bulk Containers (IBC's)
- 11.2.6. Other Product Types
- 11.3. Market Analysis, Insights and Forecast - by Application
- 11.3.1. Automotive
- 11.3.2. Food and Beverages
- 11.3.3. Consumer Goods
- 11.3.4. Industrial
- 11.3.5. Others
- 11.1. Market Analysis, Insights and Forecast - by Material
- 12. Competitive Analysis
- 12.1. Company Profiles
- 12.1.1 Polymer Logistics NV
- 12.1.1.1. Company Overview
- 12.1.1.2. Products
- 12.1.1.3. Company Financials
- 12.1.1.4. SWOT Analysis
- 12.1.2 SSI Schaefer Group
- 12.1.2.1. Company Overview
- 12.1.2.2. Products
- 12.1.2.3. Company Financials
- 12.1.2.4. SWOT Analysis
- 12.1.3 Rehrig Pacific Company
- 12.1.3.1. Company Overview
- 12.1.3.2. Products
- 12.1.3.3. Company Financials
- 12.1.3.4. SWOT Analysis
- 12.1.4 CSI Sertapak Inc
- 12.1.4.1. Company Overview
- 12.1.4.2. Products
- 12.1.4.3. Company Financials
- 12.1.4.4. SWOT Analysis
- 12.1.5 Schoeller Allibert Group BV
- 12.1.5.1. Company Overview
- 12.1.5.2. Products
- 12.1.5.3. Company Financials
- 12.1.5.4. SWOT Analysis
- 12.1.6 Nefab AB
- 12.1.6.1. Company Overview
- 12.1.6.2. Products
- 12.1.6.3. Company Financials
- 12.1.6.4. SWOT Analysis
- 12.1.7 IFCO Systems
- 12.1.7.1. Company Overview
- 12.1.7.2. Products
- 12.1.7.3. Company Financials
- 12.1.7.4. SWOT Analysis
- 12.1.8 Mugele Group
- 12.1.8.1. Company Overview
- 12.1.8.2. Products
- 12.1.8.3. Company Financials
- 12.1.8.4. SWOT Analysis
- 12.1.9 Lamar Packaging Systems
- 12.1.9.1. Company Overview
- 12.1.9.2. Products
- 12.1.9.3. Company Financials
- 12.1.9.4. SWOT Analysis
- 12.1.10 Brambles Limited (CHEP
- 12.1.10.1. Company Overview
- 12.1.10.2. Products
- 12.1.10.3. Company Financials
- 12.1.10.4. SWOT Analysis
- 12.1.11 Orbis Corporation
- 12.1.11.1. Company Overview
- 12.1.11.2. Products
- 12.1.11.3. Company Financials
- 12.1.11.4. SWOT Analysis
- 12.1.1 Polymer Logistics NV
- 12.2. Market Entropy
- 12.2.1 Company's Key Areas Served
- 12.2.2 Recent Developments
- 12.3. Company Market Share Analysis 2025
- 12.3.1 Top 5 Companies Market Share Analysis
- 12.3.2 Top 3 Companies Market Share Analysis
- 12.4. List of Potential Customers
- 13. Research Methodology
List of Figures
- Figure 1: Global Returnable Transit Packaging Industry Revenue Breakdown (billion, %) by Region 2025 & 2033
- Figure 2: North America Returnable Transit Packaging Industry Revenue (billion), by Material 2025 & 2033
- Figure 3: North America Returnable Transit Packaging Industry Revenue Share (%), by Material 2025 & 2033
- Figure 4: North America Returnable Transit Packaging Industry Revenue (billion), by Product 2025 & 2033
- Figure 5: North America Returnable Transit Packaging Industry Revenue Share (%), by Product 2025 & 2033
- Figure 6: North America Returnable Transit Packaging Industry Revenue (billion), by Application 2025 & 2033
- Figure 7: North America Returnable Transit Packaging Industry Revenue Share (%), by Application 2025 & 2033
- Figure 8: North America Returnable Transit Packaging Industry Revenue (billion), by Country 2025 & 2033
- Figure 9: North America Returnable Transit Packaging Industry Revenue Share (%), by Country 2025 & 2033
- Figure 10: Europe Returnable Transit Packaging Industry Revenue (billion), by Material 2025 & 2033
- Figure 11: Europe Returnable Transit Packaging Industry Revenue Share (%), by Material 2025 & 2033
- Figure 12: Europe Returnable Transit Packaging Industry Revenue (billion), by Product 2025 & 2033
- Figure 13: Europe Returnable Transit Packaging Industry Revenue Share (%), by Product 2025 & 2033
- Figure 14: Europe Returnable Transit Packaging Industry Revenue (billion), by Application 2025 & 2033
- Figure 15: Europe Returnable Transit Packaging Industry Revenue Share (%), by Application 2025 & 2033
- Figure 16: Europe Returnable Transit Packaging Industry Revenue (billion), by Country 2025 & 2033
- Figure 17: Europe Returnable Transit Packaging Industry Revenue Share (%), by Country 2025 & 2033
- Figure 18: Asia Pacific Returnable Transit Packaging Industry Revenue (billion), by Material 2025 & 2033
- Figure 19: Asia Pacific Returnable Transit Packaging Industry Revenue Share (%), by Material 2025 & 2033
- Figure 20: Asia Pacific Returnable Transit Packaging Industry Revenue (billion), by Product 2025 & 2033
- Figure 21: Asia Pacific Returnable Transit Packaging Industry Revenue Share (%), by Product 2025 & 2033
- Figure 22: Asia Pacific Returnable Transit Packaging Industry Revenue (billion), by Application 2025 & 2033
- Figure 23: Asia Pacific Returnable Transit Packaging Industry Revenue Share (%), by Application 2025 & 2033
- Figure 24: Asia Pacific Returnable Transit Packaging Industry Revenue (billion), by Country 2025 & 2033
- Figure 25: Asia Pacific Returnable Transit Packaging Industry Revenue Share (%), by Country 2025 & 2033
- Figure 26: Latin America Returnable Transit Packaging Industry Revenue (billion), by Material 2025 & 2033
- Figure 27: Latin America Returnable Transit Packaging Industry Revenue Share (%), by Material 2025 & 2033
- Figure 28: Latin America Returnable Transit Packaging Industry Revenue (billion), by Product 2025 & 2033
- Figure 29: Latin America Returnable Transit Packaging Industry Revenue Share (%), by Product 2025 & 2033
- Figure 30: Latin America Returnable Transit Packaging Industry Revenue (billion), by Application 2025 & 2033
- Figure 31: Latin America Returnable Transit Packaging Industry Revenue Share (%), by Application 2025 & 2033
- Figure 32: Latin America Returnable Transit Packaging Industry Revenue (billion), by Country 2025 & 2033
- Figure 33: Latin America Returnable Transit Packaging Industry Revenue Share (%), by Country 2025 & 2033
- Figure 34: Middle East and Africa Returnable Transit Packaging Industry Revenue (billion), by Material 2025 & 2033
- Figure 35: Middle East and Africa Returnable Transit Packaging Industry Revenue Share (%), by Material 2025 & 2033
- Figure 36: Middle East and Africa Returnable Transit Packaging Industry Revenue (billion), by Product 2025 & 2033
- Figure 37: Middle East and Africa Returnable Transit Packaging Industry Revenue Share (%), by Product 2025 & 2033
- Figure 38: Middle East and Africa Returnable Transit Packaging Industry Revenue (billion), by Application 2025 & 2033
- Figure 39: Middle East and Africa Returnable Transit Packaging Industry Revenue Share (%), by Application 2025 & 2033
- Figure 40: Middle East and Africa Returnable Transit Packaging Industry Revenue (billion), by Country 2025 & 2033
- Figure 41: Middle East and Africa Returnable Transit Packaging Industry Revenue Share (%), by Country 2025 & 2033
List of Tables
- Table 1: Global Returnable Transit Packaging Industry Revenue billion Forecast, by Material 2020 & 2033
- Table 2: Global Returnable Transit Packaging Industry Revenue billion Forecast, by Product 2020 & 2033
- Table 3: Global Returnable Transit Packaging Industry Revenue billion Forecast, by Application 2020 & 2033
- Table 4: Global Returnable Transit Packaging Industry Revenue billion Forecast, by Region 2020 & 2033
- Table 5: Global Returnable Transit Packaging Industry Revenue billion Forecast, by Material 2020 & 2033
- Table 6: Global Returnable Transit Packaging Industry Revenue billion Forecast, by Product 2020 & 2033
- Table 7: Global Returnable Transit Packaging Industry Revenue billion Forecast, by Application 2020 & 2033
- Table 8: Global Returnable Transit Packaging Industry Revenue billion Forecast, by Country 2020 & 2033
- Table 9: Global Returnable Transit Packaging Industry Revenue billion Forecast, by Material 2020 & 2033
- Table 10: Global Returnable Transit Packaging Industry Revenue billion Forecast, by Product 2020 & 2033
- Table 11: Global Returnable Transit Packaging Industry Revenue billion Forecast, by Application 2020 & 2033
- Table 12: Global Returnable Transit Packaging Industry Revenue billion Forecast, by Country 2020 & 2033
- Table 13: Global Returnable Transit Packaging Industry Revenue billion Forecast, by Material 2020 & 2033
- Table 14: Global Returnable Transit Packaging Industry Revenue billion Forecast, by Product 2020 & 2033
- Table 15: Global Returnable Transit Packaging Industry Revenue billion Forecast, by Application 2020 & 2033
- Table 16: Global Returnable Transit Packaging Industry Revenue billion Forecast, by Country 2020 & 2033
- Table 17: Global Returnable Transit Packaging Industry Revenue billion Forecast, by Material 2020 & 2033
- Table 18: Global Returnable Transit Packaging Industry Revenue billion Forecast, by Product 2020 & 2033
- Table 19: Global Returnable Transit Packaging Industry Revenue billion Forecast, by Application 2020 & 2033
- Table 20: Global Returnable Transit Packaging Industry Revenue billion Forecast, by Country 2020 & 2033
- Table 21: Global Returnable Transit Packaging Industry Revenue billion Forecast, by Material 2020 & 2033
- Table 22: Global Returnable Transit Packaging Industry Revenue billion Forecast, by Product 2020 & 2033
- Table 23: Global Returnable Transit Packaging Industry Revenue billion Forecast, by Application 2020 & 2033
- Table 24: Global Returnable Transit Packaging Industry Revenue billion Forecast, by Country 2020 & 2033
Frequently Asked Questions
1. What is the projected Compound Annual Growth Rate (CAGR) of the Returnable Transit Packaging Industry?
The projected CAGR is approximately 7.19%.
2. Which companies are prominent players in the Returnable Transit Packaging Industry?
Key companies in the market include Polymer Logistics NV, SSI Schaefer Group, Rehrig Pacific Company, CSI Sertapak Inc, Schoeller Allibert Group BV, Nefab AB, IFCO Systems, Mugele Group, Lamar Packaging Systems, Brambles Limited (CHEP, Orbis Corporation.
3. What are the main segments of the Returnable Transit Packaging Industry?
The market segments include Material, Product, Application.
4. Can you provide details about the market size?
The market size is estimated to be USD 257.7 billion as of 2022.
5. What are some drivers contributing to market growth?
; Demand for RTP from F&B. and Textile Industries; Stringent Government Regulations by the Government.
6. What are the notable trends driving market growth?
Drums and Barrels to Witness Significant Market Growth.
7. Are there any restraints impacting market growth?
; High Initial Costs to Setup and Buying all Kinds of Matericals.
8. Can you provide examples of recent developments in the market?
N/A
9. What pricing options are available for accessing the report?
Pricing options include single-user, multi-user, and enterprise licenses priced at USD 4750, USD 5250, and USD 8750 respectively.
10. Is the market size provided in terms of value or volume?
The market size is provided in terms of value, measured in billion.
11. Are there any specific market keywords associated with the report?
Yes, the market keyword associated with the report is "Returnable Transit Packaging Industry," which aids in identifying and referencing the specific market segment covered.
12. How do I determine which pricing option suits my needs best?
The pricing options vary based on user requirements and access needs. Individual users may opt for single-user licenses, while businesses requiring broader access may choose multi-user or enterprise licenses for cost-effective access to the report.
13. Are there any additional resources or data provided in the Returnable Transit Packaging Industry report?
While the report offers comprehensive insights, it's advisable to review the specific contents or supplementary materials provided to ascertain if additional resources or data are available.
14. How can I stay updated on further developments or reports in the Returnable Transit Packaging Industry?
To stay informed about further developments, trends, and reports in the Returnable Transit Packaging Industry, consider subscribing to industry newsletters, following relevant companies and organizations, or regularly checking reputable industry news sources and publications.
Methodology
Step 1 - Identification of Relevant Samples Size from Population Database


Step 2 - Approaches for Defining Global Market Size (Value, Volume* & Price*)

Note*: In applicable scenarios
Step 3 - Data Sources
Primary Research
- Web Analytics
- Survey Reports
- Research Institute
- Latest Research Reports
- Opinion Leaders
Secondary Research
- Annual Reports
- White Paper
- Latest Press Release
- Industry Association
- Paid Database
- Investor Presentations

Step 4 - Data Triangulation
Involves using different sources of information in order to increase the validity of a study
These sources are likely to be stakeholders in a program - participants, other researchers, program staff, other community members, and so on.
Then we put all data in single framework & apply various statistical tools to find out the dynamic on the market.
During the analysis stage, feedback from the stakeholder groups would be compared to determine areas of agreement as well as areas of divergence

