

Key Insights
The reusable wine cork market is experiencing significant growth, driven by increasing consumer awareness of environmental sustainability and the desire for eco-friendly alternatives to traditional single-use corks. The market's value is estimated at $500 million in 2025, projecting a robust Compound Annual Growth Rate (CAGR) of 10% throughout the forecast period (2025-2033). This growth is fueled by several key factors, including the rising popularity of premium wines, where reusable corks enhance the perceived value and luxury of the product. Furthermore, the increasing adoption of sustainable packaging solutions across various industries is indirectly boosting demand for reusable wine corks. Government regulations promoting environmentally conscious practices and the growing influence of eco-conscious consumerism are also contributing to the market's expansion. Major players like Amorim Cork, Jelinek Cork Group, and others are actively investing in research and development to improve the functionality and longevity of reusable corks, enhancing their market appeal.
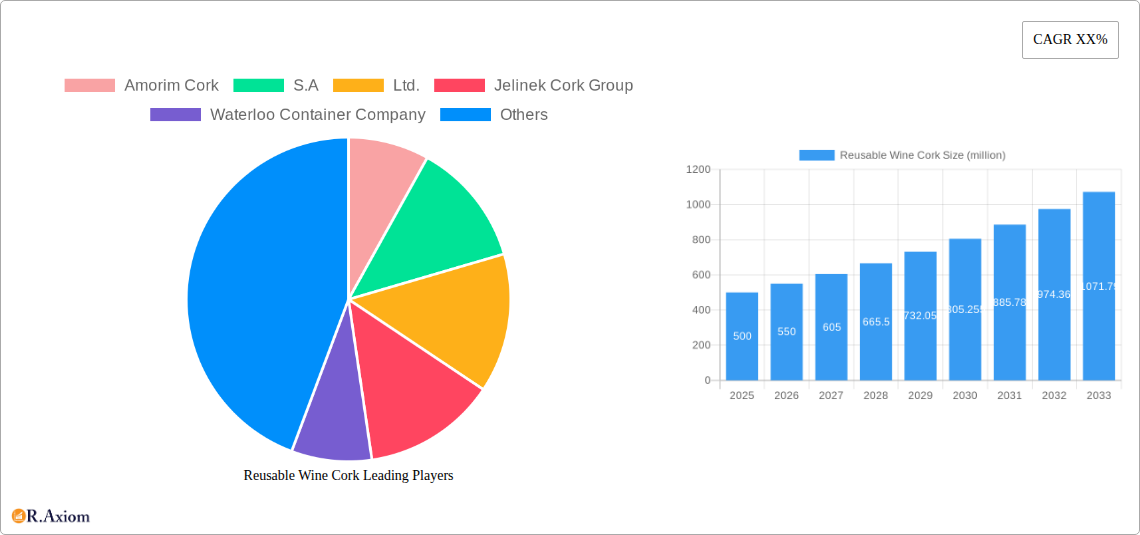
Reusable Wine Cork Market Size (In Million)
However, the market faces certain challenges. The higher initial cost of reusable corks compared to traditional alternatives can be a barrier for some wine producers, particularly smaller wineries with tighter budgets. Additionally, the need for specialized cleaning and maintenance procedures for reusable corks might pose a logistical challenge for some businesses. Despite these restraints, the long-term prospects for the reusable wine cork market remain extremely positive, as the sustainability trend continues to gain momentum, making reusable and environmentally friendly products increasingly desirable to consumers and businesses alike. Market segmentation reveals strong growth in the premium wine segment, where the added cost of reusable corks is viewed as a positive value addition by consumers, fueling demand within this niche. Geographical growth is anticipated to be robust across regions like North America and Europe, reflecting the higher level of environmental awareness in these markets.
Reusable Wine Cork Company Market Share
Reusable Wine Cork Market: A Comprehensive Analysis (2019-2033)
This comprehensive report provides an in-depth analysis of the global reusable wine cork market, offering valuable insights for industry stakeholders, investors, and strategic decision-makers. The study covers the period from 2019 to 2033, with a focus on the forecast period of 2025-2033 and a base year of 2025. The report projects a market size exceeding $XX million by 2033, driven by several key factors analyzed within. This report utilizes data from the historical period (2019-2024) to establish robust forecasting models.
Reusable Wine Cork Market Concentration & Innovation
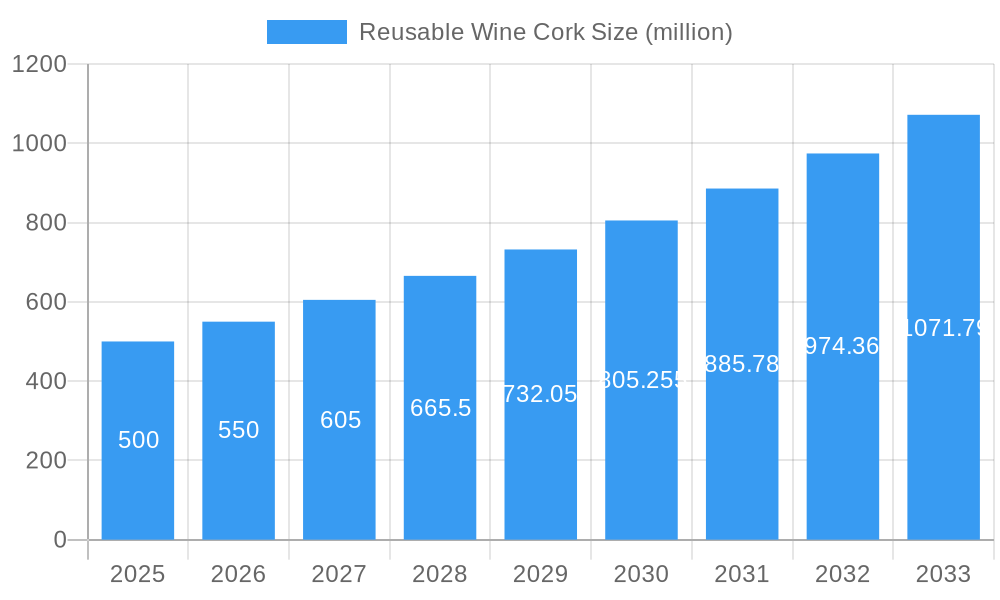
The global reusable wine cork market exhibits a moderately concentrated structure. Major players like Amorim Cork, S.A., Ltd., Jelinek Cork Group, and M.A. Silva Usa, Llc., hold significant market share, estimated collectively at approximately xx%. However, the market also accommodates several smaller players, fostering competition and driving innovation.
- Market Share: Amorim Cork, S.A., Ltd. holds an estimated xx% market share, while Jelinek Cork Group holds approximately xx%. Other key players contribute to the remaining xx%.
- Innovation Drivers: Sustainability concerns and the rising demand for eco-friendly packaging are key innovation drivers. Companies are actively investing in R&D to develop biodegradable, recyclable, and reusable wine cork alternatives.
- Regulatory Frameworks: Government regulations concerning sustainable packaging and waste reduction influence market growth. Stringent environmental regulations in certain regions are accelerating the adoption of reusable wine corks.
- Product Substitutes: Screw caps and synthetic corks pose a significant competitive threat. However, the unique aesthetic appeal and perceived quality associated with reusable wine corks maintain market demand.
- End-User Trends: The growing preference for premium wines and the increasing awareness of environmental issues among consumers are fueling the demand for reusable wine corks.
- M&A Activities: The reusable wine cork industry has witnessed several mergers and acquisitions in recent years, with deal values totaling approximately $XX million between 2019 and 2024. These activities have led to increased market consolidation and enhanced product portfolios.
Reusable Wine Cork Industry Trends & Insights
The global reusable wine cork market is experiencing significant growth, with a projected Compound Annual Growth Rate (CAGR) of xx% during the forecast period (2025-2033). This growth is primarily attributed to increasing consumer preference for eco-friendly products, the rising popularity of wine globally, and technological advancements in cork production. The market penetration rate for reusable wine corks is currently at approximately xx%, expected to reach xx% by 2033. Technological disruptions, such as advancements in cork processing and the development of innovative materials, are further boosting market expansion. Consumer preferences are shifting towards sustainable and high-quality wine closures, making reusable wine corks an attractive alternative to traditional single-use options. The competitive dynamics are characterized by both intense competition among established players and the emergence of new entrants offering innovative products.
Dominant Markets & Segments in Reusable Wine Cork
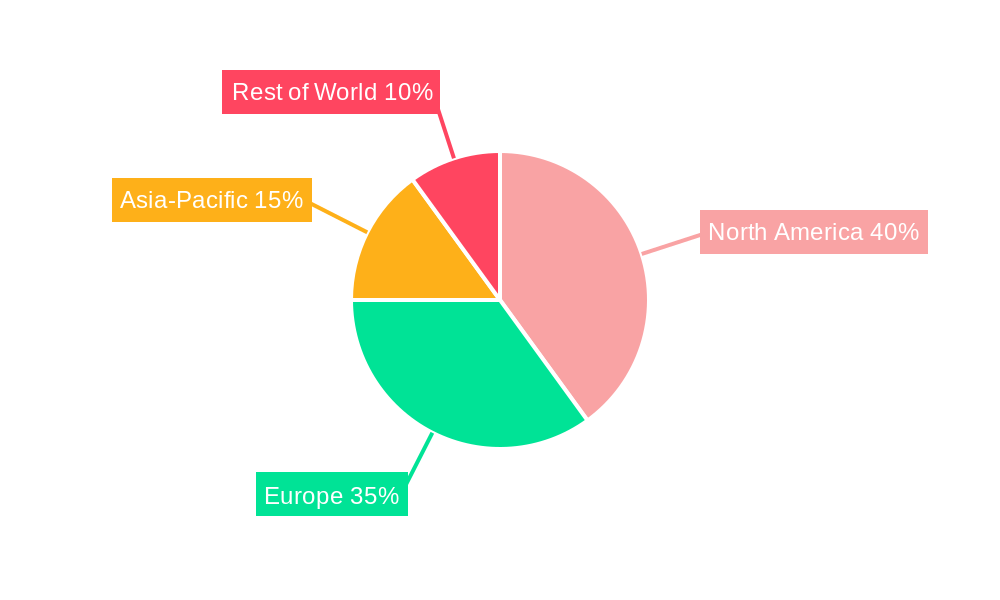
The European region currently dominates the global reusable wine cork market, accounting for approximately xx% of the total market share in 2025. France and Italy are the leading countries within this region.
- Key Drivers in Europe:
- Strong wine production and consumption.
- Well-established cork industry infrastructure.
- Favorable government policies promoting sustainable packaging.
- High consumer awareness of environmental issues.
The dominance of Europe is primarily due to the region's long history of wine production, a well-established cork industry, and increasing consumer preference for sustainable packaging options.
Reusable Wine Cork Product Developments
Recent product innovations in the reusable wine cork market focus on improved durability, enhanced sealing capabilities, and environmentally friendly materials. Technological trends include the development of bio-based coatings to enhance the corks’ lifespan and prevent mold growth. These improvements enhance the overall market fit by addressing consumer concerns related to the functionality and sustainability of reusable corks.
Report Scope & Segmentation Analysis
This report segments the reusable wine cork market based on material type (natural cork, agglomerated cork, etc.), application (wine bottles, spirits bottles, etc.), and region (North America, Europe, Asia-Pacific, etc.). Each segment presents unique growth projections and competitive dynamics. For example, the natural cork segment is projected to hold the largest market share due to its superior quality and aesthetic appeal, while the Asia-Pacific region is anticipated to witness the highest growth rate driven by rising wine consumption.
Key Drivers of Reusable Wine Cork Growth
Several factors are driving the growth of the reusable wine cork market:
- Increasing consumer demand for sustainable packaging: Growing environmental awareness among consumers is propelling the adoption of reusable and eco-friendly alternatives.
- Technological advancements in cork processing: Innovations in processing techniques enhance cork quality and longevity, making reusable corks a more viable option.
- Favorable government regulations: Regulations promoting sustainable packaging are creating a favorable environment for the growth of the reusable wine cork market.
Challenges in the Reusable Wine Cork Sector
The reusable wine cork sector faces several challenges:
- Competition from alternative closures: Screw caps and synthetic corks pose a significant threat, particularly in terms of cost-effectiveness.
- Fluctuations in cork raw material prices: The price of natural cork is subject to variations depending on various factors impacting supply and demand.
- Maintaining consistent product quality: Ensuring the consistent quality and performance of reusable corks across production runs is crucial for maintaining consumer trust.
Emerging Opportunities in Reusable Wine Cork
Emerging opportunities in the reusable wine cork market include:
- Development of innovative materials: Research into new, more sustainable materials for reusable wine corks could open up new avenues for growth.
- Expansion into new markets: The growing wine markets in Asia and other regions provide significant growth potential.
- Focus on premiumization: Positioning reusable wine corks as a premium and sustainable choice for high-end wines could increase market penetration.
Leading Players in the Reusable Wine Cork Market
- Amorim Cork, S.A., Ltd.
- Jelinek Cork Group
- Waterloo Container Company
- J. C. Ribeiro, S. A.
- We Cork Inc.
- Elkem Silicones limited
- Precision Elite limited company
- WidgetCo, Inc.
- Allstates Rubber & Tool Corp
- M.A. Silva Usa, Llc
Key Developments in Reusable Wine Cork Industry
- 2022-Q4: Amorim Cork, S.A., Ltd. launched a new line of sustainable reusable wine corks.
- 2023-Q1: Jelinek Cork Group announced a strategic partnership to expand its distribution network.
- 2024-Q2: Significant investment in R&D by several companies to develop new materials and improve manufacturing processes. (Further details available in the full report)
Strategic Outlook for Reusable Wine Cork Market
The future of the reusable wine cork market looks promising, driven by the increasing demand for sustainable and high-quality wine closures. Continued innovation in materials and production processes, coupled with favorable regulatory environments and growing consumer awareness, will fuel market expansion. The market presents significant opportunities for companies that can successfully position their products as sustainable, high-quality, and cost-effective alternatives to traditional wine closures.
Reusable Wine Cork Segmentation
-
1. Application
- 1.1. Offline
- 1.2. Online
-
2. Types
- 2.1. Natural
- 2.2. Synthetic
Reusable Wine Cork Segmentation By Geography
-
1. North America
- 1.1. United States
- 1.2. Canada
- 1.3. Mexico
-
2. South America
- 2.1. Brazil
- 2.2. Argentina
- 2.3. Rest of South America
-
3. Europe
- 3.1. United Kingdom
- 3.2. Germany
- 3.3. France
- 3.4. Italy
- 3.5. Spain
- 3.6. Russia
- 3.7. Benelux
- 3.8. Nordics
- 3.9. Rest of Europe
-
4. Middle East & Africa
- 4.1. Turkey
- 4.2. Israel
- 4.3. GCC
- 4.4. North Africa
- 4.5. South Africa
- 4.6. Rest of Middle East & Africa
-
5. Asia Pacific
- 5.1. China
- 5.2. India
- 5.3. Japan
- 5.4. South Korea
- 5.5. ASEAN
- 5.6. Oceania
- 5.7. Rest of Asia Pacific
Reusable Wine Cork Regional Market Share
Geographic Coverage of Reusable Wine Cork
Reusable Wine Cork REPORT HIGHLIGHTS
| Aspects | Details |
|---|---|
| Study Period | 2020-2034 |
| Base Year | 2025 |
| Estimated Year | 2026 |
| Forecast Period | 2026-2034 |
| Historical Period | 2020-2025 |
| Growth Rate | CAGR of XX% from 2020-2034 |
| Segmentation |
|
Table of Contents
- 1. Introduction
- 1.1. Research Scope
- 1.2. Market Segmentation
- 1.3. Research Methodology
- 1.4. Definitions and Assumptions
- 2. Executive Summary
- 2.1. Introduction
- 3. Market Dynamics
- 3.1. Introduction
- 3.2. Market Drivers
- 3.3. Market Restrains
- 3.4. Market Trends
- 4. Market Factor Analysis
- 4.1. Porters Five Forces
- 4.2. Supply/Value Chain
- 4.3. PESTEL analysis
- 4.4. Market Entropy
- 4.5. Patent/Trademark Analysis
- 5. Global Reusable Wine Cork Analysis, Insights and Forecast, 2020-2032
- 5.1. Market Analysis, Insights and Forecast - by Application
- 5.1.1. Offline
- 5.1.2. Online
- 5.2. Market Analysis, Insights and Forecast - by Types
- 5.2.1. Natural
- 5.2.2. Synthetic
- 5.3. Market Analysis, Insights and Forecast - by Region
- 5.3.1. North America
- 5.3.2. South America
- 5.3.3. Europe
- 5.3.4. Middle East & Africa
- 5.3.5. Asia Pacific
- 5.1. Market Analysis, Insights and Forecast - by Application
- 6. North America Reusable Wine Cork Analysis, Insights and Forecast, 2020-2032
- 6.1. Market Analysis, Insights and Forecast - by Application
- 6.1.1. Offline
- 6.1.2. Online
- 6.2. Market Analysis, Insights and Forecast - by Types
- 6.2.1. Natural
- 6.2.2. Synthetic
- 6.1. Market Analysis, Insights and Forecast - by Application
- 7. South America Reusable Wine Cork Analysis, Insights and Forecast, 2020-2032
- 7.1. Market Analysis, Insights and Forecast - by Application
- 7.1.1. Offline
- 7.1.2. Online
- 7.2. Market Analysis, Insights and Forecast - by Types
- 7.2.1. Natural
- 7.2.2. Synthetic
- 7.1. Market Analysis, Insights and Forecast - by Application
- 8. Europe Reusable Wine Cork Analysis, Insights and Forecast, 2020-2032
- 8.1. Market Analysis, Insights and Forecast - by Application
- 8.1.1. Offline
- 8.1.2. Online
- 8.2. Market Analysis, Insights and Forecast - by Types
- 8.2.1. Natural
- 8.2.2. Synthetic
- 8.1. Market Analysis, Insights and Forecast - by Application
- 9. Middle East & Africa Reusable Wine Cork Analysis, Insights and Forecast, 2020-2032
- 9.1. Market Analysis, Insights and Forecast - by Application
- 9.1.1. Offline
- 9.1.2. Online
- 9.2. Market Analysis, Insights and Forecast - by Types
- 9.2.1. Natural
- 9.2.2. Synthetic
- 9.1. Market Analysis, Insights and Forecast - by Application
- 10. Asia Pacific Reusable Wine Cork Analysis, Insights and Forecast, 2020-2032
- 10.1. Market Analysis, Insights and Forecast - by Application
- 10.1.1. Offline
- 10.1.2. Online
- 10.2. Market Analysis, Insights and Forecast - by Types
- 10.2.1. Natural
- 10.2.2. Synthetic
- 10.1. Market Analysis, Insights and Forecast - by Application
- 11. Competitive Analysis
- 11.1. Global Market Share Analysis 2025
- 11.2. Company Profiles
- 11.2.1 Amorim Cork
- 11.2.1.1. Overview
- 11.2.1.2. Products
- 11.2.1.3. SWOT Analysis
- 11.2.1.4. Recent Developments
- 11.2.1.5. Financials (Based on Availability)
- 11.2.2 S.A
- 11.2.2.1. Overview
- 11.2.2.2. Products
- 11.2.2.3. SWOT Analysis
- 11.2.2.4. Recent Developments
- 11.2.2.5. Financials (Based on Availability)
- 11.2.3 Ltd.
- 11.2.3.1. Overview
- 11.2.3.2. Products
- 11.2.3.3. SWOT Analysis
- 11.2.3.4. Recent Developments
- 11.2.3.5. Financials (Based on Availability)
- 11.2.4 Jelinek Cork Group
- 11.2.4.1. Overview
- 11.2.4.2. Products
- 11.2.4.3. SWOT Analysis
- 11.2.4.4. Recent Developments
- 11.2.4.5. Financials (Based on Availability)
- 11.2.5 Waterloo Container Company
- 11.2.5.1. Overview
- 11.2.5.2. Products
- 11.2.5.3. SWOT Analysis
- 11.2.5.4. Recent Developments
- 11.2.5.5. Financials (Based on Availability)
- 11.2.6 J. C. Ribeiro
- 11.2.6.1. Overview
- 11.2.6.2. Products
- 11.2.6.3. SWOT Analysis
- 11.2.6.4. Recent Developments
- 11.2.6.5. Financials (Based on Availability)
- 11.2.7 S. A.
- 11.2.7.1. Overview
- 11.2.7.2. Products
- 11.2.7.3. SWOT Analysis
- 11.2.7.4. Recent Developments
- 11.2.7.5. Financials (Based on Availability)
- 11.2.8 We Cork Inc.
- 11.2.8.1. Overview
- 11.2.8.2. Products
- 11.2.8.3. SWOT Analysis
- 11.2.8.4. Recent Developments
- 11.2.8.5. Financials (Based on Availability)
- 11.2.9 Elkem Silicones limited
- 11.2.9.1. Overview
- 11.2.9.2. Products
- 11.2.9.3. SWOT Analysis
- 11.2.9.4. Recent Developments
- 11.2.9.5. Financials (Based on Availability)
- 11.2.10 Precision Elite limited company
- 11.2.10.1. Overview
- 11.2.10.2. Products
- 11.2.10.3. SWOT Analysis
- 11.2.10.4. Recent Developments
- 11.2.10.5. Financials (Based on Availability)
- 11.2.11 WidgetCo
- 11.2.11.1. Overview
- 11.2.11.2. Products
- 11.2.11.3. SWOT Analysis
- 11.2.11.4. Recent Developments
- 11.2.11.5. Financials (Based on Availability)
- 11.2.12 Inc.
- 11.2.12.1. Overview
- 11.2.12.2. Products
- 11.2.12.3. SWOT Analysis
- 11.2.12.4. Recent Developments
- 11.2.12.5. Financials (Based on Availability)
- 11.2.13 Allstates Rubber & Tool Corp
- 11.2.13.1. Overview
- 11.2.13.2. Products
- 11.2.13.3. SWOT Analysis
- 11.2.13.4. Recent Developments
- 11.2.13.5. Financials (Based on Availability)
- 11.2.14 M.A. Silva Usa
- 11.2.14.1. Overview
- 11.2.14.2. Products
- 11.2.14.3. SWOT Analysis
- 11.2.14.4. Recent Developments
- 11.2.14.5. Financials (Based on Availability)
- 11.2.15 Llc
- 11.2.15.1. Overview
- 11.2.15.2. Products
- 11.2.15.3. SWOT Analysis
- 11.2.15.4. Recent Developments
- 11.2.15.5. Financials (Based on Availability)
- 11.2.1 Amorim Cork
List of Figures
- Figure 1: Global Reusable Wine Cork Revenue Breakdown (million, %) by Region 2025 & 2033
- Figure 2: North America Reusable Wine Cork Revenue (million), by Application 2025 & 2033
- Figure 3: North America Reusable Wine Cork Revenue Share (%), by Application 2025 & 2033
- Figure 4: North America Reusable Wine Cork Revenue (million), by Types 2025 & 2033
- Figure 5: North America Reusable Wine Cork Revenue Share (%), by Types 2025 & 2033
- Figure 6: North America Reusable Wine Cork Revenue (million), by Country 2025 & 2033
- Figure 7: North America Reusable Wine Cork Revenue Share (%), by Country 2025 & 2033
- Figure 8: South America Reusable Wine Cork Revenue (million), by Application 2025 & 2033
- Figure 9: South America Reusable Wine Cork Revenue Share (%), by Application 2025 & 2033
- Figure 10: South America Reusable Wine Cork Revenue (million), by Types 2025 & 2033
- Figure 11: South America Reusable Wine Cork Revenue Share (%), by Types 2025 & 2033
- Figure 12: South America Reusable Wine Cork Revenue (million), by Country 2025 & 2033
- Figure 13: South America Reusable Wine Cork Revenue Share (%), by Country 2025 & 2033
- Figure 14: Europe Reusable Wine Cork Revenue (million), by Application 2025 & 2033
- Figure 15: Europe Reusable Wine Cork Revenue Share (%), by Application 2025 & 2033
- Figure 16: Europe Reusable Wine Cork Revenue (million), by Types 2025 & 2033
- Figure 17: Europe Reusable Wine Cork Revenue Share (%), by Types 2025 & 2033
- Figure 18: Europe Reusable Wine Cork Revenue (million), by Country 2025 & 2033
- Figure 19: Europe Reusable Wine Cork Revenue Share (%), by Country 2025 & 2033
- Figure 20: Middle East & Africa Reusable Wine Cork Revenue (million), by Application 2025 & 2033
- Figure 21: Middle East & Africa Reusable Wine Cork Revenue Share (%), by Application 2025 & 2033
- Figure 22: Middle East & Africa Reusable Wine Cork Revenue (million), by Types 2025 & 2033
- Figure 23: Middle East & Africa Reusable Wine Cork Revenue Share (%), by Types 2025 & 2033
- Figure 24: Middle East & Africa Reusable Wine Cork Revenue (million), by Country 2025 & 2033
- Figure 25: Middle East & Africa Reusable Wine Cork Revenue Share (%), by Country 2025 & 2033
- Figure 26: Asia Pacific Reusable Wine Cork Revenue (million), by Application 2025 & 2033
- Figure 27: Asia Pacific Reusable Wine Cork Revenue Share (%), by Application 2025 & 2033
- Figure 28: Asia Pacific Reusable Wine Cork Revenue (million), by Types 2025 & 2033
- Figure 29: Asia Pacific Reusable Wine Cork Revenue Share (%), by Types 2025 & 2033
- Figure 30: Asia Pacific Reusable Wine Cork Revenue (million), by Country 2025 & 2033
- Figure 31: Asia Pacific Reusable Wine Cork Revenue Share (%), by Country 2025 & 2033
List of Tables
- Table 1: Global Reusable Wine Cork Revenue million Forecast, by Application 2020 & 2033
- Table 2: Global Reusable Wine Cork Revenue million Forecast, by Types 2020 & 2033
- Table 3: Global Reusable Wine Cork Revenue million Forecast, by Region 2020 & 2033
- Table 4: Global Reusable Wine Cork Revenue million Forecast, by Application 2020 & 2033
- Table 5: Global Reusable Wine Cork Revenue million Forecast, by Types 2020 & 2033
- Table 6: Global Reusable Wine Cork Revenue million Forecast, by Country 2020 & 2033
- Table 7: United States Reusable Wine Cork Revenue (million) Forecast, by Application 2020 & 2033
- Table 8: Canada Reusable Wine Cork Revenue (million) Forecast, by Application 2020 & 2033
- Table 9: Mexico Reusable Wine Cork Revenue (million) Forecast, by Application 2020 & 2033
- Table 10: Global Reusable Wine Cork Revenue million Forecast, by Application 2020 & 2033
- Table 11: Global Reusable Wine Cork Revenue million Forecast, by Types 2020 & 2033
- Table 12: Global Reusable Wine Cork Revenue million Forecast, by Country 2020 & 2033
- Table 13: Brazil Reusable Wine Cork Revenue (million) Forecast, by Application 2020 & 2033
- Table 14: Argentina Reusable Wine Cork Revenue (million) Forecast, by Application 2020 & 2033
- Table 15: Rest of South America Reusable Wine Cork Revenue (million) Forecast, by Application 2020 & 2033
- Table 16: Global Reusable Wine Cork Revenue million Forecast, by Application 2020 & 2033
- Table 17: Global Reusable Wine Cork Revenue million Forecast, by Types 2020 & 2033
- Table 18: Global Reusable Wine Cork Revenue million Forecast, by Country 2020 & 2033
- Table 19: United Kingdom Reusable Wine Cork Revenue (million) Forecast, by Application 2020 & 2033
- Table 20: Germany Reusable Wine Cork Revenue (million) Forecast, by Application 2020 & 2033
- Table 21: France Reusable Wine Cork Revenue (million) Forecast, by Application 2020 & 2033
- Table 22: Italy Reusable Wine Cork Revenue (million) Forecast, by Application 2020 & 2033
- Table 23: Spain Reusable Wine Cork Revenue (million) Forecast, by Application 2020 & 2033
- Table 24: Russia Reusable Wine Cork Revenue (million) Forecast, by Application 2020 & 2033
- Table 25: Benelux Reusable Wine Cork Revenue (million) Forecast, by Application 2020 & 2033
- Table 26: Nordics Reusable Wine Cork Revenue (million) Forecast, by Application 2020 & 2033
- Table 27: Rest of Europe Reusable Wine Cork Revenue (million) Forecast, by Application 2020 & 2033
- Table 28: Global Reusable Wine Cork Revenue million Forecast, by Application 2020 & 2033
- Table 29: Global Reusable Wine Cork Revenue million Forecast, by Types 2020 & 2033
- Table 30: Global Reusable Wine Cork Revenue million Forecast, by Country 2020 & 2033
- Table 31: Turkey Reusable Wine Cork Revenue (million) Forecast, by Application 2020 & 2033
- Table 32: Israel Reusable Wine Cork Revenue (million) Forecast, by Application 2020 & 2033
- Table 33: GCC Reusable Wine Cork Revenue (million) Forecast, by Application 2020 & 2033
- Table 34: North Africa Reusable Wine Cork Revenue (million) Forecast, by Application 2020 & 2033
- Table 35: South Africa Reusable Wine Cork Revenue (million) Forecast, by Application 2020 & 2033
- Table 36: Rest of Middle East & Africa Reusable Wine Cork Revenue (million) Forecast, by Application 2020 & 2033
- Table 37: Global Reusable Wine Cork Revenue million Forecast, by Application 2020 & 2033
- Table 38: Global Reusable Wine Cork Revenue million Forecast, by Types 2020 & 2033
- Table 39: Global Reusable Wine Cork Revenue million Forecast, by Country 2020 & 2033
- Table 40: China Reusable Wine Cork Revenue (million) Forecast, by Application 2020 & 2033
- Table 41: India Reusable Wine Cork Revenue (million) Forecast, by Application 2020 & 2033
- Table 42: Japan Reusable Wine Cork Revenue (million) Forecast, by Application 2020 & 2033
- Table 43: South Korea Reusable Wine Cork Revenue (million) Forecast, by Application 2020 & 2033
- Table 44: ASEAN Reusable Wine Cork Revenue (million) Forecast, by Application 2020 & 2033
- Table 45: Oceania Reusable Wine Cork Revenue (million) Forecast, by Application 2020 & 2033
- Table 46: Rest of Asia Pacific Reusable Wine Cork Revenue (million) Forecast, by Application 2020 & 2033
Frequently Asked Questions
1. What is the projected Compound Annual Growth Rate (CAGR) of the Reusable Wine Cork?
The projected CAGR is approximately XX%.
2. Which companies are prominent players in the Reusable Wine Cork?
Key companies in the market include Amorim Cork, S.A, Ltd., Jelinek Cork Group, Waterloo Container Company, J. C. Ribeiro, S. A., We Cork Inc., Elkem Silicones limited, Precision Elite limited company, WidgetCo, Inc., Allstates Rubber & Tool Corp, M.A. Silva Usa, Llc.
3. What are the main segments of the Reusable Wine Cork?
The market segments include Application, Types.
4. Can you provide details about the market size?
The market size is estimated to be USD XXX million as of 2022.
5. What are some drivers contributing to market growth?
N/A
6. What are the notable trends driving market growth?
N/A
7. Are there any restraints impacting market growth?
N/A
8. Can you provide examples of recent developments in the market?
N/A
9. What pricing options are available for accessing the report?
Pricing options include single-user, multi-user, and enterprise licenses priced at USD 2900.00, USD 4350.00, and USD 5800.00 respectively.
10. Is the market size provided in terms of value or volume?
The market size is provided in terms of value, measured in million.
11. Are there any specific market keywords associated with the report?
Yes, the market keyword associated with the report is "Reusable Wine Cork," which aids in identifying and referencing the specific market segment covered.
12. How do I determine which pricing option suits my needs best?
The pricing options vary based on user requirements and access needs. Individual users may opt for single-user licenses, while businesses requiring broader access may choose multi-user or enterprise licenses for cost-effective access to the report.
13. Are there any additional resources or data provided in the Reusable Wine Cork report?
While the report offers comprehensive insights, it's advisable to review the specific contents or supplementary materials provided to ascertain if additional resources or data are available.
14. How can I stay updated on further developments or reports in the Reusable Wine Cork?
To stay informed about further developments, trends, and reports in the Reusable Wine Cork, consider subscribing to industry newsletters, following relevant companies and organizations, or regularly checking reputable industry news sources and publications.
Methodology
Step 1 - Identification of Relevant Samples Size from Population Database


Step 2 - Approaches for Defining Global Market Size (Value, Volume* & Price*)

Note*: In applicable scenarios
Step 3 - Data Sources
Primary Research
- Web Analytics
- Survey Reports
- Research Institute
- Latest Research Reports
- Opinion Leaders
Secondary Research
- Annual Reports
- White Paper
- Latest Press Release
- Industry Association
- Paid Database
- Investor Presentations

Step 4 - Data Triangulation
Involves using different sources of information in order to increase the validity of a study
These sources are likely to be stakeholders in a program - participants, other researchers, program staff, other community members, and so on.
Then we put all data in single framework & apply various statistical tools to find out the dynamic on the market.
During the analysis stage, feedback from the stakeholder groups would be compared to determine areas of agreement as well as areas of divergence