Key Insights
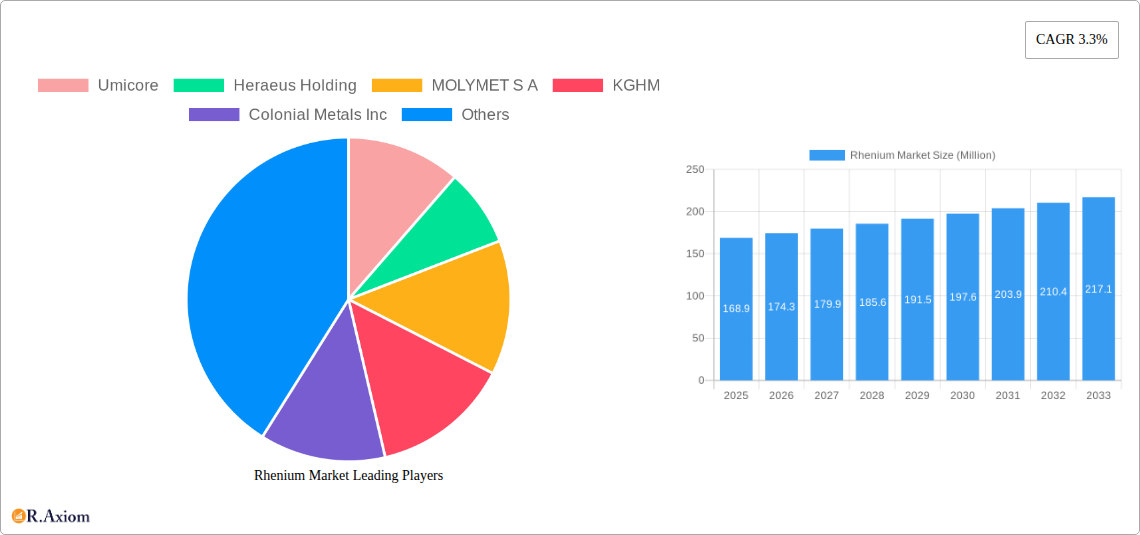
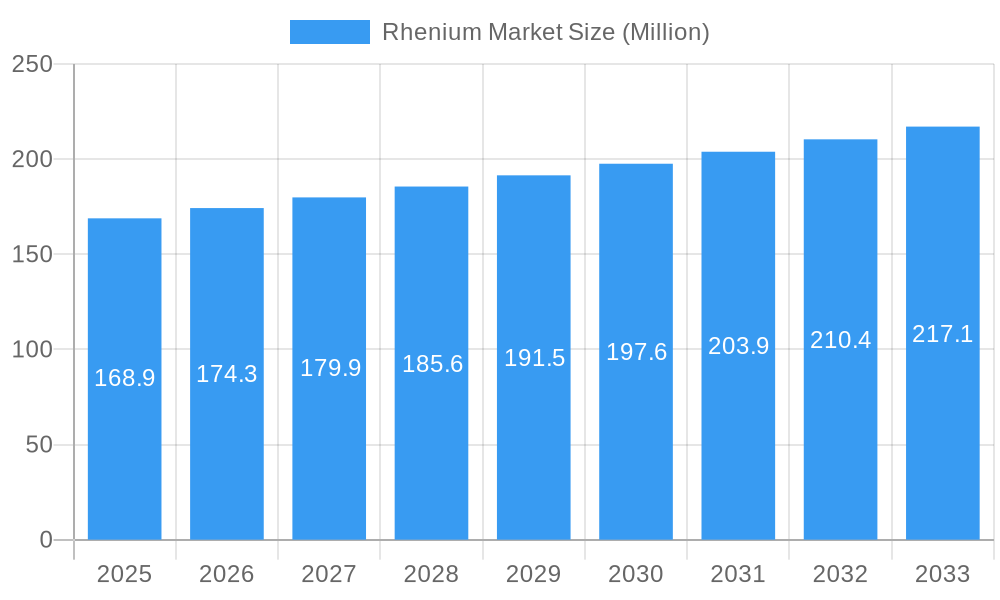
The global Rhenium market is poised for steady growth, projected to reach $168.9 million by 2025, with an anticipated Compound Annual Growth Rate (CAGR) of 3.3% through 2033. This expansion is primarily driven by the critical role of rhenium in high-performance superalloys, essential for the aerospace and industrial gas turbine sectors. The inherent properties of rhenium, such as its extremely high melting point and exceptional strength at elevated temperatures, make it indispensable for jet engine components and power generation turbines. Demand is also bolstered by its application as a catalyst, particularly in the petrochemical industry for catalytic reforming processes that produce high-octane gasoline. Emerging applications in healthcare, such as in medical imaging, are beginning to contribute to market diversification.
Rhenium Market Market Size (In Million)
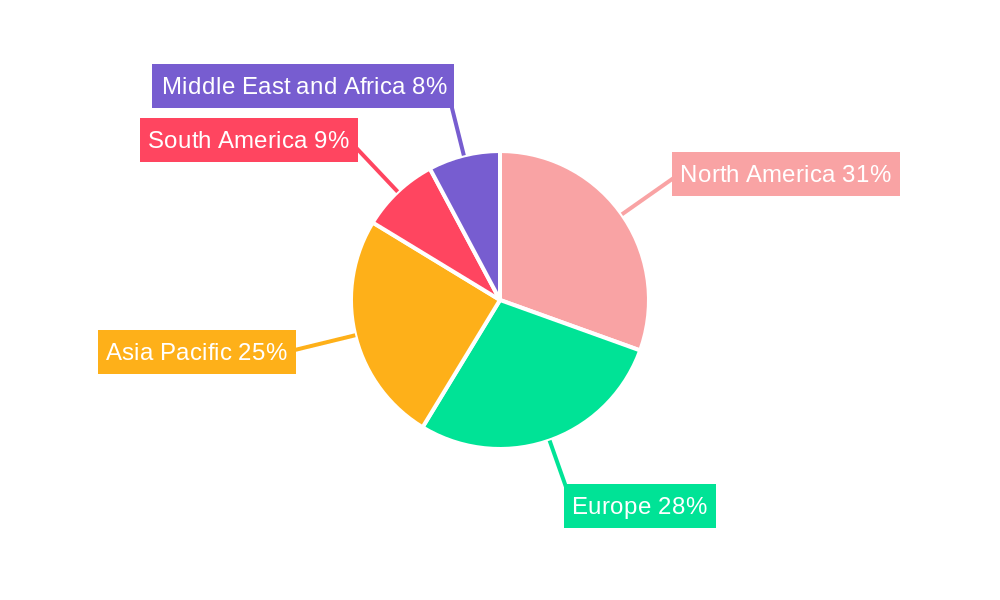
The market landscape is characterized by a concentration of key players, including Umicore, Heraeus Holding, and Molymet S.A., who are instrumental in the supply chain and technological advancements. Restraints to growth may include the high cost and limited availability of primary rhenium sources, often a byproduct of copper and molybdenum mining. However, increasing recycling efforts and the development of more efficient extraction methods are expected to mitigate these challenges. Geographically, North America and Europe are significant markets due to the established aerospace and industrial sectors, while Asia Pacific presents substantial growth potential driven by increasing industrialization and manufacturing activities. Continued innovation in material science and the sustained demand for advanced alloys will be crucial for the sustained trajectory of the rhenium market.
Rhenium Market Company Market Share
Rhenium Market Market Concentration & Innovation
The Rhenium market exhibits a moderate level of concentration, with key players like Umicore, Heraeus Holding, and MOLYMET S A holding significant market share, estimated to be over 60% combined. Innovation is a crucial driver, primarily focused on enhancing the performance of rhenium-containing superalloys for aerospace and industrial gas turbines, and optimizing rhenium's catalytic properties in petrochemical processes. Regulatory frameworks, particularly those related to environmental impact and responsible sourcing, are becoming increasingly influential. Product substitutes for rhenium in certain high-temperature applications are limited, reinforcing its strategic importance. End-user trends are leaning towards demand for higher efficiency and longer lifespans in critical components, directly benefiting the superalloys segment. Merger and acquisition activities, while not a dominant feature, are strategically important for companies aiming to secure supply chains and expand technological capabilities. For instance, acquisitions of smaller specialty metal processors or technology firms could enhance market share. The overall M&A deal value in the historical period (2019-2024) is estimated to be in the range of tens of millions of dollars, with future potential for larger strategic consolidations.
Rhenium Market Industry Trends & Insights
The global Rhenium market is poised for substantial growth, driven by escalating demand across its core applications, particularly superalloys and catalysts. The market is projected to witness a Compound Annual Growth Rate (CAGR) of approximately 5.5% during the forecast period of 2025–2033. This robust expansion is fueled by the resurgence of the aerospace industry post-pandemic, with a surge in aircraft manufacturing and maintenance activities directly translating to increased demand for high-performance superalloys containing rhenium. Similarly, the industrial gas turbine sector is experiencing significant investment driven by the global push for energy efficiency and the transition to cleaner energy sources, where rhenium alloys are critical for turbine blade longevity and performance.
Technological disruptions are playing a pivotal role, with ongoing research and development focused on improving the extraction and recycling of rhenium, thereby addressing supply chain vulnerabilities and cost pressures. Advancements in additive manufacturing are also creating new avenues for the application of rhenium-based alloys, enabling the production of complex geometries with superior material properties. Consumer preferences are increasingly geared towards products that offer enhanced durability, fuel efficiency, and reduced environmental impact. This translates into a higher demand for advanced materials in the automotive sector for engine components and in healthcare for specialized medical devices, though these segments represent a smaller market penetration compared to aerospace.
Competitive dynamics are characterized by a blend of established global suppliers and emerging niche players. Companies are strategically investing in R&D to develop proprietary alloys and optimize production processes. The market penetration of rhenium in nascent applications like advanced electronics is still in its early stages, presenting significant future growth potential. The overall market size in the base year 2025 is estimated to be around 70 Million, with projections to reach over 100 Million by 2033.
Dominant Markets & Segments in Rhenium Market
The Aerospace end-user industry stands as the dominant force in the Rhenium market, driven by the irreplaceable properties of rhenium-containing superalloys in jet engines and other critical aircraft components. This segment's dominance is underscored by the stringent performance requirements and high-value nature of aerospace applications. Economic policies favoring defense spending and infrastructure development, coupled with a steady increase in global air travel, directly contribute to the sustained demand from this sector.
- Key Drivers for Aerospace Dominance:
- High Temperature Strength and Creep Resistance: Rhenium alloys offer unparalleled performance at extreme temperatures, essential for jet engine efficiency and longevity.
- Growth in Aircraft Manufacturing and MRO: Increased production of new aircraft and the ongoing maintenance, repair, and overhaul (MRO) activities for existing fleets significantly boost rhenium consumption.
- Advancements in Engine Technology: Development of more fuel-efficient and powerful engines necessitates the use of advanced materials like those containing rhenium.
The Superalloys application segment is intrinsically linked to the aerospace and industrial gas turbine industries, representing the largest share of rhenium consumption. The inherent metallurgical benefits of adding rhenium to nickel-based superalloys, such as improved high-temperature strength, oxidation resistance, and creep rupture life, make them indispensable.
- Key Drivers for Superalloy Dominance:
- Critical Component Manufacturing: Superalloys are vital for turbine blades, discs, and other high-stress components in engines.
- Demand for Enhanced Performance: Industries continually seek materials that can withstand higher operating temperatures and pressures for improved efficiency and reduced emissions.
Geographically, North America and Europe are the dominant markets due to the presence of major aerospace manufacturers, industrial gas turbine producers, and advanced research institutions. The United States, in particular, holds a significant share due to its robust defense sector and leading aerospace companies.
- Dominance Analysis: The combined market share of North America and Europe in the Rhenium market is estimated to be over 65% in the base year 2025. The Asia-Pacific region, however, is witnessing the fastest growth, driven by the expanding aerospace and industrial manufacturing sectors in countries like China and India. The market size for Superalloys application is projected to reach approximately 50 Million in 2025, while the Aerospace end-user industry's contribution is estimated at around 45 Million.
Rhenium Market Product Developments
Product developments in the Rhenium market are primarily centered on enhancing the performance and applicability of rhenium-based superalloys and catalysts. Innovations focus on increasing the temperature capabilities and oxidation resistance of alloys used in next-generation jet engines and industrial gas turbines. Furthermore, advancements in catalytic converters for automotive emissions control and petrochemical processes are being explored. These developments aim to improve efficiency, reduce environmental impact, and extend the lifespan of critical components, providing a competitive advantage to companies investing in R&D. The market fit for these advanced materials remains strong due to their unique properties.
Report Scope & Segmentation Analysis
This report provides a comprehensive analysis of the Rhenium market, segmenting it across key applications and end-user industries.
Application Segmentation:
- Superalloys: This segment is projected to hold the largest market share, estimated at 50 Million in 2025, driven by demand from aerospace and industrial gas turbines. Its growth is expected to continue at a healthy pace, with a projected market size exceeding 75 Million by 2033.
- Catalysts: This segment, including petrochemical catalysts and catalytic converters for automotive, is estimated at 15 Million in 2025, with a forecast to reach 25 Million by 2033, driven by environmental regulations and the petrochemical industry's growth.
- Other Applications: This encompasses niche uses in electronics, medical equipment, and scientific research. It is estimated at 5 Million in 2025 and projected to grow to 10 Million by 2033.
End-User Industry Segmentation:
- Aerospace: The dominant end-user industry, estimated at 45 Million in 2025, with significant growth prospects driven by aircraft production and modernization.
- Industrial Gas Turbines: A key growth driver, estimated at 20 Million in 2025, fueled by energy efficiency initiatives and power generation needs.
- Automotive: A growing segment, especially with stricter emission standards, estimated at 5 Million in 2025, with potential for increased penetration in high-performance vehicles.
- Healthcare: Niche applications in medical imaging and implants, estimated at 2 Million in 2025, with steady but slower growth.
- Other End-user Industries: This includes defense, electronics, and research, contributing an estimated 5 Million in 2025.
Key Drivers of Rhenium Market Growth
The Rhenium market's growth is primarily propelled by several interconnected factors. The insatiable demand for high-performance materials in the aerospace industry remains a cornerstone, driven by the need for more fuel-efficient and powerful jet engines. Similarly, the industrial gas turbine sector is experiencing robust growth, necessitating rhenium-based alloys for enhanced durability and operational efficiency in power generation. Furthermore, increasing environmental regulations globally are spurring demand for advanced catalytic converters in both automotive and industrial applications, where rhenium plays a crucial role. Technological advancements in material science and recycling technologies are also contributing by improving supply chain efficiency and reducing overall costs.
Challenges in the Rhenium Market Sector
Despite its growth trajectory, the Rhenium market faces significant challenges. The limited global supply of rhenium, primarily a byproduct of molybdenum mining, creates inherent supply chain vulnerabilities and price volatility. Geopolitical factors and the concentration of mining operations in a few regions can exacerbate these issues. High extraction and processing costs also contribute to the premium pricing of rhenium, potentially limiting its adoption in cost-sensitive applications. Furthermore, stringent environmental regulations associated with mining and refining processes can add to operational expenses and complexity. The availability of substitutes, though currently limited, poses a long-term threat as research into alternative high-temperature materials continues.
Emerging Opportunities in Rhenium Market
Emerging opportunities in the Rhenium market lie in the expansion of additive manufacturing for aerospace components, enabling the creation of complex rhenium-alloy parts with improved performance characteristics. The increasing focus on sustainable aviation fuels and next-generation aircraft designs will further drive demand for advanced superalloys. Moreover, the growing emphasis on energy efficiency in industrial processes and power generation presents opportunities for enhanced industrial gas turbine performance through rhenium alloys. The development of advanced catalytic converters for stricter emission standards in the automotive sector also offers significant untapped potential. Furthermore, advancements in rhenium recycling technologies present an opportunity to mitigate supply chain constraints and reduce the environmental footprint.
Leading Players in the Rhenium Market Market
- Umicore
- Heraeus Holding
- MOLYMET S A
- KGHM
- Colonial Metals Inc
- Höganäs AB
- American Elements
- NEO
- H Cross Company
- Buss & Buss Spezialmetalle GmbH
- Rhenium Alloys Inc
Key Developments in Rhenium Market Industry
- 2023 Q4: Umicore announced significant investment in enhancing its rhenium recycling capabilities, aiming to improve supply chain sustainability.
- 2024 Q1: Heraeus Holding showcased new rhenium alloy formulations designed for higher temperature applications in industrial gas turbines at a major industry conference.
- 2024 Q2: MOLYMET S A reported increased production output from its Chilean operations, addressing growing global demand for rhenium.
- 2024 Q3: KGHM announced the successful implementation of advanced extraction techniques to optimize rhenium recovery from its copper mining operations.
- 2024 Q4: Several smaller players, including Rhenium Alloys Inc, reported increased order volumes for specialized rhenium products from the aerospace sector.
Strategic Outlook for Rhenium Market Market
The strategic outlook for the Rhenium market is characterized by sustained growth, driven by the critical role of rhenium in high-performance applications. The increasing focus on energy efficiency, reduced emissions, and advanced aerospace technology will continue to be primary growth catalysts. Companies that can effectively manage supply chain complexities, invest in innovative material development, and leverage advancements in recycling technologies are poised for success. The market is expected to see strategic collaborations and potential consolidations aimed at securing raw material access and expanding technological expertise, ensuring a robust future for this indispensable element.
Rhenium Market Segmentation
-
1. Application
- 1.1. Superalloys
- 1.2. Catalysts
- 1.3. Other Applications
-
2. End-User Industry
- 2.1. Aerospace
- 2.2. Industrial Gas Turbines
- 2.3. Automotive
- 2.4. Healthcare
- 2.5. Other End-user Industries
Rhenium Market Segmentation By Geography
-
1. Asia Pacific
- 1.1. China
- 1.2. India
- 1.3. Japan
- 1.4. South Korea
- 1.5. Rest of Asia Pacific
-
2. North America
- 2.1. United States
- 2.2. Canada
- 2.3. Mexico
-
3. Europe
- 3.1. Germany
- 3.2. United Kingdom
- 3.3. France
- 3.4. Italy
- 3.5. Rest of Europe
-
4. South America
- 4.1. Brazil
- 4.2. Argentina
- 4.3. Rest of South America
-
5. Middle East and Africa
- 5.1. Saudi Arabia
- 5.2. South Africa
- 5.3. Rest of Middle East and Africa
Rhenium Market Regional Market Share
Geographic Coverage of Rhenium Market
Rhenium Market REPORT HIGHLIGHTS
| Aspects | Details |
|---|---|
| Study Period | 2020-2034 |
| Base Year | 2025 |
| Estimated Year | 2026 |
| Forecast Period | 2026-2034 |
| Historical Period | 2020-2025 |
| Growth Rate | CAGR of 3.3% from 2020-2034 |
| Segmentation |
|
Table of Contents
- 1. Introduction
- 1.1. Research Scope
- 1.2. Market Segmentation
- 1.3. Research Objective
- 1.4. Definitions and Assumptions
- 2. Executive Summary
- 2.1. Market Snapshot
- 3. Market Dynamics
- 3.1. Market Drivers
- 3.2. Market Restrains
- 3.3. Market Trends
- 3.4. Market Opportunities
- 4. Market Factor Analysis
- 4.1. Porters Five Forces
- 4.1.1. Bargaining Power of Suppliers
- 4.1.2. Bargaining Power of Buyers
- 4.1.3. Threat of New Entrants
- 4.1.4. Threat of Substitutes
- 4.1.5. Competitive Rivalry
- 4.2. PESTEL analysis
- 4.3. BCG Analysis
- 4.3.1. Stars (High Growth, High Market Share)
- 4.3.2. Cash Cows (Low Growth, High Market Share)
- 4.3.3. Question Mark (High Growth, Low Market Share)
- 4.3.4. Dogs (Low Growth, Low Market Share)
- 4.4. Ansoff Matrix Analysis
- 4.5. Supply Chain Analysis
- 4.6. Regulatory Landscape
- 4.7. Current Market Potential and Opportunity Assessment (TAM–SAM–SOM Framework)
- 4.8. RAX Analyst Note
- 4.1. Porters Five Forces
- 5. Market Analysis, Insights and Forecast 2021-2033
- 5.1. Market Analysis, Insights and Forecast - by Application
- 5.1.1. Superalloys
- 5.1.2. Catalysts
- 5.1.3. Other Applications
- 5.2. Market Analysis, Insights and Forecast - by End-User Industry
- 5.2.1. Aerospace
- 5.2.2. Industrial Gas Turbines
- 5.2.3. Automotive
- 5.2.4. Healthcare
- 5.2.5. Other End-user Industries
- 5.3. Market Analysis, Insights and Forecast - by Region
- 5.3.1. Asia Pacific
- 5.3.2. North America
- 5.3.3. Europe
- 5.3.4. South America
- 5.3.5. Middle East and Africa
- 5.1. Market Analysis, Insights and Forecast - by Application
- 6. Global Rhenium Market Analysis, Insights and Forecast, 2021-2033
- 6.1. Market Analysis, Insights and Forecast - by Application
- 6.1.1. Superalloys
- 6.1.2. Catalysts
- 6.1.3. Other Applications
- 6.2. Market Analysis, Insights and Forecast - by End-User Industry
- 6.2.1. Aerospace
- 6.2.2. Industrial Gas Turbines
- 6.2.3. Automotive
- 6.2.4. Healthcare
- 6.2.5. Other End-user Industries
- 6.1. Market Analysis, Insights and Forecast - by Application
- 7. Asia Pacific Rhenium Market Analysis, Insights and Forecast, 2020-2032
- 7.1. Market Analysis, Insights and Forecast - by Application
- 7.1.1. Superalloys
- 7.1.2. Catalysts
- 7.1.3. Other Applications
- 7.2. Market Analysis, Insights and Forecast - by End-User Industry
- 7.2.1. Aerospace
- 7.2.2. Industrial Gas Turbines
- 7.2.3. Automotive
- 7.2.4. Healthcare
- 7.2.5. Other End-user Industries
- 7.1. Market Analysis, Insights and Forecast - by Application
- 8. North America Rhenium Market Analysis, Insights and Forecast, 2020-2032
- 8.1. Market Analysis, Insights and Forecast - by Application
- 8.1.1. Superalloys
- 8.1.2. Catalysts
- 8.1.3. Other Applications
- 8.2. Market Analysis, Insights and Forecast - by End-User Industry
- 8.2.1. Aerospace
- 8.2.2. Industrial Gas Turbines
- 8.2.3. Automotive
- 8.2.4. Healthcare
- 8.2.5. Other End-user Industries
- 8.1. Market Analysis, Insights and Forecast - by Application
- 9. Europe Rhenium Market Analysis, Insights and Forecast, 2020-2032
- 9.1. Market Analysis, Insights and Forecast - by Application
- 9.1.1. Superalloys
- 9.1.2. Catalysts
- 9.1.3. Other Applications
- 9.2. Market Analysis, Insights and Forecast - by End-User Industry
- 9.2.1. Aerospace
- 9.2.2. Industrial Gas Turbines
- 9.2.3. Automotive
- 9.2.4. Healthcare
- 9.2.5. Other End-user Industries
- 9.1. Market Analysis, Insights and Forecast - by Application
- 10. South America Rhenium Market Analysis, Insights and Forecast, 2020-2032
- 10.1. Market Analysis, Insights and Forecast - by Application
- 10.1.1. Superalloys
- 10.1.2. Catalysts
- 10.1.3. Other Applications
- 10.2. Market Analysis, Insights and Forecast - by End-User Industry
- 10.2.1. Aerospace
- 10.2.2. Industrial Gas Turbines
- 10.2.3. Automotive
- 10.2.4. Healthcare
- 10.2.5. Other End-user Industries
- 10.1. Market Analysis, Insights and Forecast - by Application
- 11. Middle East and Africa Rhenium Market Analysis, Insights and Forecast, 2020-2032
- 11.1. Market Analysis, Insights and Forecast - by Application
- 11.1.1. Superalloys
- 11.1.2. Catalysts
- 11.1.3. Other Applications
- 11.2. Market Analysis, Insights and Forecast - by End-User Industry
- 11.2.1. Aerospace
- 11.2.2. Industrial Gas Turbines
- 11.2.3. Automotive
- 11.2.4. Healthcare
- 11.2.5. Other End-user Industries
- 11.1. Market Analysis, Insights and Forecast - by Application
- 12. Competitive Analysis
- 12.1. Company Profiles
- 12.1.1 Umicore
- 12.1.1.1. Company Overview
- 12.1.1.2. Products
- 12.1.1.3. Company Financials
- 12.1.1.4. SWOT Analysis
- 12.1.2 Heraeus Holding
- 12.1.2.1. Company Overview
- 12.1.2.2. Products
- 12.1.2.3. Company Financials
- 12.1.2.4. SWOT Analysis
- 12.1.3 MOLYMET S A
- 12.1.3.1. Company Overview
- 12.1.3.2. Products
- 12.1.3.3. Company Financials
- 12.1.3.4. SWOT Analysis
- 12.1.4 KGHM
- 12.1.4.1. Company Overview
- 12.1.4.2. Products
- 12.1.4.3. Company Financials
- 12.1.4.4. SWOT Analysis
- 12.1.5 Colonial Metals Inc
- 12.1.5.1. Company Overview
- 12.1.5.2. Products
- 12.1.5.3. Company Financials
- 12.1.5.4. SWOT Analysis
- 12.1.6 Höganäs AB
- 12.1.6.1. Company Overview
- 12.1.6.2. Products
- 12.1.6.3. Company Financials
- 12.1.6.4. SWOT Analysis
- 12.1.7 American Elements
- 12.1.7.1. Company Overview
- 12.1.7.2. Products
- 12.1.7.3. Company Financials
- 12.1.7.4. SWOT Analysis
- 12.1.8 NEO
- 12.1.8.1. Company Overview
- 12.1.8.2. Products
- 12.1.8.3. Company Financials
- 12.1.8.4. SWOT Analysis
- 12.1.9 H Cross Company
- 12.1.9.1. Company Overview
- 12.1.9.2. Products
- 12.1.9.3. Company Financials
- 12.1.9.4. SWOT Analysis
- 12.1.10 Buss & Buss Spezialmetalle GmbH
- 12.1.10.1. Company Overview
- 12.1.10.2. Products
- 12.1.10.3. Company Financials
- 12.1.10.4. SWOT Analysis
- 12.1.11 Rhenium Alloys Inc
- 12.1.11.1. Company Overview
- 12.1.11.2. Products
- 12.1.11.3. Company Financials
- 12.1.11.4. SWOT Analysis
- 12.1.1 Umicore
- 12.2. Market Entropy
- 12.2.1 Company's Key Areas Served
- 12.2.2 Recent Developments
- 12.3. Company Market Share Analysis 2025
- 12.3.1 Top 5 Companies Market Share Analysis
- 12.3.2 Top 3 Companies Market Share Analysis
- 12.4. List of Potential Customers
- 13. Research Methodology
List of Figures
- Figure 1: Global Rhenium Market Revenue Breakdown (Million, %) by Region 2025 & 2033
- Figure 2: Global Rhenium Market Volume Breakdown (K Tons, %) by Region 2025 & 2033
- Figure 3: Asia Pacific Rhenium Market Revenue (Million), by Application 2025 & 2033
- Figure 4: Asia Pacific Rhenium Market Volume (K Tons), by Application 2025 & 2033
- Figure 5: Asia Pacific Rhenium Market Revenue Share (%), by Application 2025 & 2033
- Figure 6: Asia Pacific Rhenium Market Volume Share (%), by Application 2025 & 2033
- Figure 7: Asia Pacific Rhenium Market Revenue (Million), by End-User Industry 2025 & 2033
- Figure 8: Asia Pacific Rhenium Market Volume (K Tons), by End-User Industry 2025 & 2033
- Figure 9: Asia Pacific Rhenium Market Revenue Share (%), by End-User Industry 2025 & 2033
- Figure 10: Asia Pacific Rhenium Market Volume Share (%), by End-User Industry 2025 & 2033
- Figure 11: Asia Pacific Rhenium Market Revenue (Million), by Country 2025 & 2033
- Figure 12: Asia Pacific Rhenium Market Volume (K Tons), by Country 2025 & 2033
- Figure 13: Asia Pacific Rhenium Market Revenue Share (%), by Country 2025 & 2033
- Figure 14: Asia Pacific Rhenium Market Volume Share (%), by Country 2025 & 2033
- Figure 15: North America Rhenium Market Revenue (Million), by Application 2025 & 2033
- Figure 16: North America Rhenium Market Volume (K Tons), by Application 2025 & 2033
- Figure 17: North America Rhenium Market Revenue Share (%), by Application 2025 & 2033
- Figure 18: North America Rhenium Market Volume Share (%), by Application 2025 & 2033
- Figure 19: North America Rhenium Market Revenue (Million), by End-User Industry 2025 & 2033
- Figure 20: North America Rhenium Market Volume (K Tons), by End-User Industry 2025 & 2033
- Figure 21: North America Rhenium Market Revenue Share (%), by End-User Industry 2025 & 2033
- Figure 22: North America Rhenium Market Volume Share (%), by End-User Industry 2025 & 2033
- Figure 23: North America Rhenium Market Revenue (Million), by Country 2025 & 2033
- Figure 24: North America Rhenium Market Volume (K Tons), by Country 2025 & 2033
- Figure 25: North America Rhenium Market Revenue Share (%), by Country 2025 & 2033
- Figure 26: North America Rhenium Market Volume Share (%), by Country 2025 & 2033
- Figure 27: Europe Rhenium Market Revenue (Million), by Application 2025 & 2033
- Figure 28: Europe Rhenium Market Volume (K Tons), by Application 2025 & 2033
- Figure 29: Europe Rhenium Market Revenue Share (%), by Application 2025 & 2033
- Figure 30: Europe Rhenium Market Volume Share (%), by Application 2025 & 2033
- Figure 31: Europe Rhenium Market Revenue (Million), by End-User Industry 2025 & 2033
- Figure 32: Europe Rhenium Market Volume (K Tons), by End-User Industry 2025 & 2033
- Figure 33: Europe Rhenium Market Revenue Share (%), by End-User Industry 2025 & 2033
- Figure 34: Europe Rhenium Market Volume Share (%), by End-User Industry 2025 & 2033
- Figure 35: Europe Rhenium Market Revenue (Million), by Country 2025 & 2033
- Figure 36: Europe Rhenium Market Volume (K Tons), by Country 2025 & 2033
- Figure 37: Europe Rhenium Market Revenue Share (%), by Country 2025 & 2033
- Figure 38: Europe Rhenium Market Volume Share (%), by Country 2025 & 2033
- Figure 39: South America Rhenium Market Revenue (Million), by Application 2025 & 2033
- Figure 40: South America Rhenium Market Volume (K Tons), by Application 2025 & 2033
- Figure 41: South America Rhenium Market Revenue Share (%), by Application 2025 & 2033
- Figure 42: South America Rhenium Market Volume Share (%), by Application 2025 & 2033
- Figure 43: South America Rhenium Market Revenue (Million), by End-User Industry 2025 & 2033
- Figure 44: South America Rhenium Market Volume (K Tons), by End-User Industry 2025 & 2033
- Figure 45: South America Rhenium Market Revenue Share (%), by End-User Industry 2025 & 2033
- Figure 46: South America Rhenium Market Volume Share (%), by End-User Industry 2025 & 2033
- Figure 47: South America Rhenium Market Revenue (Million), by Country 2025 & 2033
- Figure 48: South America Rhenium Market Volume (K Tons), by Country 2025 & 2033
- Figure 49: South America Rhenium Market Revenue Share (%), by Country 2025 & 2033
- Figure 50: South America Rhenium Market Volume Share (%), by Country 2025 & 2033
- Figure 51: Middle East and Africa Rhenium Market Revenue (Million), by Application 2025 & 2033
- Figure 52: Middle East and Africa Rhenium Market Volume (K Tons), by Application 2025 & 2033
- Figure 53: Middle East and Africa Rhenium Market Revenue Share (%), by Application 2025 & 2033
- Figure 54: Middle East and Africa Rhenium Market Volume Share (%), by Application 2025 & 2033
- Figure 55: Middle East and Africa Rhenium Market Revenue (Million), by End-User Industry 2025 & 2033
- Figure 56: Middle East and Africa Rhenium Market Volume (K Tons), by End-User Industry 2025 & 2033
- Figure 57: Middle East and Africa Rhenium Market Revenue Share (%), by End-User Industry 2025 & 2033
- Figure 58: Middle East and Africa Rhenium Market Volume Share (%), by End-User Industry 2025 & 2033
- Figure 59: Middle East and Africa Rhenium Market Revenue (Million), by Country 2025 & 2033
- Figure 60: Middle East and Africa Rhenium Market Volume (K Tons), by Country 2025 & 2033
- Figure 61: Middle East and Africa Rhenium Market Revenue Share (%), by Country 2025 & 2033
- Figure 62: Middle East and Africa Rhenium Market Volume Share (%), by Country 2025 & 2033
List of Tables
- Table 1: Global Rhenium Market Revenue Million Forecast, by Application 2020 & 2033
- Table 2: Global Rhenium Market Volume K Tons Forecast, by Application 2020 & 2033
- Table 3: Global Rhenium Market Revenue Million Forecast, by End-User Industry 2020 & 2033
- Table 4: Global Rhenium Market Volume K Tons Forecast, by End-User Industry 2020 & 2033
- Table 5: Global Rhenium Market Revenue Million Forecast, by Region 2020 & 2033
- Table 6: Global Rhenium Market Volume K Tons Forecast, by Region 2020 & 2033
- Table 7: Global Rhenium Market Revenue Million Forecast, by Application 2020 & 2033
- Table 8: Global Rhenium Market Volume K Tons Forecast, by Application 2020 & 2033
- Table 9: Global Rhenium Market Revenue Million Forecast, by End-User Industry 2020 & 2033
- Table 10: Global Rhenium Market Volume K Tons Forecast, by End-User Industry 2020 & 2033
- Table 11: Global Rhenium Market Revenue Million Forecast, by Country 2020 & 2033
- Table 12: Global Rhenium Market Volume K Tons Forecast, by Country 2020 & 2033
- Table 13: China Rhenium Market Revenue (Million) Forecast, by Application 2020 & 2033
- Table 14: China Rhenium Market Volume (K Tons) Forecast, by Application 2020 & 2033
- Table 15: India Rhenium Market Revenue (Million) Forecast, by Application 2020 & 2033
- Table 16: India Rhenium Market Volume (K Tons) Forecast, by Application 2020 & 2033
- Table 17: Japan Rhenium Market Revenue (Million) Forecast, by Application 2020 & 2033
- Table 18: Japan Rhenium Market Volume (K Tons) Forecast, by Application 2020 & 2033
- Table 19: South Korea Rhenium Market Revenue (Million) Forecast, by Application 2020 & 2033
- Table 20: South Korea Rhenium Market Volume (K Tons) Forecast, by Application 2020 & 2033
- Table 21: Rest of Asia Pacific Rhenium Market Revenue (Million) Forecast, by Application 2020 & 2033
- Table 22: Rest of Asia Pacific Rhenium Market Volume (K Tons) Forecast, by Application 2020 & 2033
- Table 23: Global Rhenium Market Revenue Million Forecast, by Application 2020 & 2033
- Table 24: Global Rhenium Market Volume K Tons Forecast, by Application 2020 & 2033
- Table 25: Global Rhenium Market Revenue Million Forecast, by End-User Industry 2020 & 2033
- Table 26: Global Rhenium Market Volume K Tons Forecast, by End-User Industry 2020 & 2033
- Table 27: Global Rhenium Market Revenue Million Forecast, by Country 2020 & 2033
- Table 28: Global Rhenium Market Volume K Tons Forecast, by Country 2020 & 2033
- Table 29: United States Rhenium Market Revenue (Million) Forecast, by Application 2020 & 2033
- Table 30: United States Rhenium Market Volume (K Tons) Forecast, by Application 2020 & 2033
- Table 31: Canada Rhenium Market Revenue (Million) Forecast, by Application 2020 & 2033
- Table 32: Canada Rhenium Market Volume (K Tons) Forecast, by Application 2020 & 2033
- Table 33: Mexico Rhenium Market Revenue (Million) Forecast, by Application 2020 & 2033
- Table 34: Mexico Rhenium Market Volume (K Tons) Forecast, by Application 2020 & 2033
- Table 35: Global Rhenium Market Revenue Million Forecast, by Application 2020 & 2033
- Table 36: Global Rhenium Market Volume K Tons Forecast, by Application 2020 & 2033
- Table 37: Global Rhenium Market Revenue Million Forecast, by End-User Industry 2020 & 2033
- Table 38: Global Rhenium Market Volume K Tons Forecast, by End-User Industry 2020 & 2033
- Table 39: Global Rhenium Market Revenue Million Forecast, by Country 2020 & 2033
- Table 40: Global Rhenium Market Volume K Tons Forecast, by Country 2020 & 2033
- Table 41: Germany Rhenium Market Revenue (Million) Forecast, by Application 2020 & 2033
- Table 42: Germany Rhenium Market Volume (K Tons) Forecast, by Application 2020 & 2033
- Table 43: United Kingdom Rhenium Market Revenue (Million) Forecast, by Application 2020 & 2033
- Table 44: United Kingdom Rhenium Market Volume (K Tons) Forecast, by Application 2020 & 2033
- Table 45: France Rhenium Market Revenue (Million) Forecast, by Application 2020 & 2033
- Table 46: France Rhenium Market Volume (K Tons) Forecast, by Application 2020 & 2033
- Table 47: Italy Rhenium Market Revenue (Million) Forecast, by Application 2020 & 2033
- Table 48: Italy Rhenium Market Volume (K Tons) Forecast, by Application 2020 & 2033
- Table 49: Rest of Europe Rhenium Market Revenue (Million) Forecast, by Application 2020 & 2033
- Table 50: Rest of Europe Rhenium Market Volume (K Tons) Forecast, by Application 2020 & 2033
- Table 51: Global Rhenium Market Revenue Million Forecast, by Application 2020 & 2033
- Table 52: Global Rhenium Market Volume K Tons Forecast, by Application 2020 & 2033
- Table 53: Global Rhenium Market Revenue Million Forecast, by End-User Industry 2020 & 2033
- Table 54: Global Rhenium Market Volume K Tons Forecast, by End-User Industry 2020 & 2033
- Table 55: Global Rhenium Market Revenue Million Forecast, by Country 2020 & 2033
- Table 56: Global Rhenium Market Volume K Tons Forecast, by Country 2020 & 2033
- Table 57: Brazil Rhenium Market Revenue (Million) Forecast, by Application 2020 & 2033
- Table 58: Brazil Rhenium Market Volume (K Tons) Forecast, by Application 2020 & 2033
- Table 59: Argentina Rhenium Market Revenue (Million) Forecast, by Application 2020 & 2033
- Table 60: Argentina Rhenium Market Volume (K Tons) Forecast, by Application 2020 & 2033
- Table 61: Rest of South America Rhenium Market Revenue (Million) Forecast, by Application 2020 & 2033
- Table 62: Rest of South America Rhenium Market Volume (K Tons) Forecast, by Application 2020 & 2033
- Table 63: Global Rhenium Market Revenue Million Forecast, by Application 2020 & 2033
- Table 64: Global Rhenium Market Volume K Tons Forecast, by Application 2020 & 2033
- Table 65: Global Rhenium Market Revenue Million Forecast, by End-User Industry 2020 & 2033
- Table 66: Global Rhenium Market Volume K Tons Forecast, by End-User Industry 2020 & 2033
- Table 67: Global Rhenium Market Revenue Million Forecast, by Country 2020 & 2033
- Table 68: Global Rhenium Market Volume K Tons Forecast, by Country 2020 & 2033
- Table 69: Saudi Arabia Rhenium Market Revenue (Million) Forecast, by Application 2020 & 2033
- Table 70: Saudi Arabia Rhenium Market Volume (K Tons) Forecast, by Application 2020 & 2033
- Table 71: South Africa Rhenium Market Revenue (Million) Forecast, by Application 2020 & 2033
- Table 72: South Africa Rhenium Market Volume (K Tons) Forecast, by Application 2020 & 2033
- Table 73: Rest of Middle East and Africa Rhenium Market Revenue (Million) Forecast, by Application 2020 & 2033
- Table 74: Rest of Middle East and Africa Rhenium Market Volume (K Tons) Forecast, by Application 2020 & 2033
Frequently Asked Questions
1. What is the projected Compound Annual Growth Rate (CAGR) of the Rhenium Market?
The projected CAGR is approximately 3.3%.
2. Which companies are prominent players in the Rhenium Market?
Key companies in the market include Umicore, Heraeus Holding, MOLYMET S A, KGHM, Colonial Metals Inc, Höganäs AB, American Elements, NEO, H Cross Company, Buss & Buss Spezialmetalle GmbH, Rhenium Alloys Inc.
3. What are the main segments of the Rhenium Market?
The market segments include Application, End-User Industry.
4. Can you provide details about the market size?
The market size is estimated to be USD 168.9 Million as of 2022.
5. What are some drivers contributing to market growth?
; Growth in the Production of Aircraft; Increasing Demand from the Power Industry; Mounting Prominence in Catalyst Applications.
6. What are the notable trends driving market growth?
Aerospace to Dominate the Market.
7. Are there any restraints impacting market growth?
; Growing Usage of Substitutes; Unfavorable Conditions Arising Due to COVID-19 Outbreak.
8. Can you provide examples of recent developments in the market?
N/A
9. What pricing options are available for accessing the report?
Pricing options include single-user, multi-user, and enterprise licenses priced at USD 4750, USD 5250, and USD 8750 respectively.
10. Is the market size provided in terms of value or volume?
The market size is provided in terms of value, measured in Million and volume, measured in K Tons.
11. Are there any specific market keywords associated with the report?
Yes, the market keyword associated with the report is "Rhenium Market," which aids in identifying and referencing the specific market segment covered.
12. How do I determine which pricing option suits my needs best?
The pricing options vary based on user requirements and access needs. Individual users may opt for single-user licenses, while businesses requiring broader access may choose multi-user or enterprise licenses for cost-effective access to the report.
13. Are there any additional resources or data provided in the Rhenium Market report?
While the report offers comprehensive insights, it's advisable to review the specific contents or supplementary materials provided to ascertain if additional resources or data are available.
14. How can I stay updated on further developments or reports in the Rhenium Market?
To stay informed about further developments, trends, and reports in the Rhenium Market, consider subscribing to industry newsletters, following relevant companies and organizations, or regularly checking reputable industry news sources and publications.
Methodology
Step 1 - Identification of Relevant Samples Size from Population Database


Step 2 - Approaches for Defining Global Market Size (Value, Volume* & Price*)

Note*: In applicable scenarios
Step 3 - Data Sources
Primary Research
- Web Analytics
- Survey Reports
- Research Institute
- Latest Research Reports
- Opinion Leaders
Secondary Research
- Annual Reports
- White Paper
- Latest Press Release
- Industry Association
- Paid Database
- Investor Presentations

Step 4 - Data Triangulation
Involves using different sources of information in order to increase the validity of a study
These sources are likely to be stakeholders in a program - participants, other researchers, program staff, other community members, and so on.
Then we put all data in single framework & apply various statistical tools to find out the dynamic on the market.
During the analysis stage, feedback from the stakeholder groups would be compared to determine areas of agreement as well as areas of divergence

