Key Insights
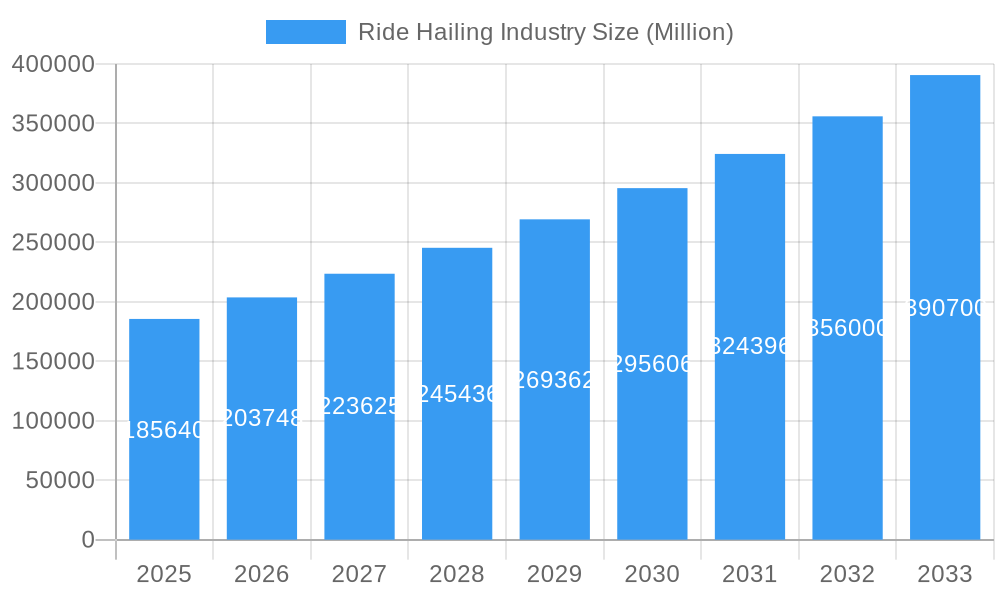
The ride-hailing industry, valued at $185.64 billion in 2025, is experiencing robust growth, projected to expand at a compound annual growth rate (CAGR) of 9.64% from 2025 to 2033. This expansion is fueled by several key factors. Increasing urbanization and the rising preference for convenient, on-demand transportation are major drivers. Technological advancements, such as improved mobile app functionalities and the integration of AI-powered route optimization, enhance user experience and operational efficiency, further bolstering market growth. The expansion of electric vehicle (EV) adoption within the ride-hailing fleet is also a significant trend, driven by environmental concerns and government incentives. However, challenges remain. Regulatory hurdles, including licensing requirements and pricing regulations, vary across regions and can impede market penetration. Fluctuations in fuel prices and driver shortages, particularly in periods of high demand, also present significant restraints on industry growth. Market segmentation reveals strong growth across various vehicle types, with cars currently dominating the market, followed by motorcycles and vans. The shift towards electric propulsion presents a significant opportunity for companies to reduce operational costs and improve their environmental footprint. Competition among established players like Uber, Lyft, and Didi, alongside emerging regional players, is intense, driving innovation and competitive pricing strategies. Geographic expansion into underserved markets presents significant future potential for the industry's growth.
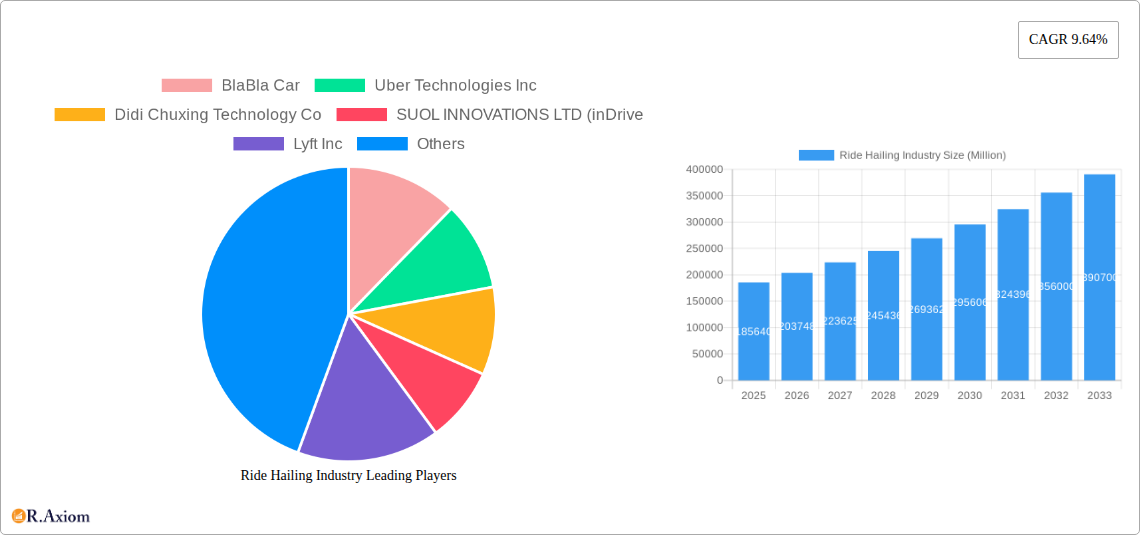
Ride Hailing Industry Market Size (In Billion)
The geographical distribution of the market is diverse, with North America and Asia Pacific currently representing the largest regional markets. North America benefits from high per capita income and advanced technological infrastructure, whereas Asia Pacific's growth is driven by its large and rapidly expanding urban populations. Europe, while a mature market, continues to witness steady growth. The continued success of ride-hailing companies hinges on their ability to navigate regulatory complexities, manage operational costs effectively, adapt to changing consumer preferences, and leverage technological advancements to enhance efficiency and sustainability. The industry's long-term prospects remain positive, fueled by the ongoing trend of on-demand transportation and technological innovation. The future will likely see increased integration of autonomous vehicles and further expansion into new transportation modes, like micro-mobility options, further shaping the competitive landscape.
Ride Hailing Industry Company Market Share
Ride Hailing Industry: A Comprehensive Market Report (2019-2033)
This comprehensive report provides an in-depth analysis of the global ride-hailing industry, covering the period 2019-2033, with a focus on market size, segmentation, competitive landscape, and future growth prospects. The report leverages extensive primary and secondary research to deliver actionable insights for industry stakeholders, investors, and strategists. The base year for this report is 2025, with estimations for 2025 and forecasts extending to 2033. The historical period analyzed is 2019-2024. The total market size in 2025 is estimated at $XX Million.
Ride Hailing Industry Market Concentration & Innovation
The ride-hailing market exhibits a high degree of concentration, with a few dominant players commanding significant market share. Uber Technologies Inc. and Didi Chuxing Technology Co. hold the largest portions globally, followed by regional giants like Grab Holdings Inc. in Southeast Asia and Ola in India. However, the market is also characterized by intense competition and ongoing innovation. Several factors contribute to this dynamic landscape:
- Market Share: Uber holds an estimated xx% global market share in 2025, while Didi holds approximately xx%. Other significant players like Grab and Ola each command substantial regional shares.
- Innovation Drivers: Technological advancements, particularly in areas like autonomous driving and electric vehicle integration, are key innovation drivers. Companies are investing heavily in developing sophisticated ride-hailing platforms, enhancing user experience, and exploring new mobility solutions.
- Regulatory Frameworks: Varying regulatory landscapes across different regions create both opportunities and challenges. Stringent regulations in some markets can limit expansion, while more lenient environments foster rapid growth.
- Product Substitutes: Public transportation, ride-sharing apps, and personal vehicle ownership pose competitive threats. The industry is continuously looking for ways to differentiate itself by improving pricing competitiveness, convenience, and value-added services.
- End-User Trends: Shifting consumer preferences, like a rising preference for eco-friendly transportation options and increased demand for convenient and affordable mobility solutions, are shaping the market.
- M&A Activities: The ride-hailing industry has witnessed significant mergers and acquisitions (M&A) activity in recent years. The total value of M&A deals between 2019 and 2024 is estimated to be $XX Million, driven by companies seeking to expand their market reach, acquire technological capabilities, or eliminate competition. These acquisitions have solidified the market concentration.
Ride Hailing Industry Industry Trends & Insights
The ride-hailing industry is experiencing robust growth, fueled by several key factors. The Compound Annual Growth Rate (CAGR) from 2025 to 2033 is projected to be xx%. This growth can be attributed to multiple factors:
- Market Growth Drivers: Increasing urbanization, rising disposable incomes in emerging economies, and the increasing prevalence of smartphones are major drivers of market expansion. Convenience, affordability, and accessibility of ride-hailing services are other significant growth factors. The market penetration rate is expected to reach xx% by 2033.
- Technological Disruptions: Autonomous vehicle technology presents a significant disruption potential, promising increased efficiency and potentially reduced costs. The integration of electric vehicles is also gaining traction, aligning with environmentally conscious consumer preferences and government regulations.
- Consumer Preferences: Consumers increasingly demand enhanced safety features, transparent pricing, diverse vehicle options, and seamless integration with other mobility solutions. This trend is pushing ride-hailing companies to invest in improving their services and platforms.
- Competitive Dynamics: Intense competition among existing players and the emergence of new entrants are pushing for continuous innovation and improvements in service quality, pricing strategies, and technological capabilities. This competitive pressure benefits consumers, delivering better value and increased choices.
Dominant Markets & Segments in Ride Hailing Industry
The ride-hailing market is geographically diverse, with varying degrees of dominance across regions and segments:
- Leading Region: Asia, particularly China and India, are currently the dominant markets due to a large population base, increasing urbanization, and rising smartphone penetration. North America and Europe also hold significant market shares.
- Leading Country: China remains a dominant player in terms of both market size and number of users. India and the United States also represent large and highly competitive markets.
- Leading Segment (By Vehicle Type): Cars are currently the dominant vehicle type, owing to versatility and widespread acceptance. However, motorcycle ride-hailing is gaining popularity in several Asian countries due to affordability and maneuverability in congested urban areas.
- Leading Segment (By Propulsion Type): Internal Combustion Engine (ICE) vehicles continue to dominate the market due to existing infrastructure and lower initial cost. However, the share of electric vehicles is steadily growing due to environmental concerns and government incentives.
Key Drivers:
- Economic Policies: Government regulations, subsidies, and tax incentives promoting electric vehicles and ride-sharing services significantly influence market growth.
- Infrastructure: The availability of robust transportation infrastructure, including roads and charging stations for electric vehicles, is crucial for market expansion.
Ride Hailing Industry Product Developments
Recent product innovations focus on enhancing user experience, safety, and sustainability. The integration of advanced technologies such as AI-powered dispatch systems, real-time tracking, and in-app payment systems is improving efficiency and convenience. The development of autonomous ride-hailing services and the increasing adoption of electric vehicles are shaping the future of the industry. This convergence of technology and sustainability offers significant competitive advantages and better addresses evolving consumer preferences.
Report Scope & Segmentation Analysis
This report segments the ride-hailing market by vehicle type (motorcycles, cars, vans, buses) and propulsion type (ICE, electric). Growth projections, market sizes, and competitive dynamics are analyzed for each segment.
By Vehicle Type: The car segment holds the largest market share, followed by motorcycles, especially in densely populated areas. Vans and buses cater to specific niches, like group transportation.
By Propulsion Type: ICE vehicles currently dominate, but the electric vehicle segment is showing significant growth potential, driven by environmental concerns and government policies.
Key Drivers of Ride Hailing Industry Growth
Several factors contribute to the ride-hailing industry's growth:
- Technological Advancements: Innovations in mobile technology, GPS, and autonomous driving are revolutionizing the industry, increasing efficiency and convenience.
- Economic Factors: Rising disposable incomes, especially in developing countries, drive demand for convenient and affordable transportation options.
- Regulatory Changes: Favorable government policies promoting ride-hailing services and supporting the development of sustainable transportation solutions are significantly boosting market growth.
Challenges in the Ride Hailing Industry Sector
The industry faces several challenges:
- Regulatory Hurdles: Varying and sometimes conflicting regulations across different jurisdictions create operational complexities and compliance burdens.
- Supply Chain Issues: Dependence on drivers and vehicles presents challenges during periods of high demand or supply disruptions.
- Competitive Pressures: Intense competition from established players and new entrants necessitates continuous innovation and cost optimization.
Emerging Opportunities in Ride Hailing Industry
Significant opportunities exist for growth:
- Expansion into New Markets: Untapped potential lies in developing economies with limited access to personal vehicles.
- Technological Innovations: Developing and integrating autonomous vehicle technology and focusing on sustainable mobility solutions will open new avenues for market expansion.
- Value-added Services: Offering integrated services like delivery, logistics, and subscription models can create new revenue streams.
Leading Players in the Ride Hailing Industry Market
Key Developments in Ride Hailing Industry Industry
- December 2023: TH International Limited partnered with DiDi Chuxing for a brand-building campaign.
- March 2024: Waymo launched its free Waymo One ride-hailing service in Los Angeles.
- April 2024: The Japanese government legalized the use of private ride-hailing services via apps like Uber and Go.
Strategic Outlook for Ride Hailing Industry Market
The ride-hailing market is poised for continued expansion, driven by technological advancements, increasing urbanization, and evolving consumer preferences. The focus on sustainable solutions and integration with other mobility services will be critical for future growth. Companies that successfully adapt to these trends and leverage technological innovations will be best positioned to capture market share and drive profitability in the coming years.
Ride Hailing Industry Segmentation
-
1. Vehicle Type
- 1.1. Motorcycles
- 1.2. Cars
- 1.3. Vans
- 1.4. Buses
-
2. Propulsion Type
- 2.1. Internal Combustion Engine (ICE)
- 2.2. Electric
Ride Hailing Industry Segmentation By Geography
-
1. North America
- 1.1. United States
- 1.2. Canada
- 1.3. Rest of North America
-
2. Europe
- 2.1. Germany
- 2.2. United Kingdom
- 2.3. France
- 2.4. Italy
- 2.5. Rest of Europe
-
3. Asia Pacific
- 3.1. China
- 3.2. India
- 3.3. Japan
- 3.4. South Korea
- 3.5. Rest of Asia Pacific
-
4. Rest of the World
- 4.1. South America
- 4.2. Middle East and Africa
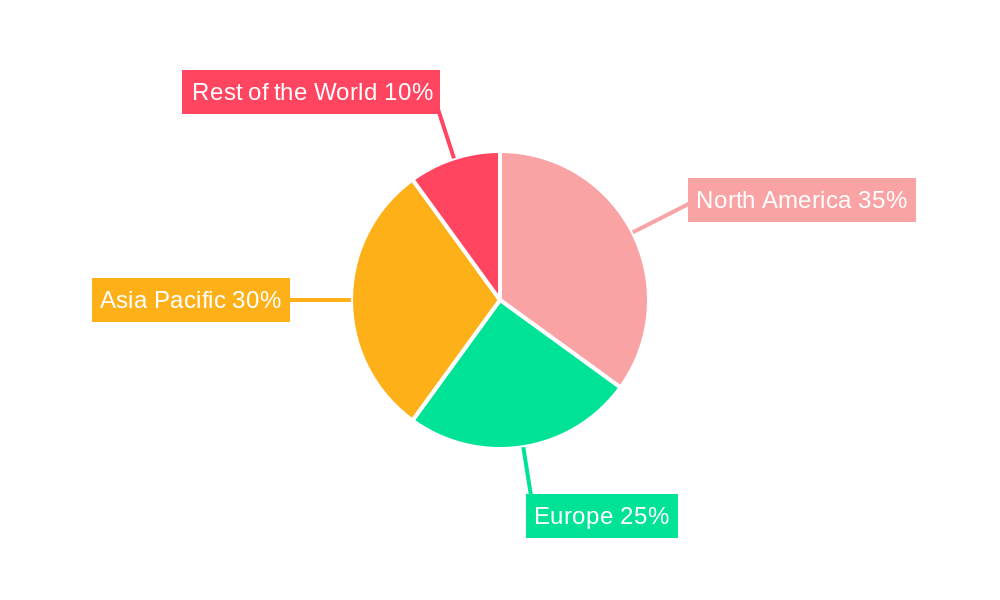
Ride Hailing Industry Regional Market Share
Geographic Coverage of Ride Hailing Industry
Ride Hailing Industry REPORT HIGHLIGHTS
| Aspects | Details |
|---|---|
| Study Period | 2020-2034 |
| Base Year | 2025 |
| Estimated Year | 2026 |
| Forecast Period | 2026-2034 |
| Historical Period | 2020-2025 |
| Growth Rate | CAGR of 9.64% from 2020-2034 |
| Segmentation |
|
Table of Contents
- 1. Introduction
- 1.1. Research Scope
- 1.2. Market Segmentation
- 1.3. Research Objective
- 1.4. Definitions and Assumptions
- 2. Executive Summary
- 2.1. Market Snapshot
- 3. Market Dynamics
- 3.1. Market Drivers
- 3.2. Market Restrains
- 3.3. Market Trends
- 3.4. Market Opportunities
- 4. Market Factor Analysis
- 4.1. Porters Five Forces
- 4.1.1. Bargaining Power of Suppliers
- 4.1.2. Bargaining Power of Buyers
- 4.1.3. Threat of New Entrants
- 4.1.4. Threat of Substitutes
- 4.1.5. Competitive Rivalry
- 4.2. PESTEL analysis
- 4.3. BCG Analysis
- 4.3.1. Stars (High Growth, High Market Share)
- 4.3.2. Cash Cows (Low Growth, High Market Share)
- 4.3.3. Question Mark (High Growth, Low Market Share)
- 4.3.4. Dogs (Low Growth, Low Market Share)
- 4.4. Ansoff Matrix Analysis
- 4.5. Supply Chain Analysis
- 4.6. Regulatory Landscape
- 4.7. Current Market Potential and Opportunity Assessment (TAM–SAM–SOM Framework)
- 4.8. RAX Analyst Note
- 4.1. Porters Five Forces
- 5. Market Analysis, Insights and Forecast 2021-2033
- 5.1. Market Analysis, Insights and Forecast - by Vehicle Type
- 5.1.1. Motorcycles
- 5.1.2. Cars
- 5.1.3. Vans
- 5.1.4. Buses
- 5.2. Market Analysis, Insights and Forecast - by Propulsion Type
- 5.2.1. Internal Combustion Engine (ICE)
- 5.2.2. Electric
- 5.3. Market Analysis, Insights and Forecast - by Region
- 5.3.1. North America
- 5.3.2. Europe
- 5.3.3. Asia Pacific
- 5.3.4. Rest of the World
- 5.1. Market Analysis, Insights and Forecast - by Vehicle Type
- 6. Global Ride Hailing Industry Analysis, Insights and Forecast, 2021-2033
- 6.1. Market Analysis, Insights and Forecast - by Vehicle Type
- 6.1.1. Motorcycles
- 6.1.2. Cars
- 6.1.3. Vans
- 6.1.4. Buses
- 6.2. Market Analysis, Insights and Forecast - by Propulsion Type
- 6.2.1. Internal Combustion Engine (ICE)
- 6.2.2. Electric
- 6.1. Market Analysis, Insights and Forecast - by Vehicle Type
- 7. North America Ride Hailing Industry Analysis, Insights and Forecast, 2020-2032
- 7.1. Market Analysis, Insights and Forecast - by Vehicle Type
- 7.1.1. Motorcycles
- 7.1.2. Cars
- 7.1.3. Vans
- 7.1.4. Buses
- 7.2. Market Analysis, Insights and Forecast - by Propulsion Type
- 7.2.1. Internal Combustion Engine (ICE)
- 7.2.2. Electric
- 7.1. Market Analysis, Insights and Forecast - by Vehicle Type
- 8. Europe Ride Hailing Industry Analysis, Insights and Forecast, 2020-2032
- 8.1. Market Analysis, Insights and Forecast - by Vehicle Type
- 8.1.1. Motorcycles
- 8.1.2. Cars
- 8.1.3. Vans
- 8.1.4. Buses
- 8.2. Market Analysis, Insights and Forecast - by Propulsion Type
- 8.2.1. Internal Combustion Engine (ICE)
- 8.2.2. Electric
- 8.1. Market Analysis, Insights and Forecast - by Vehicle Type
- 9. Asia Pacific Ride Hailing Industry Analysis, Insights and Forecast, 2020-2032
- 9.1. Market Analysis, Insights and Forecast - by Vehicle Type
- 9.1.1. Motorcycles
- 9.1.2. Cars
- 9.1.3. Vans
- 9.1.4. Buses
- 9.2. Market Analysis, Insights and Forecast - by Propulsion Type
- 9.2.1. Internal Combustion Engine (ICE)
- 9.2.2. Electric
- 9.1. Market Analysis, Insights and Forecast - by Vehicle Type
- 10. Rest of the World Ride Hailing Industry Analysis, Insights and Forecast, 2020-2032
- 10.1. Market Analysis, Insights and Forecast - by Vehicle Type
- 10.1.1. Motorcycles
- 10.1.2. Cars
- 10.1.3. Vans
- 10.1.4. Buses
- 10.2. Market Analysis, Insights and Forecast - by Propulsion Type
- 10.2.1. Internal Combustion Engine (ICE)
- 10.2.2. Electric
- 10.1. Market Analysis, Insights and Forecast - by Vehicle Type
- 11. Competitive Analysis
- 11.1. Company Profiles
- 11.1.1 BlaBla Car
- 11.1.1.1. Company Overview
- 11.1.1.2. Products
- 11.1.1.3. Company Financials
- 11.1.1.4. SWOT Analysis
- 11.1.2 Uber Technologies Inc
- 11.1.2.1. Company Overview
- 11.1.2.2. Products
- 11.1.2.3. Company Financials
- 11.1.2.4. SWOT Analysis
- 11.1.3 Didi Chuxing Technology Co
- 11.1.3.1. Company Overview
- 11.1.3.2. Products
- 11.1.3.3. Company Financials
- 11.1.3.4. SWOT Analysis
- 11.1.4 SUOL INNOVATIONS LTD (inDrive
- 11.1.4.1. Company Overview
- 11.1.4.2. Products
- 11.1.4.3. Company Financials
- 11.1.4.4. SWOT Analysis
- 11.1.5 Lyft Inc
- 11.1.5.1. Company Overview
- 11.1.5.2. Products
- 11.1.5.3. Company Financials
- 11.1.5.4. SWOT Analysis
- 11.1.6 Ani Technologies Pvt Ltd (OLA)
- 11.1.6.1. Company Overview
- 11.1.6.2. Products
- 11.1.6.3. Company Financials
- 11.1.6.4. SWOT Analysis
- 11.1.7 Gett Group
- 11.1.7.1. Company Overview
- 11.1.7.2. Products
- 11.1.7.3. Company Financials
- 11.1.7.4. SWOT Analysis
- 11.1.8 Bolt Technology OU
- 11.1.8.1. Company Overview
- 11.1.8.2. Products
- 11.1.8.3. Company Financials
- 11.1.8.4. SWOT Analysis
- 11.1.9 Maxi Mobility SL (Cabify)
- 11.1.9.1. Company Overview
- 11.1.9.2. Products
- 11.1.9.3. Company Financials
- 11.1.9.4. SWOT Analysis
- 11.1.10 GoTo Group (GoJek)
- 11.1.10.1. Company Overview
- 11.1.10.2. Products
- 11.1.10.3. Company Financials
- 11.1.10.4. SWOT Analysis
- 11.1.11 Xanh SM (GSM)
- 11.1.11.1. Company Overview
- 11.1.11.2. Products
- 11.1.11.3. Company Financials
- 11.1.11.4. SWOT Analysis
- 11.1.12 Grab Holdings Inc
- 11.1.12.1. Company Overview
- 11.1.12.2. Products
- 11.1.12.3. Company Financials
- 11.1.12.4. SWOT Analysis
- 11.1.1 BlaBla Car
- 11.2. Market Entropy
- 11.2.1 Company's Key Areas Served
- 11.2.2 Recent Developments
- 11.3. Company Market Share Analysis 2025
- 11.3.1 Top 5 Companies Market Share Analysis
- 11.3.2 Top 3 Companies Market Share Analysis
- 11.4. List of Potential Customers
- 12. Research Methodology
List of Figures
- Figure 1: Global Ride Hailing Industry Revenue Breakdown (Million, %) by Region 2025 & 2033
- Figure 2: North America Ride Hailing Industry Revenue (Million), by Vehicle Type 2025 & 2033
- Figure 3: North America Ride Hailing Industry Revenue Share (%), by Vehicle Type 2025 & 2033
- Figure 4: North America Ride Hailing Industry Revenue (Million), by Propulsion Type 2025 & 2033
- Figure 5: North America Ride Hailing Industry Revenue Share (%), by Propulsion Type 2025 & 2033
- Figure 6: North America Ride Hailing Industry Revenue (Million), by Country 2025 & 2033
- Figure 7: North America Ride Hailing Industry Revenue Share (%), by Country 2025 & 2033
- Figure 8: Europe Ride Hailing Industry Revenue (Million), by Vehicle Type 2025 & 2033
- Figure 9: Europe Ride Hailing Industry Revenue Share (%), by Vehicle Type 2025 & 2033
- Figure 10: Europe Ride Hailing Industry Revenue (Million), by Propulsion Type 2025 & 2033
- Figure 11: Europe Ride Hailing Industry Revenue Share (%), by Propulsion Type 2025 & 2033
- Figure 12: Europe Ride Hailing Industry Revenue (Million), by Country 2025 & 2033
- Figure 13: Europe Ride Hailing Industry Revenue Share (%), by Country 2025 & 2033
- Figure 14: Asia Pacific Ride Hailing Industry Revenue (Million), by Vehicle Type 2025 & 2033
- Figure 15: Asia Pacific Ride Hailing Industry Revenue Share (%), by Vehicle Type 2025 & 2033
- Figure 16: Asia Pacific Ride Hailing Industry Revenue (Million), by Propulsion Type 2025 & 2033
- Figure 17: Asia Pacific Ride Hailing Industry Revenue Share (%), by Propulsion Type 2025 & 2033
- Figure 18: Asia Pacific Ride Hailing Industry Revenue (Million), by Country 2025 & 2033
- Figure 19: Asia Pacific Ride Hailing Industry Revenue Share (%), by Country 2025 & 2033
- Figure 20: Rest of the World Ride Hailing Industry Revenue (Million), by Vehicle Type 2025 & 2033
- Figure 21: Rest of the World Ride Hailing Industry Revenue Share (%), by Vehicle Type 2025 & 2033
- Figure 22: Rest of the World Ride Hailing Industry Revenue (Million), by Propulsion Type 2025 & 2033
- Figure 23: Rest of the World Ride Hailing Industry Revenue Share (%), by Propulsion Type 2025 & 2033
- Figure 24: Rest of the World Ride Hailing Industry Revenue (Million), by Country 2025 & 2033
- Figure 25: Rest of the World Ride Hailing Industry Revenue Share (%), by Country 2025 & 2033
List of Tables
- Table 1: Global Ride Hailing Industry Revenue Million Forecast, by Vehicle Type 2020 & 2033
- Table 2: Global Ride Hailing Industry Revenue Million Forecast, by Propulsion Type 2020 & 2033
- Table 3: Global Ride Hailing Industry Revenue Million Forecast, by Region 2020 & 2033
- Table 4: Global Ride Hailing Industry Revenue Million Forecast, by Vehicle Type 2020 & 2033
- Table 5: Global Ride Hailing Industry Revenue Million Forecast, by Propulsion Type 2020 & 2033
- Table 6: Global Ride Hailing Industry Revenue Million Forecast, by Country 2020 & 2033
- Table 7: United States Ride Hailing Industry Revenue (Million) Forecast, by Application 2020 & 2033
- Table 8: Canada Ride Hailing Industry Revenue (Million) Forecast, by Application 2020 & 2033
- Table 9: Rest of North America Ride Hailing Industry Revenue (Million) Forecast, by Application 2020 & 2033
- Table 10: Global Ride Hailing Industry Revenue Million Forecast, by Vehicle Type 2020 & 2033
- Table 11: Global Ride Hailing Industry Revenue Million Forecast, by Propulsion Type 2020 & 2033
- Table 12: Global Ride Hailing Industry Revenue Million Forecast, by Country 2020 & 2033
- Table 13: Germany Ride Hailing Industry Revenue (Million) Forecast, by Application 2020 & 2033
- Table 14: United Kingdom Ride Hailing Industry Revenue (Million) Forecast, by Application 2020 & 2033
- Table 15: France Ride Hailing Industry Revenue (Million) Forecast, by Application 2020 & 2033
- Table 16: Italy Ride Hailing Industry Revenue (Million) Forecast, by Application 2020 & 2033
- Table 17: Rest of Europe Ride Hailing Industry Revenue (Million) Forecast, by Application 2020 & 2033
- Table 18: Global Ride Hailing Industry Revenue Million Forecast, by Vehicle Type 2020 & 2033
- Table 19: Global Ride Hailing Industry Revenue Million Forecast, by Propulsion Type 2020 & 2033
- Table 20: Global Ride Hailing Industry Revenue Million Forecast, by Country 2020 & 2033
- Table 21: China Ride Hailing Industry Revenue (Million) Forecast, by Application 2020 & 2033
- Table 22: India Ride Hailing Industry Revenue (Million) Forecast, by Application 2020 & 2033
- Table 23: Japan Ride Hailing Industry Revenue (Million) Forecast, by Application 2020 & 2033
- Table 24: South Korea Ride Hailing Industry Revenue (Million) Forecast, by Application 2020 & 2033
- Table 25: Rest of Asia Pacific Ride Hailing Industry Revenue (Million) Forecast, by Application 2020 & 2033
- Table 26: Global Ride Hailing Industry Revenue Million Forecast, by Vehicle Type 2020 & 2033
- Table 27: Global Ride Hailing Industry Revenue Million Forecast, by Propulsion Type 2020 & 2033
- Table 28: Global Ride Hailing Industry Revenue Million Forecast, by Country 2020 & 2033
- Table 29: South America Ride Hailing Industry Revenue (Million) Forecast, by Application 2020 & 2033
- Table 30: Middle East and Africa Ride Hailing Industry Revenue (Million) Forecast, by Application 2020 & 2033
Frequently Asked Questions
1. What is the projected Compound Annual Growth Rate (CAGR) of the Ride Hailing Industry?
The projected CAGR is approximately 9.64%.
2. Which companies are prominent players in the Ride Hailing Industry?
Key companies in the market include BlaBla Car, Uber Technologies Inc, Didi Chuxing Technology Co, SUOL INNOVATIONS LTD (inDrive, Lyft Inc, Ani Technologies Pvt Ltd (OLA), Gett Group, Bolt Technology OU, Maxi Mobility SL (Cabify), GoTo Group (GoJek), Xanh SM (GSM), Grab Holdings Inc.
3. What are the main segments of the Ride Hailing Industry?
The market segments include Vehicle Type, Propulsion Type.
4. Can you provide details about the market size?
The market size is estimated to be USD 185.64 Million as of 2022.
5. What are some drivers contributing to market growth?
Rising Traffic Congestion and Increasing Urban Population to Foster Market Growth.
6. What are the notable trends driving market growth?
The Cars Segment is Expected to Gain Traction During the Forecast Period.
7. Are there any restraints impacting market growth?
Strict Government Regulations and Policies Toward Ride-hailing Services Impact the Market Growth.
8. Can you provide examples of recent developments in the market?
April 2024: The Japanese government implemented the use of private ride-hailing services, which are accessible through mobile applications such as Uber and Go.
9. What pricing options are available for accessing the report?
Pricing options include single-user, multi-user, and enterprise licenses priced at USD 4750, USD 5250, and USD 8750 respectively.
10. Is the market size provided in terms of value or volume?
The market size is provided in terms of value, measured in Million.
11. Are there any specific market keywords associated with the report?
Yes, the market keyword associated with the report is "Ride Hailing Industry," which aids in identifying and referencing the specific market segment covered.
12. How do I determine which pricing option suits my needs best?
The pricing options vary based on user requirements and access needs. Individual users may opt for single-user licenses, while businesses requiring broader access may choose multi-user or enterprise licenses for cost-effective access to the report.
13. Are there any additional resources or data provided in the Ride Hailing Industry report?
While the report offers comprehensive insights, it's advisable to review the specific contents or supplementary materials provided to ascertain if additional resources or data are available.
14. How can I stay updated on further developments or reports in the Ride Hailing Industry?
To stay informed about further developments, trends, and reports in the Ride Hailing Industry, consider subscribing to industry newsletters, following relevant companies and organizations, or regularly checking reputable industry news sources and publications.
Methodology
Step 1 - Identification of Relevant Samples Size from Population Database


Step 2 - Approaches for Defining Global Market Size (Value, Volume* & Price*)

Note*: In applicable scenarios
Step 3 - Data Sources
Primary Research
- Web Analytics
- Survey Reports
- Research Institute
- Latest Research Reports
- Opinion Leaders
Secondary Research
- Annual Reports
- White Paper
- Latest Press Release
- Industry Association
- Paid Database
- Investor Presentations

Step 4 - Data Triangulation
Involves using different sources of information in order to increase the validity of a study
These sources are likely to be stakeholders in a program - participants, other researchers, program staff, other community members, and so on.
Then we put all data in single framework & apply various statistical tools to find out the dynamic on the market.
During the analysis stage, feedback from the stakeholder groups would be compared to determine areas of agreement as well as areas of divergence

