

Key Insights
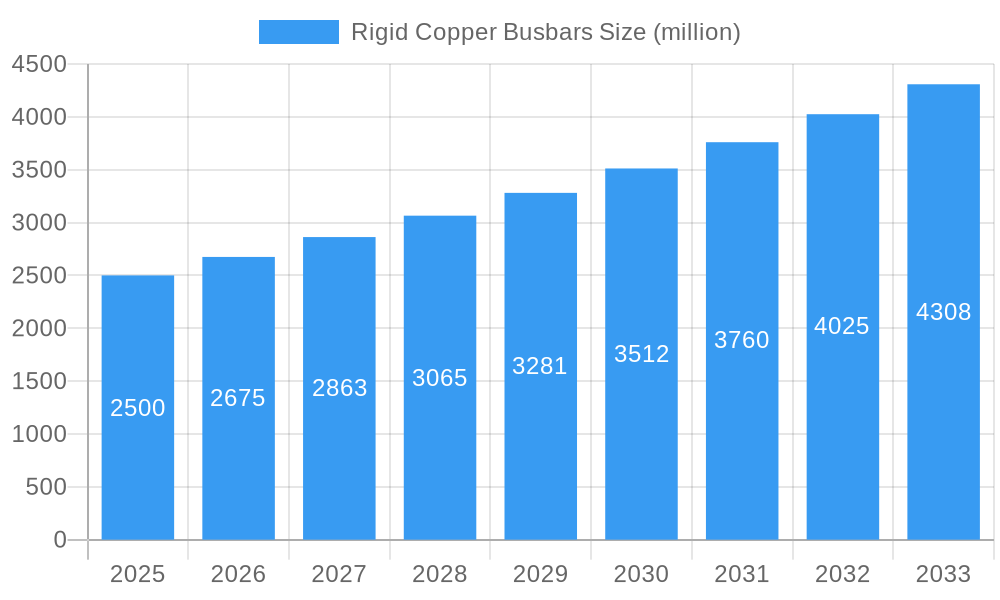
The global rigid copper busbar market is experiencing robust growth, driven by the increasing demand for efficient and reliable electrical power distribution systems across diverse industries. The market's expansion is fueled by several key factors, including the rising adoption of renewable energy sources (solar, wind), the burgeoning electric vehicle (EV) infrastructure, and the continuous growth of data centers and industrial automation. These sectors necessitate high-current carrying capacity and superior conductivity, making rigid copper busbars an essential component. Furthermore, the ongoing trend towards miniaturization and improved energy efficiency in electronic devices is also contributing to market growth. We estimate the market size in 2025 to be approximately $2.5 billion, with a Compound Annual Growth Rate (CAGR) of 7% projected through 2033. This growth trajectory is expected to be influenced by advancements in copper alloying technology leading to enhanced performance characteristics and the increasing adoption of smart grids which demand highly reliable and efficient power distribution solutions.
Rigid Copper Busbars Market Size (In Billion)
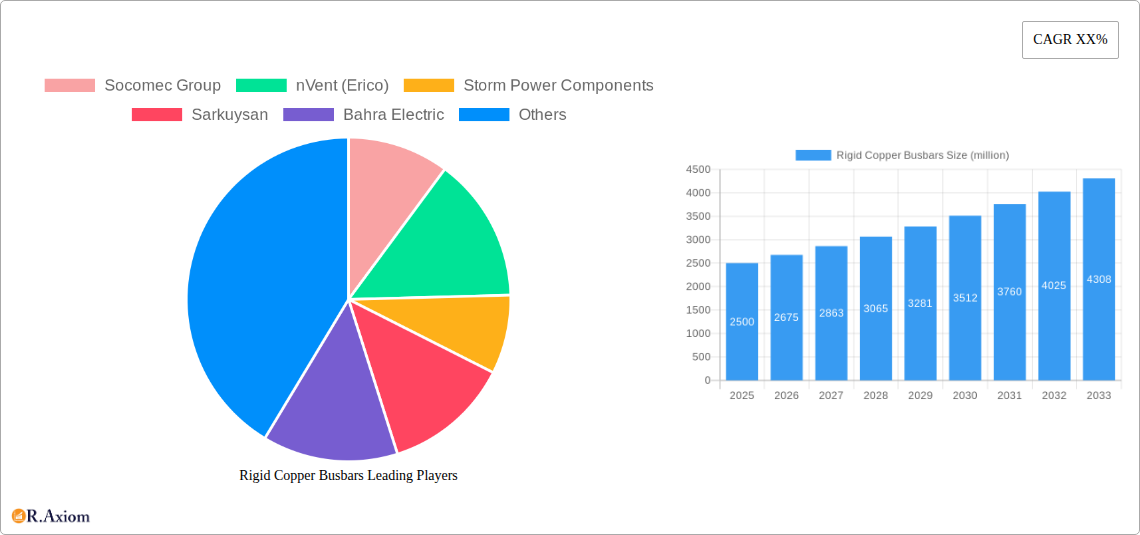
However, the market faces certain restraints. Fluctuations in copper prices pose a significant challenge, directly impacting production costs and potentially affecting market pricing. Additionally, the emergence of alternative conductor materials, such as aluminum busbars, presents competitive pressure. Nevertheless, the superior conductivity and reliability of copper busbars are expected to maintain their dominance in high-power applications. The market is segmented by various factors, including current carrying capacity, voltage rating, application (power generation, industrial automation, transportation), and geographical region. Key players such as Socomec Group, nVent (Erico), and Legrand are actively engaged in product innovation and strategic partnerships to strengthen their market positions. The competitive landscape is marked by a mix of established players and emerging companies, leading to continuous innovation and competitive pricing.
Rigid Copper Busbars Company Market Share
Rigid Copper Busbars Market Report: A Comprehensive Analysis (2019-2033)
This comprehensive report provides a detailed analysis of the global rigid copper busbars market, offering invaluable insights for industry stakeholders, investors, and strategic decision-makers. The study period covers 2019-2033, with 2025 as the base and estimated year. The report meticulously examines market dynamics, growth drivers, challenges, and opportunities, providing a 360-degree view of this crucial electrical component sector. The forecast period spans from 2025 to 2033, building upon the historical data from 2019-2024. The market is valued at xx million USD in 2025 and is projected to reach xx million USD by 2033, exhibiting a CAGR of xx% during the forecast period.
Rigid Copper Busbars Market Concentration & Innovation
The rigid copper busbars market exhibits a moderately concentrated landscape, with key players such as Socomec Group, nVent (Erico), and Legrand holding significant market share. The xx million USD market in 2025 shows a distribution where the top 5 players control approximately xx% of the market share. Innovation is driven by increasing demand for higher current carrying capacities, improved thermal management, and miniaturization for space-constrained applications. Stringent regulatory frameworks regarding safety and efficiency standards further push innovation. Aluminum busbars represent a key substitute, although copper remains dominant due to superior conductivity. The market experiences continuous M&A activities, with deal values exceeding xx million USD in the past five years, primarily driven by strategic acquisitions to expand product portfolios and geographic reach.
- Market Share: Top 5 players: xx%
- M&A Deal Value (Last 5 years): > xx million USD
- Key Innovation Drivers: Higher current capacity, improved thermal management, miniaturization.
- Regulatory Frameworks: Safety and efficiency standards (Specific standards will be listed in the full report).
Rigid Copper Busbars Industry Trends & Insights
The rigid copper busbars market is witnessing robust growth fueled by the burgeoning renewable energy sector, the expanding industrial automation landscape, and the increasing demand for reliable power distribution systems across various industries. Technological disruptions, such as the adoption of advanced manufacturing techniques and the development of novel copper alloys, are enhancing product performance and efficiency. Consumer preferences are shifting towards energy-efficient and sustainable solutions, further driving demand for high-quality, durable rigid copper busbars. Competitive dynamics are shaped by factors such as pricing strategies, product differentiation, and technological advancements, resulting in a dynamic and ever-evolving market. The market shows a projected CAGR of xx% (2025-2033), with significant market penetration in the renewable energy and industrial automation segments.
Dominant Markets & Segments in Rigid Copper Busbars
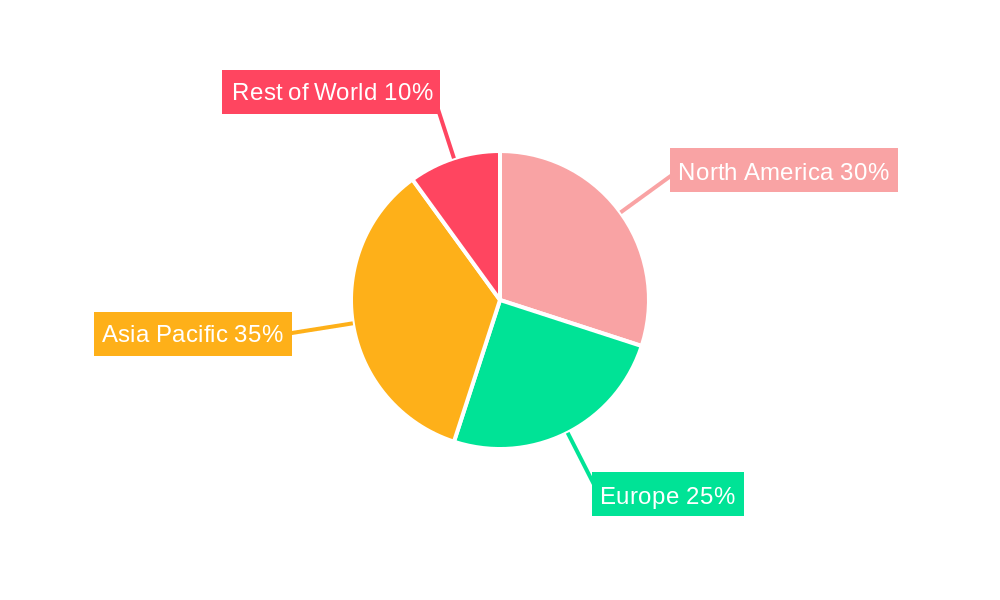
The North American region currently holds a dominant position in the global rigid copper busbars market, driven by robust industrial growth, substantial investments in infrastructure development, and favorable government policies supporting renewable energy adoption. The dominance is further reinforced by a strong manufacturing base and high per capita energy consumption. Within the region, the United States is a leading national market, followed by Canada and Mexico.
- Key Drivers in North America:
- Robust industrial growth.
- Significant infrastructure investments.
- Favorable government policies for renewable energy.
- Strong manufacturing base.
- Other Dominant Segments: (Further details including specific segments and their market share will be provided in the full report.)
Rigid Copper Busbars Product Developments
Recent product innovations focus on enhancing current carrying capacity, improving thermal dissipation, and reducing overall size and weight. The integration of advanced cooling technologies and the development of high-conductivity copper alloys are key aspects of this innovation. These advancements are specifically tailored to meet the demanding requirements of various applications, ranging from power generation and distribution to industrial automation and data centers, ensuring improved reliability and efficiency.
Report Scope & Segmentation Analysis
This report segments the rigid copper busbars market based on several key parameters including:
- By Material: Copper, and other materials.
- By Type: (Specific types like extruded, cast, etc. will be detailed in the report)
- By End-use Industry: (Specific industries such as renewable energy, industrial automation, etc. will be detailed in the report)
- By Region: (Regional segmentation will be detailed in the full report)
Each segment's growth trajectory, market size, and competitive landscape are analyzed in detail.
Key Drivers of Rigid Copper Busbars Growth
The growth of the rigid copper busbars market is driven by several factors, including:
- Rising demand for renewable energy: The growing adoption of solar and wind power necessitates robust power distribution systems.
- Expansion of the industrial automation sector: Automation requires efficient and reliable power transmission.
- Growth in data centers: Data centers demand high-capacity power distribution infrastructure.
- Government initiatives promoting energy efficiency: Policies supporting energy-efficient technologies are boosting market growth.
Challenges in the Rigid Copper Busbars Sector
The rigid copper busbars market faces several challenges, including:
- Fluctuations in copper prices: Copper price volatility directly impacts manufacturing costs and profitability.
- Supply chain disruptions: Global supply chain uncertainties can affect production and delivery timelines.
- Intense competition: The market is competitive, with numerous players vying for market share.
- Stringent environmental regulations: Compliance with environmental standards requires significant investment.
Emerging Opportunities in Rigid Copper Busbars
Several emerging opportunities exist in the rigid copper busbars market:
- Smart grids: Integration of smart grid technologies presents growth opportunities.
- Electric vehicles (EVs): The increasing popularity of EVs necessitates advanced power distribution solutions.
- Miniaturization: Demand for smaller, more efficient busbars is driving innovation.
- Development of new alloys: Research into advanced copper alloys offers scope for enhanced performance.
Leading Players in the Rigid Copper Busbars Market
- Socomec Group
- nVent (Erico)
- Storm Power Components
- Sarkuysan
- Bahra Electric
- Legrand
- EMS Industrial
- Metelec
- Promet
- Harger
- Rittal
- Gonda Metal
Key Developments in Rigid Copper Busbars Industry
- 2023 (Q3): Socomec Group launched a new line of high-capacity busbars incorporating advanced cooling technology.
- 2022 (Q4): nVent (Erico) acquired a smaller competitor, expanding its market presence.
- (Further key developments will be included in the full report)
Strategic Outlook for Rigid Copper Busbars Market
The rigid copper busbars market is poised for significant growth, driven by the sustained expansion of renewable energy, industrial automation, and data center infrastructure. Emerging technologies, including smart grid integration and advancements in materials science, offer considerable opportunities for innovation and market expansion. Companies adopting a strategic approach that prioritizes innovation, supply chain resilience, and customer-centric solutions will be best positioned to capitalize on this growth potential.
Rigid Copper Busbars Segmentation
-
1. Application
- 1.1. Power System
- 1.2. Oil and Gas
- 1.3. Transportation
- 1.4. Other
-
2. Types
- 2.1. ETP Type
- 2.2. OF Type
- 2.3. Other Type
Rigid Copper Busbars Segmentation By Geography
-
1. North America
- 1.1. United States
- 1.2. Canada
- 1.3. Mexico
-
2. South America
- 2.1. Brazil
- 2.2. Argentina
- 2.3. Rest of South America
-
3. Europe
- 3.1. United Kingdom
- 3.2. Germany
- 3.3. France
- 3.4. Italy
- 3.5. Spain
- 3.6. Russia
- 3.7. Benelux
- 3.8. Nordics
- 3.9. Rest of Europe
-
4. Middle East & Africa
- 4.1. Turkey
- 4.2. Israel
- 4.3. GCC
- 4.4. North Africa
- 4.5. South Africa
- 4.6. Rest of Middle East & Africa
-
5. Asia Pacific
- 5.1. China
- 5.2. India
- 5.3. Japan
- 5.4. South Korea
- 5.5. ASEAN
- 5.6. Oceania
- 5.7. Rest of Asia Pacific
Rigid Copper Busbars Regional Market Share
Geographic Coverage of Rigid Copper Busbars
Rigid Copper Busbars REPORT HIGHLIGHTS
| Aspects | Details |
|---|---|
| Study Period | 2020-2034 |
| Base Year | 2025 |
| Estimated Year | 2026 |
| Forecast Period | 2026-2034 |
| Historical Period | 2020-2025 |
| Growth Rate | CAGR of XX% from 2020-2034 |
| Segmentation |
|
Table of Contents
- 1. Introduction
- 1.1. Research Scope
- 1.2. Market Segmentation
- 1.3. Research Methodology
- 1.4. Definitions and Assumptions
- 2. Executive Summary
- 2.1. Introduction
- 3. Market Dynamics
- 3.1. Introduction
- 3.2. Market Drivers
- 3.3. Market Restrains
- 3.4. Market Trends
- 4. Market Factor Analysis
- 4.1. Porters Five Forces
- 4.2. Supply/Value Chain
- 4.3. PESTEL analysis
- 4.4. Market Entropy
- 4.5. Patent/Trademark Analysis
- 5. Global Rigid Copper Busbars Analysis, Insights and Forecast, 2020-2032
- 5.1. Market Analysis, Insights and Forecast - by Application
- 5.1.1. Power System
- 5.1.2. Oil and Gas
- 5.1.3. Transportation
- 5.1.4. Other
- 5.2. Market Analysis, Insights and Forecast - by Types
- 5.2.1. ETP Type
- 5.2.2. OF Type
- 5.2.3. Other Type
- 5.3. Market Analysis, Insights and Forecast - by Region
- 5.3.1. North America
- 5.3.2. South America
- 5.3.3. Europe
- 5.3.4. Middle East & Africa
- 5.3.5. Asia Pacific
- 5.1. Market Analysis, Insights and Forecast - by Application
- 6. North America Rigid Copper Busbars Analysis, Insights and Forecast, 2020-2032
- 6.1. Market Analysis, Insights and Forecast - by Application
- 6.1.1. Power System
- 6.1.2. Oil and Gas
- 6.1.3. Transportation
- 6.1.4. Other
- 6.2. Market Analysis, Insights and Forecast - by Types
- 6.2.1. ETP Type
- 6.2.2. OF Type
- 6.2.3. Other Type
- 6.1. Market Analysis, Insights and Forecast - by Application
- 7. South America Rigid Copper Busbars Analysis, Insights and Forecast, 2020-2032
- 7.1. Market Analysis, Insights and Forecast - by Application
- 7.1.1. Power System
- 7.1.2. Oil and Gas
- 7.1.3. Transportation
- 7.1.4. Other
- 7.2. Market Analysis, Insights and Forecast - by Types
- 7.2.1. ETP Type
- 7.2.2. OF Type
- 7.2.3. Other Type
- 7.1. Market Analysis, Insights and Forecast - by Application
- 8. Europe Rigid Copper Busbars Analysis, Insights and Forecast, 2020-2032
- 8.1. Market Analysis, Insights and Forecast - by Application
- 8.1.1. Power System
- 8.1.2. Oil and Gas
- 8.1.3. Transportation
- 8.1.4. Other
- 8.2. Market Analysis, Insights and Forecast - by Types
- 8.2.1. ETP Type
- 8.2.2. OF Type
- 8.2.3. Other Type
- 8.1. Market Analysis, Insights and Forecast - by Application
- 9. Middle East & Africa Rigid Copper Busbars Analysis, Insights and Forecast, 2020-2032
- 9.1. Market Analysis, Insights and Forecast - by Application
- 9.1.1. Power System
- 9.1.2. Oil and Gas
- 9.1.3. Transportation
- 9.1.4. Other
- 9.2. Market Analysis, Insights and Forecast - by Types
- 9.2.1. ETP Type
- 9.2.2. OF Type
- 9.2.3. Other Type
- 9.1. Market Analysis, Insights and Forecast - by Application
- 10. Asia Pacific Rigid Copper Busbars Analysis, Insights and Forecast, 2020-2032
- 10.1. Market Analysis, Insights and Forecast - by Application
- 10.1.1. Power System
- 10.1.2. Oil and Gas
- 10.1.3. Transportation
- 10.1.4. Other
- 10.2. Market Analysis, Insights and Forecast - by Types
- 10.2.1. ETP Type
- 10.2.2. OF Type
- 10.2.3. Other Type
- 10.1. Market Analysis, Insights and Forecast - by Application
- 11. Competitive Analysis
- 11.1. Global Market Share Analysis 2025
- 11.2. Company Profiles
- 11.2.1 Socomec Group
- 11.2.1.1. Overview
- 11.2.1.2. Products
- 11.2.1.3. SWOT Analysis
- 11.2.1.4. Recent Developments
- 11.2.1.5. Financials (Based on Availability)
- 11.2.2 nVent (Erico)
- 11.2.2.1. Overview
- 11.2.2.2. Products
- 11.2.2.3. SWOT Analysis
- 11.2.2.4. Recent Developments
- 11.2.2.5. Financials (Based on Availability)
- 11.2.3 Storm Power Components
- 11.2.3.1. Overview
- 11.2.3.2. Products
- 11.2.3.3. SWOT Analysis
- 11.2.3.4. Recent Developments
- 11.2.3.5. Financials (Based on Availability)
- 11.2.4 Sarkuysan
- 11.2.4.1. Overview
- 11.2.4.2. Products
- 11.2.4.3. SWOT Analysis
- 11.2.4.4. Recent Developments
- 11.2.4.5. Financials (Based on Availability)
- 11.2.5 Bahra Electric
- 11.2.5.1. Overview
- 11.2.5.2. Products
- 11.2.5.3. SWOT Analysis
- 11.2.5.4. Recent Developments
- 11.2.5.5. Financials (Based on Availability)
- 11.2.6 Legrand
- 11.2.6.1. Overview
- 11.2.6.2. Products
- 11.2.6.3. SWOT Analysis
- 11.2.6.4. Recent Developments
- 11.2.6.5. Financials (Based on Availability)
- 11.2.7 EMS Industrial
- 11.2.7.1. Overview
- 11.2.7.2. Products
- 11.2.7.3. SWOT Analysis
- 11.2.7.4. Recent Developments
- 11.2.7.5. Financials (Based on Availability)
- 11.2.8 Metelec
- 11.2.8.1. Overview
- 11.2.8.2. Products
- 11.2.8.3. SWOT Analysis
- 11.2.8.4. Recent Developments
- 11.2.8.5. Financials (Based on Availability)
- 11.2.9 Promet
- 11.2.9.1. Overview
- 11.2.9.2. Products
- 11.2.9.3. SWOT Analysis
- 11.2.9.4. Recent Developments
- 11.2.9.5. Financials (Based on Availability)
- 11.2.10 Harger
- 11.2.10.1. Overview
- 11.2.10.2. Products
- 11.2.10.3. SWOT Analysis
- 11.2.10.4. Recent Developments
- 11.2.10.5. Financials (Based on Availability)
- 11.2.11 Rittal
- 11.2.11.1. Overview
- 11.2.11.2. Products
- 11.2.11.3. SWOT Analysis
- 11.2.11.4. Recent Developments
- 11.2.11.5. Financials (Based on Availability)
- 11.2.12 Gonda Metal
- 11.2.12.1. Overview
- 11.2.12.2. Products
- 11.2.12.3. SWOT Analysis
- 11.2.12.4. Recent Developments
- 11.2.12.5. Financials (Based on Availability)
- 11.2.1 Socomec Group
List of Figures
- Figure 1: Global Rigid Copper Busbars Revenue Breakdown (million, %) by Region 2025 & 2033
- Figure 2: Global Rigid Copper Busbars Volume Breakdown (K, %) by Region 2025 & 2033
- Figure 3: North America Rigid Copper Busbars Revenue (million), by Application 2025 & 2033
- Figure 4: North America Rigid Copper Busbars Volume (K), by Application 2025 & 2033
- Figure 5: North America Rigid Copper Busbars Revenue Share (%), by Application 2025 & 2033
- Figure 6: North America Rigid Copper Busbars Volume Share (%), by Application 2025 & 2033
- Figure 7: North America Rigid Copper Busbars Revenue (million), by Types 2025 & 2033
- Figure 8: North America Rigid Copper Busbars Volume (K), by Types 2025 & 2033
- Figure 9: North America Rigid Copper Busbars Revenue Share (%), by Types 2025 & 2033
- Figure 10: North America Rigid Copper Busbars Volume Share (%), by Types 2025 & 2033
- Figure 11: North America Rigid Copper Busbars Revenue (million), by Country 2025 & 2033
- Figure 12: North America Rigid Copper Busbars Volume (K), by Country 2025 & 2033
- Figure 13: North America Rigid Copper Busbars Revenue Share (%), by Country 2025 & 2033
- Figure 14: North America Rigid Copper Busbars Volume Share (%), by Country 2025 & 2033
- Figure 15: South America Rigid Copper Busbars Revenue (million), by Application 2025 & 2033
- Figure 16: South America Rigid Copper Busbars Volume (K), by Application 2025 & 2033
- Figure 17: South America Rigid Copper Busbars Revenue Share (%), by Application 2025 & 2033
- Figure 18: South America Rigid Copper Busbars Volume Share (%), by Application 2025 & 2033
- Figure 19: South America Rigid Copper Busbars Revenue (million), by Types 2025 & 2033
- Figure 20: South America Rigid Copper Busbars Volume (K), by Types 2025 & 2033
- Figure 21: South America Rigid Copper Busbars Revenue Share (%), by Types 2025 & 2033
- Figure 22: South America Rigid Copper Busbars Volume Share (%), by Types 2025 & 2033
- Figure 23: South America Rigid Copper Busbars Revenue (million), by Country 2025 & 2033
- Figure 24: South America Rigid Copper Busbars Volume (K), by Country 2025 & 2033
- Figure 25: South America Rigid Copper Busbars Revenue Share (%), by Country 2025 & 2033
- Figure 26: South America Rigid Copper Busbars Volume Share (%), by Country 2025 & 2033
- Figure 27: Europe Rigid Copper Busbars Revenue (million), by Application 2025 & 2033
- Figure 28: Europe Rigid Copper Busbars Volume (K), by Application 2025 & 2033
- Figure 29: Europe Rigid Copper Busbars Revenue Share (%), by Application 2025 & 2033
- Figure 30: Europe Rigid Copper Busbars Volume Share (%), by Application 2025 & 2033
- Figure 31: Europe Rigid Copper Busbars Revenue (million), by Types 2025 & 2033
- Figure 32: Europe Rigid Copper Busbars Volume (K), by Types 2025 & 2033
- Figure 33: Europe Rigid Copper Busbars Revenue Share (%), by Types 2025 & 2033
- Figure 34: Europe Rigid Copper Busbars Volume Share (%), by Types 2025 & 2033
- Figure 35: Europe Rigid Copper Busbars Revenue (million), by Country 2025 & 2033
- Figure 36: Europe Rigid Copper Busbars Volume (K), by Country 2025 & 2033
- Figure 37: Europe Rigid Copper Busbars Revenue Share (%), by Country 2025 & 2033
- Figure 38: Europe Rigid Copper Busbars Volume Share (%), by Country 2025 & 2033
- Figure 39: Middle East & Africa Rigid Copper Busbars Revenue (million), by Application 2025 & 2033
- Figure 40: Middle East & Africa Rigid Copper Busbars Volume (K), by Application 2025 & 2033
- Figure 41: Middle East & Africa Rigid Copper Busbars Revenue Share (%), by Application 2025 & 2033
- Figure 42: Middle East & Africa Rigid Copper Busbars Volume Share (%), by Application 2025 & 2033
- Figure 43: Middle East & Africa Rigid Copper Busbars Revenue (million), by Types 2025 & 2033
- Figure 44: Middle East & Africa Rigid Copper Busbars Volume (K), by Types 2025 & 2033
- Figure 45: Middle East & Africa Rigid Copper Busbars Revenue Share (%), by Types 2025 & 2033
- Figure 46: Middle East & Africa Rigid Copper Busbars Volume Share (%), by Types 2025 & 2033
- Figure 47: Middle East & Africa Rigid Copper Busbars Revenue (million), by Country 2025 & 2033
- Figure 48: Middle East & Africa Rigid Copper Busbars Volume (K), by Country 2025 & 2033
- Figure 49: Middle East & Africa Rigid Copper Busbars Revenue Share (%), by Country 2025 & 2033
- Figure 50: Middle East & Africa Rigid Copper Busbars Volume Share (%), by Country 2025 & 2033
- Figure 51: Asia Pacific Rigid Copper Busbars Revenue (million), by Application 2025 & 2033
- Figure 52: Asia Pacific Rigid Copper Busbars Volume (K), by Application 2025 & 2033
- Figure 53: Asia Pacific Rigid Copper Busbars Revenue Share (%), by Application 2025 & 2033
- Figure 54: Asia Pacific Rigid Copper Busbars Volume Share (%), by Application 2025 & 2033
- Figure 55: Asia Pacific Rigid Copper Busbars Revenue (million), by Types 2025 & 2033
- Figure 56: Asia Pacific Rigid Copper Busbars Volume (K), by Types 2025 & 2033
- Figure 57: Asia Pacific Rigid Copper Busbars Revenue Share (%), by Types 2025 & 2033
- Figure 58: Asia Pacific Rigid Copper Busbars Volume Share (%), by Types 2025 & 2033
- Figure 59: Asia Pacific Rigid Copper Busbars Revenue (million), by Country 2025 & 2033
- Figure 60: Asia Pacific Rigid Copper Busbars Volume (K), by Country 2025 & 2033
- Figure 61: Asia Pacific Rigid Copper Busbars Revenue Share (%), by Country 2025 & 2033
- Figure 62: Asia Pacific Rigid Copper Busbars Volume Share (%), by Country 2025 & 2033
List of Tables
- Table 1: Global Rigid Copper Busbars Revenue million Forecast, by Application 2020 & 2033
- Table 2: Global Rigid Copper Busbars Volume K Forecast, by Application 2020 & 2033
- Table 3: Global Rigid Copper Busbars Revenue million Forecast, by Types 2020 & 2033
- Table 4: Global Rigid Copper Busbars Volume K Forecast, by Types 2020 & 2033
- Table 5: Global Rigid Copper Busbars Revenue million Forecast, by Region 2020 & 2033
- Table 6: Global Rigid Copper Busbars Volume K Forecast, by Region 2020 & 2033
- Table 7: Global Rigid Copper Busbars Revenue million Forecast, by Application 2020 & 2033
- Table 8: Global Rigid Copper Busbars Volume K Forecast, by Application 2020 & 2033
- Table 9: Global Rigid Copper Busbars Revenue million Forecast, by Types 2020 & 2033
- Table 10: Global Rigid Copper Busbars Volume K Forecast, by Types 2020 & 2033
- Table 11: Global Rigid Copper Busbars Revenue million Forecast, by Country 2020 & 2033
- Table 12: Global Rigid Copper Busbars Volume K Forecast, by Country 2020 & 2033
- Table 13: United States Rigid Copper Busbars Revenue (million) Forecast, by Application 2020 & 2033
- Table 14: United States Rigid Copper Busbars Volume (K) Forecast, by Application 2020 & 2033
- Table 15: Canada Rigid Copper Busbars Revenue (million) Forecast, by Application 2020 & 2033
- Table 16: Canada Rigid Copper Busbars Volume (K) Forecast, by Application 2020 & 2033
- Table 17: Mexico Rigid Copper Busbars Revenue (million) Forecast, by Application 2020 & 2033
- Table 18: Mexico Rigid Copper Busbars Volume (K) Forecast, by Application 2020 & 2033
- Table 19: Global Rigid Copper Busbars Revenue million Forecast, by Application 2020 & 2033
- Table 20: Global Rigid Copper Busbars Volume K Forecast, by Application 2020 & 2033
- Table 21: Global Rigid Copper Busbars Revenue million Forecast, by Types 2020 & 2033
- Table 22: Global Rigid Copper Busbars Volume K Forecast, by Types 2020 & 2033
- Table 23: Global Rigid Copper Busbars Revenue million Forecast, by Country 2020 & 2033
- Table 24: Global Rigid Copper Busbars Volume K Forecast, by Country 2020 & 2033
- Table 25: Brazil Rigid Copper Busbars Revenue (million) Forecast, by Application 2020 & 2033
- Table 26: Brazil Rigid Copper Busbars Volume (K) Forecast, by Application 2020 & 2033
- Table 27: Argentina Rigid Copper Busbars Revenue (million) Forecast, by Application 2020 & 2033
- Table 28: Argentina Rigid Copper Busbars Volume (K) Forecast, by Application 2020 & 2033
- Table 29: Rest of South America Rigid Copper Busbars Revenue (million) Forecast, by Application 2020 & 2033
- Table 30: Rest of South America Rigid Copper Busbars Volume (K) Forecast, by Application 2020 & 2033
- Table 31: Global Rigid Copper Busbars Revenue million Forecast, by Application 2020 & 2033
- Table 32: Global Rigid Copper Busbars Volume K Forecast, by Application 2020 & 2033
- Table 33: Global Rigid Copper Busbars Revenue million Forecast, by Types 2020 & 2033
- Table 34: Global Rigid Copper Busbars Volume K Forecast, by Types 2020 & 2033
- Table 35: Global Rigid Copper Busbars Revenue million Forecast, by Country 2020 & 2033
- Table 36: Global Rigid Copper Busbars Volume K Forecast, by Country 2020 & 2033
- Table 37: United Kingdom Rigid Copper Busbars Revenue (million) Forecast, by Application 2020 & 2033
- Table 38: United Kingdom Rigid Copper Busbars Volume (K) Forecast, by Application 2020 & 2033
- Table 39: Germany Rigid Copper Busbars Revenue (million) Forecast, by Application 2020 & 2033
- Table 40: Germany Rigid Copper Busbars Volume (K) Forecast, by Application 2020 & 2033
- Table 41: France Rigid Copper Busbars Revenue (million) Forecast, by Application 2020 & 2033
- Table 42: France Rigid Copper Busbars Volume (K) Forecast, by Application 2020 & 2033
- Table 43: Italy Rigid Copper Busbars Revenue (million) Forecast, by Application 2020 & 2033
- Table 44: Italy Rigid Copper Busbars Volume (K) Forecast, by Application 2020 & 2033
- Table 45: Spain Rigid Copper Busbars Revenue (million) Forecast, by Application 2020 & 2033
- Table 46: Spain Rigid Copper Busbars Volume (K) Forecast, by Application 2020 & 2033
- Table 47: Russia Rigid Copper Busbars Revenue (million) Forecast, by Application 2020 & 2033
- Table 48: Russia Rigid Copper Busbars Volume (K) Forecast, by Application 2020 & 2033
- Table 49: Benelux Rigid Copper Busbars Revenue (million) Forecast, by Application 2020 & 2033
- Table 50: Benelux Rigid Copper Busbars Volume (K) Forecast, by Application 2020 & 2033
- Table 51: Nordics Rigid Copper Busbars Revenue (million) Forecast, by Application 2020 & 2033
- Table 52: Nordics Rigid Copper Busbars Volume (K) Forecast, by Application 2020 & 2033
- Table 53: Rest of Europe Rigid Copper Busbars Revenue (million) Forecast, by Application 2020 & 2033
- Table 54: Rest of Europe Rigid Copper Busbars Volume (K) Forecast, by Application 2020 & 2033
- Table 55: Global Rigid Copper Busbars Revenue million Forecast, by Application 2020 & 2033
- Table 56: Global Rigid Copper Busbars Volume K Forecast, by Application 2020 & 2033
- Table 57: Global Rigid Copper Busbars Revenue million Forecast, by Types 2020 & 2033
- Table 58: Global Rigid Copper Busbars Volume K Forecast, by Types 2020 & 2033
- Table 59: Global Rigid Copper Busbars Revenue million Forecast, by Country 2020 & 2033
- Table 60: Global Rigid Copper Busbars Volume K Forecast, by Country 2020 & 2033
- Table 61: Turkey Rigid Copper Busbars Revenue (million) Forecast, by Application 2020 & 2033
- Table 62: Turkey Rigid Copper Busbars Volume (K) Forecast, by Application 2020 & 2033
- Table 63: Israel Rigid Copper Busbars Revenue (million) Forecast, by Application 2020 & 2033
- Table 64: Israel Rigid Copper Busbars Volume (K) Forecast, by Application 2020 & 2033
- Table 65: GCC Rigid Copper Busbars Revenue (million) Forecast, by Application 2020 & 2033
- Table 66: GCC Rigid Copper Busbars Volume (K) Forecast, by Application 2020 & 2033
- Table 67: North Africa Rigid Copper Busbars Revenue (million) Forecast, by Application 2020 & 2033
- Table 68: North Africa Rigid Copper Busbars Volume (K) Forecast, by Application 2020 & 2033
- Table 69: South Africa Rigid Copper Busbars Revenue (million) Forecast, by Application 2020 & 2033
- Table 70: South Africa Rigid Copper Busbars Volume (K) Forecast, by Application 2020 & 2033
- Table 71: Rest of Middle East & Africa Rigid Copper Busbars Revenue (million) Forecast, by Application 2020 & 2033
- Table 72: Rest of Middle East & Africa Rigid Copper Busbars Volume (K) Forecast, by Application 2020 & 2033
- Table 73: Global Rigid Copper Busbars Revenue million Forecast, by Application 2020 & 2033
- Table 74: Global Rigid Copper Busbars Volume K Forecast, by Application 2020 & 2033
- Table 75: Global Rigid Copper Busbars Revenue million Forecast, by Types 2020 & 2033
- Table 76: Global Rigid Copper Busbars Volume K Forecast, by Types 2020 & 2033
- Table 77: Global Rigid Copper Busbars Revenue million Forecast, by Country 2020 & 2033
- Table 78: Global Rigid Copper Busbars Volume K Forecast, by Country 2020 & 2033
- Table 79: China Rigid Copper Busbars Revenue (million) Forecast, by Application 2020 & 2033
- Table 80: China Rigid Copper Busbars Volume (K) Forecast, by Application 2020 & 2033
- Table 81: India Rigid Copper Busbars Revenue (million) Forecast, by Application 2020 & 2033
- Table 82: India Rigid Copper Busbars Volume (K) Forecast, by Application 2020 & 2033
- Table 83: Japan Rigid Copper Busbars Revenue (million) Forecast, by Application 2020 & 2033
- Table 84: Japan Rigid Copper Busbars Volume (K) Forecast, by Application 2020 & 2033
- Table 85: South Korea Rigid Copper Busbars Revenue (million) Forecast, by Application 2020 & 2033
- Table 86: South Korea Rigid Copper Busbars Volume (K) Forecast, by Application 2020 & 2033
- Table 87: ASEAN Rigid Copper Busbars Revenue (million) Forecast, by Application 2020 & 2033
- Table 88: ASEAN Rigid Copper Busbars Volume (K) Forecast, by Application 2020 & 2033
- Table 89: Oceania Rigid Copper Busbars Revenue (million) Forecast, by Application 2020 & 2033
- Table 90: Oceania Rigid Copper Busbars Volume (K) Forecast, by Application 2020 & 2033
- Table 91: Rest of Asia Pacific Rigid Copper Busbars Revenue (million) Forecast, by Application 2020 & 2033
- Table 92: Rest of Asia Pacific Rigid Copper Busbars Volume (K) Forecast, by Application 2020 & 2033
Frequently Asked Questions
1. What is the projected Compound Annual Growth Rate (CAGR) of the Rigid Copper Busbars?
The projected CAGR is approximately XX%.
2. Which companies are prominent players in the Rigid Copper Busbars?
Key companies in the market include Socomec Group, nVent (Erico), Storm Power Components, Sarkuysan, Bahra Electric, Legrand, EMS Industrial, Metelec, Promet, Harger, Rittal, Gonda Metal.
3. What are the main segments of the Rigid Copper Busbars?
The market segments include Application, Types.
4. Can you provide details about the market size?
The market size is estimated to be USD XXX million as of 2022.
5. What are some drivers contributing to market growth?
N/A
6. What are the notable trends driving market growth?
N/A
7. Are there any restraints impacting market growth?
N/A
8. Can you provide examples of recent developments in the market?
N/A
9. What pricing options are available for accessing the report?
Pricing options include single-user, multi-user, and enterprise licenses priced at USD 3350.00, USD 5025.00, and USD 6700.00 respectively.
10. Is the market size provided in terms of value or volume?
The market size is provided in terms of value, measured in million and volume, measured in K.
11. Are there any specific market keywords associated with the report?
Yes, the market keyword associated with the report is "Rigid Copper Busbars," which aids in identifying and referencing the specific market segment covered.
12. How do I determine which pricing option suits my needs best?
The pricing options vary based on user requirements and access needs. Individual users may opt for single-user licenses, while businesses requiring broader access may choose multi-user or enterprise licenses for cost-effective access to the report.
13. Are there any additional resources or data provided in the Rigid Copper Busbars report?
While the report offers comprehensive insights, it's advisable to review the specific contents or supplementary materials provided to ascertain if additional resources or data are available.
14. How can I stay updated on further developments or reports in the Rigid Copper Busbars?
To stay informed about further developments, trends, and reports in the Rigid Copper Busbars, consider subscribing to industry newsletters, following relevant companies and organizations, or regularly checking reputable industry news sources and publications.
Methodology
Step 1 - Identification of Relevant Samples Size from Population Database


Step 2 - Approaches for Defining Global Market Size (Value, Volume* & Price*)

Note*: In applicable scenarios
Step 3 - Data Sources
Primary Research
- Web Analytics
- Survey Reports
- Research Institute
- Latest Research Reports
- Opinion Leaders
Secondary Research
- Annual Reports
- White Paper
- Latest Press Release
- Industry Association
- Paid Database
- Investor Presentations

Step 4 - Data Triangulation
Involves using different sources of information in order to increase the validity of a study
These sources are likely to be stakeholders in a program - participants, other researchers, program staff, other community members, and so on.
Then we put all data in single framework & apply various statistical tools to find out the dynamic on the market.
During the analysis stage, feedback from the stakeholder groups would be compared to determine areas of agreement as well as areas of divergence