

Key Insights
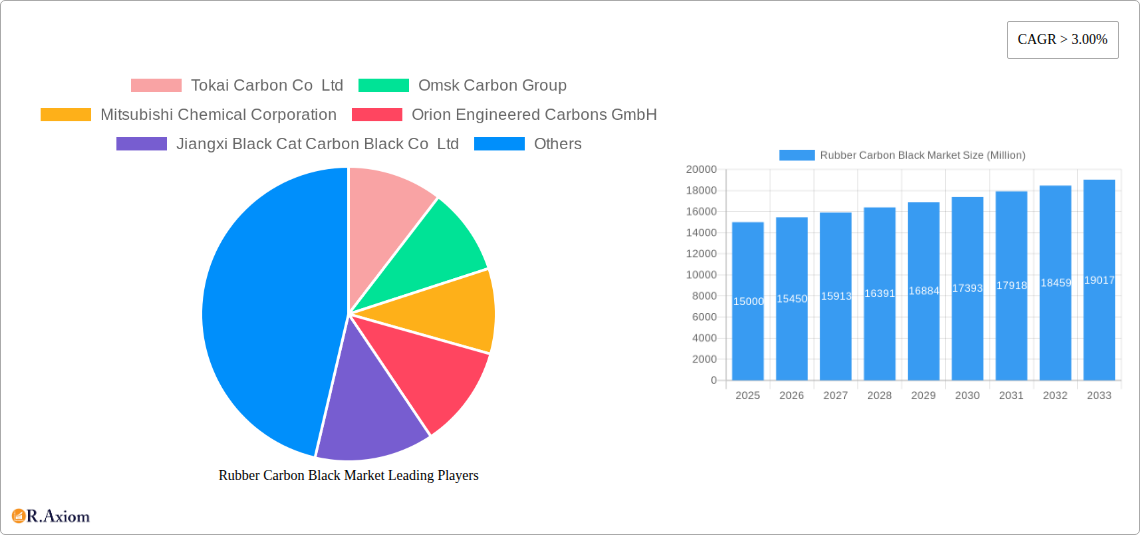
The global rubber carbon black market is experiencing robust growth, driven by the expanding tire industry, particularly in developing economies like India and China. The market's Compound Annual Growth Rate (CAGR) exceeding 3% indicates a consistent upward trajectory, projected to continue through 2033. Key application segments, including tires, hoses, belts, and gaskets, contribute significantly to this growth, fueled by increasing vehicle production and infrastructure development globally. Furthermore, the rising demand for high-performance materials in automotive and industrial applications is stimulating innovation in carbon black formulations, leading to enhanced product properties like improved abrasion resistance and UV stability. The increasing focus on sustainable manufacturing practices within the carbon black industry is also shaping market dynamics, with companies investing in technologies to reduce environmental impact and improve operational efficiency. Major players like Cabot Corporation, Birla Carbon, and Tokai Carbon are strategically positioned to benefit from this growth, leveraging their established manufacturing capabilities and extensive distribution networks. However, fluctuations in raw material prices and stringent environmental regulations pose potential challenges to market expansion. The competitive landscape is characterized by both established industry giants and emerging players, leading to innovation and price competitiveness. The Asia-Pacific region currently dominates the market share due to its significant manufacturing base and burgeoning automotive sector.
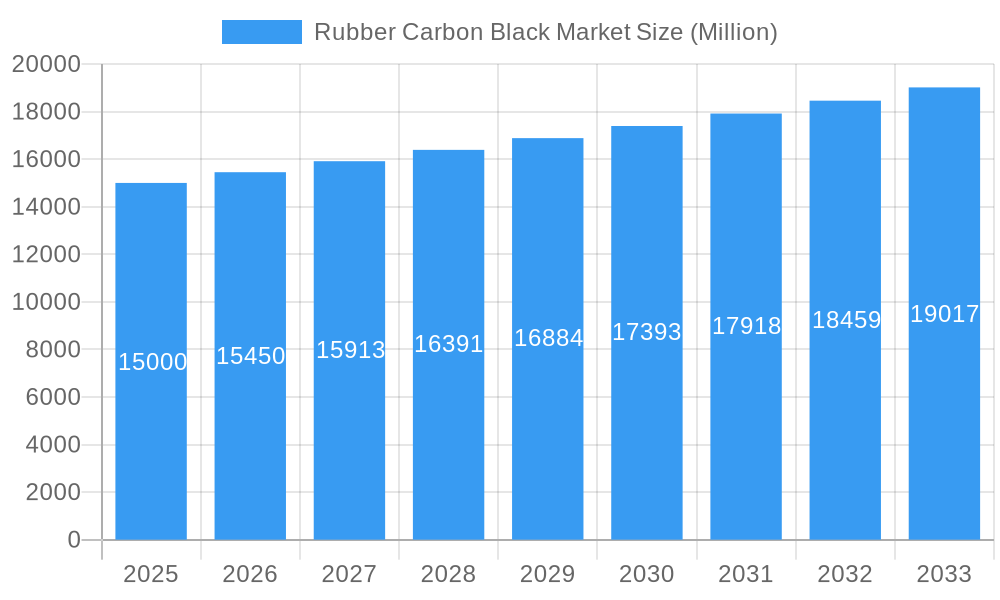
Rubber Carbon Black Market Market Size (In Billion)
The forecast period (2025-2033) promises further expansion for the rubber carbon black market. Factors contributing to this sustained growth include the increasing adoption of electric vehicles (EVs), which require specialized carbon black types in their tire components, and the expansion of the construction and industrial sectors in various regions. While restraints like fluctuating crude oil prices and environmental concerns exist, ongoing technological advancements and the continuous development of new applications for carbon black are likely to offset these challenges. Geographic expansion into emerging markets and strategic partnerships are expected to be key growth strategies for industry players during this period. The market's segmentation by application and geography provides opportunities for focused growth strategies, allowing companies to tailor their offerings to specific needs and regional demands. The ongoing emphasis on sustainability will likely drive further innovation in carbon black production methods, contributing to a greener and more efficient market in the long term.
Rubber Carbon Black Market Company Market Share
Rubber Carbon Black Market: A Comprehensive Market Report (2019-2033)
This comprehensive report provides a detailed analysis of the global Rubber Carbon Black Market, offering invaluable insights for industry stakeholders, investors, and strategic decision-makers. The report covers the period from 2019 to 2033, with a focus on the forecast period of 2025-2033, and utilizes 2025 as the base year. The study delves into market dynamics, segmentation, competitive landscape, and future growth projections, incorporating both historical data (2019-2024) and future estimations. The report uses Million for all values.
Rubber Carbon Black Market Concentration & Innovation
This section analyzes the competitive intensity and innovative forces within the rubber carbon black market. The market exhibits a moderately concentrated structure, with several major players holding significant market share. However, the presence of numerous smaller players fosters competition and drives innovation. Key metrics such as market concentration ratios (e.g., CR4, CR8) and Herfindahl-Hirschman Index (HHI) will be calculated to quantify this concentration. The report will also examine the impact of mergers and acquisitions (M&A) activities, including deal values and their implications for market consolidation. Innovation is driven by the need for improved product performance, sustainability concerns, and stringent regulatory requirements. The report will identify key innovation drivers such as:
- Technological advancements: Development of new carbon black grades with enhanced properties.
- Sustainability initiatives: Increased demand for bio-based and recycled carbon black.
- Regulatory pressures: Compliance with environmental regulations and safety standards.
The analysis will explore the impact of substitute materials, evolving end-user trends, and the competitive landscape. For example, the market share of top players like Birla Carbon, Cabot Corporation, and Orion Engineered Carbons will be assessed to understand market dominance. M&A activities will be analyzed, identifying significant deals and evaluating their impact on the market structure (e.g., a xx Million acquisition resulting in market share increase of xx%). The regulatory landscape and its effect on market participants will also be investigated.
Rubber Carbon Black Market Industry Trends & Insights
This section offers a detailed analysis of prevailing industry trends and their implications for market growth. The global Rubber Carbon Black Market is projected to witness a Compound Annual Growth Rate (CAGR) of xx% during the forecast period (2025-2033). This growth is primarily attributed to factors such as increasing demand from the automotive industry (driven by the rising number of vehicles globally and the increasing use of rubber in tires, hoses, and belts), expansion of the construction sector, and burgeoning demand from other end-use sectors like footwear and industrial applications. The market penetration of specialty and high-performance carbon blacks is also expected to increase significantly due to rising demand for high-quality rubber products with improved durability and performance. Technological advancements like the development of sustainable carbon blacks are driving market growth, although the associated costs may pose a challenge to adoption. Changes in consumer preferences toward environmentally friendly products and stringent government regulations are also influencing market dynamics. Competitive dynamics will be analyzed to identify key strategies employed by market participants, including product differentiation, cost optimization, and partnerships.
Dominant Markets & Segments in Rubber Carbon Black Market
The report identifies the leading regional, country, and application segments within the rubber carbon black market. While specific market share data for each segment requires further analysis, preliminary indications suggest that the Tires application segment dominates the market due to its extensive use in tire manufacturing. Asia-Pacific is anticipated to be the leading region due to strong economic growth and a large automotive sector. China, specifically, is likely to be a key country driver.
Key Drivers for Dominant Segments:
- Tires: High volume consumption, continuous technological advancements, and stringent regulatory standards driving the demand for high-performance carbon blacks.
- Asia-Pacific: Rapid industrialization, automotive manufacturing boom, and expanding infrastructure development in countries like China and India.
Further, a detailed analysis will be conducted to identify the specific reasons behind the dominance of this segment. This will include economic factors, government policies supporting infrastructure development, and consumer purchasing trends.
- Hoses, Belts, and Gaskets: These segments also benefit from automotive and industrial applications, displaying strong growth potential.
- Vibration Control and Footwear: These niche segments exhibit steady demand driven by the need for specialized materials and are expected to show moderate growth. The report will quantify the growth projection for each of these segments.
Rubber Carbon Black Market Product Developments
Recent product developments highlight a shift toward eco-friendly and high-performance carbon blacks. Orion Engineered Carbons' launch of ECORAX Nature, a plant-based carbon black for rubber applications, exemplifies this trend. The development of new grades with improved dispersion, reinforcement, and processing properties caters to the demands of various applications. These innovations create competitive advantages through improved product performance and sustainability. The market is witnessing an increased focus on materials that cater to environmental regulations and sustainability concerns.
Report Scope & Segmentation Analysis
The report segments the Rubber Carbon Black market by application: Tires, Hoses, Belts, Gaskets, Vibration Control, and Footwear. Each segment's growth projection, market size (in Million), and competitive landscape are analyzed. For instance, the tire segment is the largest, projected to grow at xx% CAGR, with intense competition among major players. The hoses, belts, and gaskets segments display similar growth patterns driven by automotive and industrial applications. Vibration control and footwear represent smaller niche markets with moderate growth projections. Specific market size estimates for each segment in Million will be provided in the full report.
Key Drivers of Rubber Carbon Black Market Growth
Growth in the Rubber Carbon Black Market is driven by several key factors:
- Automotive industry expansion: Increasing global vehicle production fuels high demand for tires and other rubber components.
- Infrastructure development: Expansion of roads, bridges, and buildings drives demand for rubber-based products in various applications.
- Technological advancements: The development of new carbon black grades with improved properties and sustainability enhances market growth.
- Growing consumer demand for high-performance and durable goods.
Challenges in the Rubber Carbon Black Market Sector
The Rubber Carbon Black Market faces challenges such as:
- Fluctuating raw material prices: Variations in the cost of feedstock impact production costs and profitability.
- Stringent environmental regulations: Compliance with increasingly strict emission standards poses challenges for manufacturers.
- Intense competition: The presence of numerous players creates a competitive market with varying pricing strategies.
- Supply chain disruptions: Global events can impact raw material availability and production efficiency, creating shortages and price volatility.
Emerging Opportunities in Rubber Carbon Black Market
Emerging opportunities in the market include:
- Growing demand for sustainable and eco-friendly carbon blacks: This creates new market segments for plant-based and recycled materials.
- Expansion into niche applications: Exploring new applications for carbon black in specialized rubber products presents significant opportunities.
- Advancements in technology: The development of innovative carbon black grades with enhanced properties offers significant growth potential.
- Growth in developing economies: Expanding economies like India and Southeast Asia provide promising growth opportunities.
Leading Players in the Rubber Carbon Black Market Market
- Tokai Carbon Co Ltd
- Omsk Carbon Group
- Mitsubishi Chemical Corporation
- Orion Engineered Carbons GmbH
- Jiangxi Black Cat Carbon Black Co Ltd
- NNPC
- ASAHI CARBON Co Ltd
- Cabot Corporation
- Himadri Speciality Chemical Ltd
- Longxing Chemical Stock Co Ltd
- International CSRC Investment Holdings Co Ltd
- PCBL
- OCI Company Ltd
- Birla Carbon (Aditya Birla Group)
Key Developments in Rubber Carbon Black Market Industry
- June 2021: Orion Engineered Carbon launched ECORAX Nature, a plant-based carbon black for rubber applications.
- August 2021: Phillips Carbon Black Ltd (PCBL) announced plans to invest xx Million in capacity expansion over two years.
- September 2021: Orion Engineered Carbon started constructing a new plant in Huaibei, China, with a capacity of 65-70 thousand tons.
- March 2022: Orion Engineered Carbon commenced commercial sales from its new Ravenna, Italy, production site with a capacity of 25,000 tons.
Strategic Outlook for Rubber Carbon Black Market Market
The Rubber Carbon Black Market is poised for continued growth, driven by increasing demand from key end-use sectors and ongoing technological advancements. The focus on sustainability and the development of eco-friendly products will shape future market dynamics. Expansion into emerging markets and strategic partnerships will be crucial for success. The market's long-term outlook remains positive, with significant opportunities for growth and innovation.
Rubber Carbon Black Market Segmentation
-
1. Application
- 1.1. Tires
- 1.2. Hoses
- 1.3. Belts
- 1.4. Gaskets
- 1.5. Vibration Control
- 1.6. Footwear
Rubber Carbon Black Market Segmentation By Geography
-
1. Asia Pacific
- 1.1. China
- 1.2. India
- 1.3. Japan
- 1.4. South Korea
- 1.5. Rest of Asia Pacific
-
2. North America
- 2.1. United States
- 2.2. Canada
- 2.3. Mexico
-
3. Europe
- 3.1. Germany
- 3.2. United Kingdom
- 3.3. Italy
- 3.4. Russia
- 3.5. France
- 3.6. Spain
- 3.7. Turkey
- 3.8. Rest of Europe
-
4. South America
- 4.1. Brazil
- 4.2. Argentina
- 4.3. Rest of South America
-
5. Middle East and Africa
- 5.1. Saudi Arabia
- 5.2. South Africa
- 5.3. Rest of Middle East and Africa
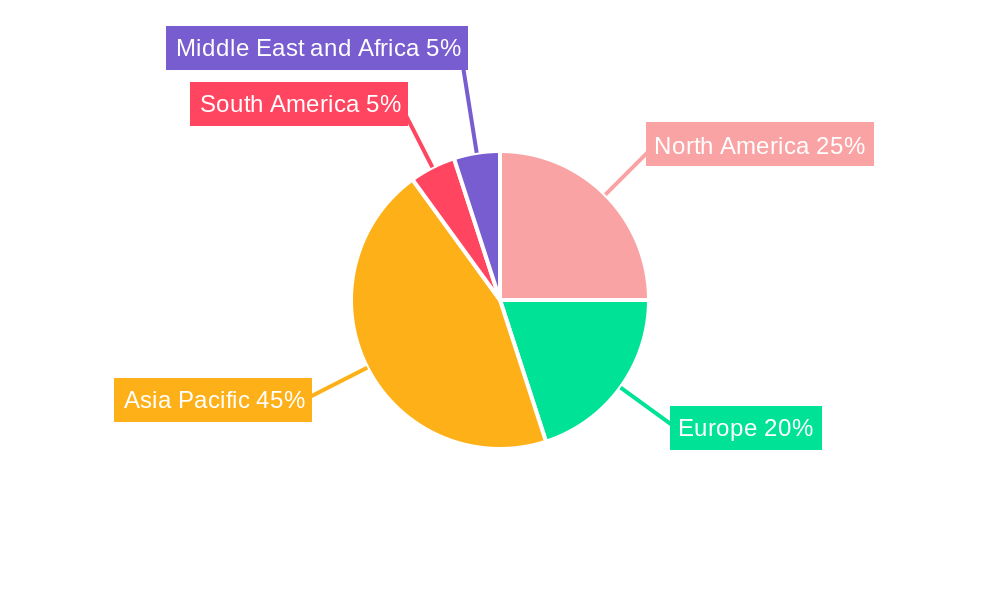
Rubber Carbon Black Market Regional Market Share
Geographic Coverage of Rubber Carbon Black Market
Rubber Carbon Black Market REPORT HIGHLIGHTS
| Aspects | Details |
|---|---|
| Study Period | 2020-2034 |
| Base Year | 2025 |
| Estimated Year | 2026 |
| Forecast Period | 2026-2034 |
| Historical Period | 2020-2025 |
| Growth Rate | CAGR of 5% from 2020-2034 |
| Segmentation |
|
Table of Contents
- 1. Introduction
- 1.1. Research Scope
- 1.2. Market Segmentation
- 1.3. Research Objective
- 1.4. Definitions and Assumptions
- 2. Executive Summary
- 2.1. Market Snapshot
- 3. Market Dynamics
- 3.1. Market Drivers
- 3.2. Market Restrains
- 3.3. Market Trends
- 3.4. Market Opportunities
- 4. Market Factor Analysis
- 4.1. Porters Five Forces
- 4.1.1. Bargaining Power of Suppliers
- 4.1.2. Bargaining Power of Buyers
- 4.1.3. Threat of New Entrants
- 4.1.4. Threat of Substitutes
- 4.1.5. Competitive Rivalry
- 4.2. PESTEL analysis
- 4.3. BCG Analysis
- 4.3.1. Stars (High Growth, High Market Share)
- 4.3.2. Cash Cows (Low Growth, High Market Share)
- 4.3.3. Question Mark (High Growth, Low Market Share)
- 4.3.4. Dogs (Low Growth, Low Market Share)
- 4.4. Ansoff Matrix Analysis
- 4.5. Supply Chain Analysis
- 4.6. Regulatory Landscape
- 4.7. Current Market Potential and Opportunity Assessment (TAM–SAM–SOM Framework)
- 4.8. RAX Analyst Note
- 4.1. Porters Five Forces
- 5. Market Analysis, Insights and Forecast 2021-2033
- 5.1. Market Analysis, Insights and Forecast - by Application
- 5.1.1. Tires
- 5.1.2. Hoses
- 5.1.3. Belts
- 5.1.4. Gaskets
- 5.1.5. Vibration Control
- 5.1.6. Footwear
- 5.2. Market Analysis, Insights and Forecast - by Region
- 5.2.1. Asia Pacific
- 5.2.2. North America
- 5.2.3. Europe
- 5.2.4. South America
- 5.2.5. Middle East and Africa
- 5.1. Market Analysis, Insights and Forecast - by Application
- 6. Global Rubber Carbon Black Market Analysis, Insights and Forecast, 2021-2033
- 6.1. Market Analysis, Insights and Forecast - by Application
- 6.1.1. Tires
- 6.1.2. Hoses
- 6.1.3. Belts
- 6.1.4. Gaskets
- 6.1.5. Vibration Control
- 6.1.6. Footwear
- 6.1. Market Analysis, Insights and Forecast - by Application
- 7. Asia Pacific Rubber Carbon Black Market Analysis, Insights and Forecast, 2020-2032
- 7.1. Market Analysis, Insights and Forecast - by Application
- 7.1.1. Tires
- 7.1.2. Hoses
- 7.1.3. Belts
- 7.1.4. Gaskets
- 7.1.5. Vibration Control
- 7.1.6. Footwear
- 7.1. Market Analysis, Insights and Forecast - by Application
- 8. North America Rubber Carbon Black Market Analysis, Insights and Forecast, 2020-2032
- 8.1. Market Analysis, Insights and Forecast - by Application
- 8.1.1. Tires
- 8.1.2. Hoses
- 8.1.3. Belts
- 8.1.4. Gaskets
- 8.1.5. Vibration Control
- 8.1.6. Footwear
- 8.1. Market Analysis, Insights and Forecast - by Application
- 9. Europe Rubber Carbon Black Market Analysis, Insights and Forecast, 2020-2032
- 9.1. Market Analysis, Insights and Forecast - by Application
- 9.1.1. Tires
- 9.1.2. Hoses
- 9.1.3. Belts
- 9.1.4. Gaskets
- 9.1.5. Vibration Control
- 9.1.6. Footwear
- 9.1. Market Analysis, Insights and Forecast - by Application
- 10. South America Rubber Carbon Black Market Analysis, Insights and Forecast, 2020-2032
- 10.1. Market Analysis, Insights and Forecast - by Application
- 10.1.1. Tires
- 10.1.2. Hoses
- 10.1.3. Belts
- 10.1.4. Gaskets
- 10.1.5. Vibration Control
- 10.1.6. Footwear
- 10.1. Market Analysis, Insights and Forecast - by Application
- 11. Middle East and Africa Rubber Carbon Black Market Analysis, Insights and Forecast, 2020-2032
- 11.1. Market Analysis, Insights and Forecast - by Application
- 11.1.1. Tires
- 11.1.2. Hoses
- 11.1.3. Belts
- 11.1.4. Gaskets
- 11.1.5. Vibration Control
- 11.1.6. Footwear
- 11.1. Market Analysis, Insights and Forecast - by Application
- 12. Competitive Analysis
- 12.1. Company Profiles
- 12.1.1 Tokai Carbon Co Ltd
- 12.1.1.1. Company Overview
- 12.1.1.2. Products
- 12.1.1.3. Company Financials
- 12.1.1.4. SWOT Analysis
- 12.1.2 Omsk Carbon Group
- 12.1.2.1. Company Overview
- 12.1.2.2. Products
- 12.1.2.3. Company Financials
- 12.1.2.4. SWOT Analysis
- 12.1.3 Mitsubishi Chemical Corporation
- 12.1.3.1. Company Overview
- 12.1.3.2. Products
- 12.1.3.3. Company Financials
- 12.1.3.4. SWOT Analysis
- 12.1.4 Orion Engineered Carbons GmbH
- 12.1.4.1. Company Overview
- 12.1.4.2. Products
- 12.1.4.3. Company Financials
- 12.1.4.4. SWOT Analysis
- 12.1.5 Jiangxi Black Cat Carbon Black Co Ltd
- 12.1.5.1. Company Overview
- 12.1.5.2. Products
- 12.1.5.3. Company Financials
- 12.1.5.4. SWOT Analysis
- 12.1.6 NNPC
- 12.1.6.1. Company Overview
- 12.1.6.2. Products
- 12.1.6.3. Company Financials
- 12.1.6.4. SWOT Analysis
- 12.1.7 ASAHI CARBON Co Ltd
- 12.1.7.1. Company Overview
- 12.1.7.2. Products
- 12.1.7.3. Company Financials
- 12.1.7.4. SWOT Analysis
- 12.1.8 Cabot Corporation
- 12.1.8.1. Company Overview
- 12.1.8.2. Products
- 12.1.8.3. Company Financials
- 12.1.8.4. SWOT Analysis
- 12.1.9 Himadri Speciality Chemical Ltd
- 12.1.9.1. Company Overview
- 12.1.9.2. Products
- 12.1.9.3. Company Financials
- 12.1.9.4. SWOT Analysis
- 12.1.10 Longxing Chemical Stock Co Ltd
- 12.1.10.1. Company Overview
- 12.1.10.2. Products
- 12.1.10.3. Company Financials
- 12.1.10.4. SWOT Analysis
- 12.1.11 International CSRC Investment Holdings Co Ltd
- 12.1.11.1. Company Overview
- 12.1.11.2. Products
- 12.1.11.3. Company Financials
- 12.1.11.4. SWOT Analysis
- 12.1.12 PCBL*List Not Exhaustive
- 12.1.12.1. Company Overview
- 12.1.12.2. Products
- 12.1.12.3. Company Financials
- 12.1.12.4. SWOT Analysis
- 12.1.13 OCI Company Ltd
- 12.1.13.1. Company Overview
- 12.1.13.2. Products
- 12.1.13.3. Company Financials
- 12.1.13.4. SWOT Analysis
- 12.1.14 Birla Carbon (Aditya Birla Group)
- 12.1.14.1. Company Overview
- 12.1.14.2. Products
- 12.1.14.3. Company Financials
- 12.1.14.4. SWOT Analysis
- 12.1.1 Tokai Carbon Co Ltd
- 12.2. Market Entropy
- 12.2.1 Company's Key Areas Served
- 12.2.2 Recent Developments
- 12.3. Company Market Share Analysis 2025
- 12.3.1 Top 5 Companies Market Share Analysis
- 12.3.2 Top 3 Companies Market Share Analysis
- 12.4. List of Potential Customers
- 13. Research Methodology
List of Figures
- Figure 1: Global Rubber Carbon Black Market Revenue Breakdown (billion, %) by Region 2025 & 2033
- Figure 2: Asia Pacific Rubber Carbon Black Market Revenue (billion), by Application 2025 & 2033
- Figure 3: Asia Pacific Rubber Carbon Black Market Revenue Share (%), by Application 2025 & 2033
- Figure 4: Asia Pacific Rubber Carbon Black Market Revenue (billion), by Country 2025 & 2033
- Figure 5: Asia Pacific Rubber Carbon Black Market Revenue Share (%), by Country 2025 & 2033
- Figure 6: North America Rubber Carbon Black Market Revenue (billion), by Application 2025 & 2033
- Figure 7: North America Rubber Carbon Black Market Revenue Share (%), by Application 2025 & 2033
- Figure 8: North America Rubber Carbon Black Market Revenue (billion), by Country 2025 & 2033
- Figure 9: North America Rubber Carbon Black Market Revenue Share (%), by Country 2025 & 2033
- Figure 10: Europe Rubber Carbon Black Market Revenue (billion), by Application 2025 & 2033
- Figure 11: Europe Rubber Carbon Black Market Revenue Share (%), by Application 2025 & 2033
- Figure 12: Europe Rubber Carbon Black Market Revenue (billion), by Country 2025 & 2033
- Figure 13: Europe Rubber Carbon Black Market Revenue Share (%), by Country 2025 & 2033
- Figure 14: South America Rubber Carbon Black Market Revenue (billion), by Application 2025 & 2033
- Figure 15: South America Rubber Carbon Black Market Revenue Share (%), by Application 2025 & 2033
- Figure 16: South America Rubber Carbon Black Market Revenue (billion), by Country 2025 & 2033
- Figure 17: South America Rubber Carbon Black Market Revenue Share (%), by Country 2025 & 2033
- Figure 18: Middle East and Africa Rubber Carbon Black Market Revenue (billion), by Application 2025 & 2033
- Figure 19: Middle East and Africa Rubber Carbon Black Market Revenue Share (%), by Application 2025 & 2033
- Figure 20: Middle East and Africa Rubber Carbon Black Market Revenue (billion), by Country 2025 & 2033
- Figure 21: Middle East and Africa Rubber Carbon Black Market Revenue Share (%), by Country 2025 & 2033
List of Tables
- Table 1: Global Rubber Carbon Black Market Revenue billion Forecast, by Application 2020 & 2033
- Table 2: Global Rubber Carbon Black Market Revenue billion Forecast, by Region 2020 & 2033
- Table 3: Global Rubber Carbon Black Market Revenue billion Forecast, by Application 2020 & 2033
- Table 4: Global Rubber Carbon Black Market Revenue billion Forecast, by Country 2020 & 2033
- Table 5: China Rubber Carbon Black Market Revenue (billion) Forecast, by Application 2020 & 2033
- Table 6: India Rubber Carbon Black Market Revenue (billion) Forecast, by Application 2020 & 2033
- Table 7: Japan Rubber Carbon Black Market Revenue (billion) Forecast, by Application 2020 & 2033
- Table 8: South Korea Rubber Carbon Black Market Revenue (billion) Forecast, by Application 2020 & 2033
- Table 9: Rest of Asia Pacific Rubber Carbon Black Market Revenue (billion) Forecast, by Application 2020 & 2033
- Table 10: Global Rubber Carbon Black Market Revenue billion Forecast, by Application 2020 & 2033
- Table 11: Global Rubber Carbon Black Market Revenue billion Forecast, by Country 2020 & 2033
- Table 12: United States Rubber Carbon Black Market Revenue (billion) Forecast, by Application 2020 & 2033
- Table 13: Canada Rubber Carbon Black Market Revenue (billion) Forecast, by Application 2020 & 2033
- Table 14: Mexico Rubber Carbon Black Market Revenue (billion) Forecast, by Application 2020 & 2033
- Table 15: Global Rubber Carbon Black Market Revenue billion Forecast, by Application 2020 & 2033
- Table 16: Global Rubber Carbon Black Market Revenue billion Forecast, by Country 2020 & 2033
- Table 17: Germany Rubber Carbon Black Market Revenue (billion) Forecast, by Application 2020 & 2033
- Table 18: United Kingdom Rubber Carbon Black Market Revenue (billion) Forecast, by Application 2020 & 2033
- Table 19: Italy Rubber Carbon Black Market Revenue (billion) Forecast, by Application 2020 & 2033
- Table 20: Russia Rubber Carbon Black Market Revenue (billion) Forecast, by Application 2020 & 2033
- Table 21: France Rubber Carbon Black Market Revenue (billion) Forecast, by Application 2020 & 2033
- Table 22: Spain Rubber Carbon Black Market Revenue (billion) Forecast, by Application 2020 & 2033
- Table 23: Turkey Rubber Carbon Black Market Revenue (billion) Forecast, by Application 2020 & 2033
- Table 24: Rest of Europe Rubber Carbon Black Market Revenue (billion) Forecast, by Application 2020 & 2033
- Table 25: Global Rubber Carbon Black Market Revenue billion Forecast, by Application 2020 & 2033
- Table 26: Global Rubber Carbon Black Market Revenue billion Forecast, by Country 2020 & 2033
- Table 27: Brazil Rubber Carbon Black Market Revenue (billion) Forecast, by Application 2020 & 2033
- Table 28: Argentina Rubber Carbon Black Market Revenue (billion) Forecast, by Application 2020 & 2033
- Table 29: Rest of South America Rubber Carbon Black Market Revenue (billion) Forecast, by Application 2020 & 2033
- Table 30: Global Rubber Carbon Black Market Revenue billion Forecast, by Application 2020 & 2033
- Table 31: Global Rubber Carbon Black Market Revenue billion Forecast, by Country 2020 & 2033
- Table 32: Saudi Arabia Rubber Carbon Black Market Revenue (billion) Forecast, by Application 2020 & 2033
- Table 33: South Africa Rubber Carbon Black Market Revenue (billion) Forecast, by Application 2020 & 2033
- Table 34: Rest of Middle East and Africa Rubber Carbon Black Market Revenue (billion) Forecast, by Application 2020 & 2033
Frequently Asked Questions
1. What is the projected Compound Annual Growth Rate (CAGR) of the Rubber Carbon Black Market?
The projected CAGR is approximately 5%.
2. Which companies are prominent players in the Rubber Carbon Black Market?
Key companies in the market include Tokai Carbon Co Ltd, Omsk Carbon Group, Mitsubishi Chemical Corporation, Orion Engineered Carbons GmbH, Jiangxi Black Cat Carbon Black Co Ltd, NNPC, ASAHI CARBON Co Ltd, Cabot Corporation, Himadri Speciality Chemical Ltd, Longxing Chemical Stock Co Ltd, International CSRC Investment Holdings Co Ltd, PCBL*List Not Exhaustive, OCI Company Ltd, Birla Carbon (Aditya Birla Group).
3. What are the main segments of the Rubber Carbon Black Market?
The market segments include Application.
4. Can you provide details about the market size?
The market size is estimated to be USD 24.5 billion as of 2022.
5. What are some drivers contributing to market growth?
Increasing Demand for Automotive Tires; Increasing Demand for Carbon Black in Industrial Rubber Applications.
6. What are the notable trends driving market growth?
Increasing Demand for Automotive Tires.
7. Are there any restraints impacting market growth?
Fluctuation In Prices of Oil Derived Feedstocks Used for Carbon Black Manufacturing; Increasing Use of Green Tires; Growing Environmental Concerns Regarding Emissions of Harmful Particulate Matter During The Production Of Carbon Black.
8. Can you provide examples of recent developments in the market?
In March 2022, Orion Engineered Carbon started commercial sales from its new carbon black production site in Ravenna, Italy. The site produces technical rubber carbon blacks for the European market and has a production capacity of 25,000 tons.
9. What pricing options are available for accessing the report?
Pricing options include single-user, multi-user, and enterprise licenses priced at USD 4750, USD 5250, and USD 8750 respectively.
10. Is the market size provided in terms of value or volume?
The market size is provided in terms of value, measured in billion.
11. Are there any specific market keywords associated with the report?
Yes, the market keyword associated with the report is "Rubber Carbon Black Market," which aids in identifying and referencing the specific market segment covered.
12. How do I determine which pricing option suits my needs best?
The pricing options vary based on user requirements and access needs. Individual users may opt for single-user licenses, while businesses requiring broader access may choose multi-user or enterprise licenses for cost-effective access to the report.
13. Are there any additional resources or data provided in the Rubber Carbon Black Market report?
While the report offers comprehensive insights, it's advisable to review the specific contents or supplementary materials provided to ascertain if additional resources or data are available.
14. How can I stay updated on further developments or reports in the Rubber Carbon Black Market?
To stay informed about further developments, trends, and reports in the Rubber Carbon Black Market, consider subscribing to industry newsletters, following relevant companies and organizations, or regularly checking reputable industry news sources and publications.
Methodology
Step 1 - Identification of Relevant Samples Size from Population Database


Step 2 - Approaches for Defining Global Market Size (Value, Volume* & Price*)

Note*: In applicable scenarios
Step 3 - Data Sources
Primary Research
- Web Analytics
- Survey Reports
- Research Institute
- Latest Research Reports
- Opinion Leaders
Secondary Research
- Annual Reports
- White Paper
- Latest Press Release
- Industry Association
- Paid Database
- Investor Presentations

Step 4 - Data Triangulation
Involves using different sources of information in order to increase the validity of a study
These sources are likely to be stakeholders in a program - participants, other researchers, program staff, other community members, and so on.
Then we put all data in single framework & apply various statistical tools to find out the dynamic on the market.
During the analysis stage, feedback from the stakeholder groups would be compared to determine areas of agreement as well as areas of divergence