

Key Insights
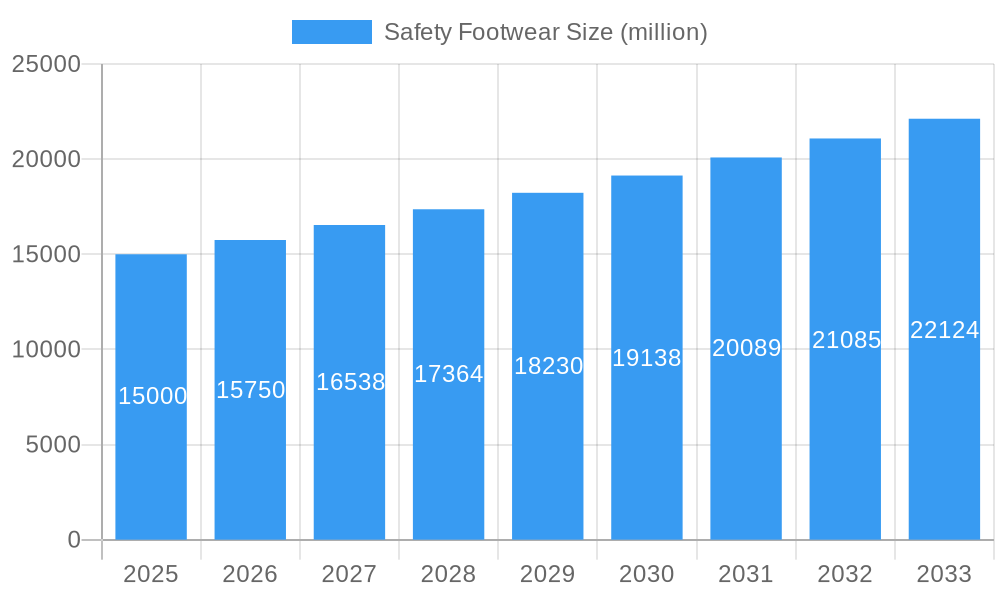
The global safety footwear market is experiencing robust growth, driven by increasing industrialization, stringent workplace safety regulations, and rising awareness of occupational hazards. The market, estimated at $15 billion in 2025, is projected to maintain a Compound Annual Growth Rate (CAGR) of 5% from 2025 to 2033, reaching approximately $22 billion by 2033. This growth is fueled by several key factors. Firstly, the construction, manufacturing, and oil & gas sectors, major consumers of safety footwear, are experiencing steady expansion globally. Secondly, advancements in safety footwear technology, including improved materials (e.g., lighter, more durable composites), enhanced protective features (e.g., metatarsal guards, puncture-resistant soles), and ergonomic designs, are driving demand. Finally, growing government regulations mandating the use of safety footwear in various industries are significantly impacting market growth. Competitive pressures among established players like Jallatte S.A.S, Dunlop Boots, and Wolverine, alongside the emergence of innovative smaller companies, are shaping market dynamics, with a focus on cost optimization and product differentiation.
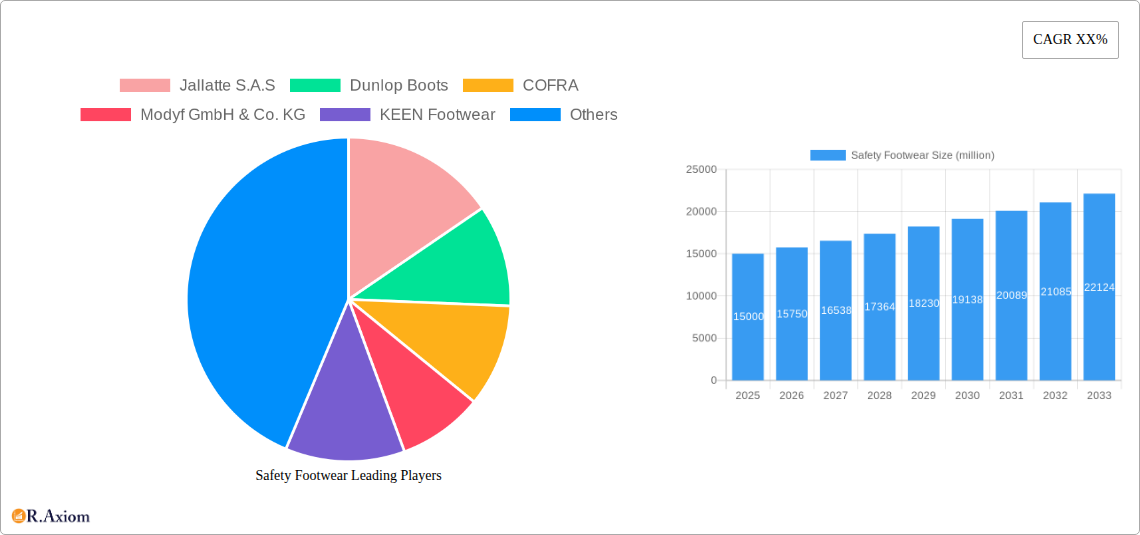
Safety Footwear Market Size (In Billion)
However, certain restraints are also present. Fluctuations in raw material prices, particularly those of polymers and metals, can affect production costs and profitability. Economic downturns can also reduce demand, especially in sectors sensitive to economic cycles. Furthermore, the availability of counterfeit and substandard safety footwear poses a challenge, impacting consumer trust and potentially leading to workplace accidents. To overcome these challenges, manufacturers are focusing on sustainable and ethical sourcing, innovative marketing strategies to highlight product quality and safety features, and robust distribution networks to reach a wider range of customers. Market segmentation based on footwear type (e.g., steel-toe, composite-toe), end-user industry, and geographic region further reveals significant variations in growth rates and market share, presenting opportunities for targeted market penetration strategies.
Safety Footwear Company Market Share
This comprehensive report provides a detailed analysis of the global safety footwear market, covering the period from 2019 to 2033. With a base year of 2025 and an estimated year of 2025, the report offers invaluable insights into market trends, growth drivers, challenges, and opportunities, enabling stakeholders to make informed strategic decisions. The market size is projected to reach xx million USD by 2033, exhibiting a CAGR of xx% during the forecast period (2025-2033). This report analyzes key players, including Jallatte S.A.S, Dunlop Boots, COFRA, Modyf GmbH & Co. KG, KEEN Footwear, Rahman Group, Rock Fall, CLUTE S.A, V.F., WOLVERINE, Bova Safety Footwear, Gabri Safety Shoes, Simon, Anbu Safety Industrial, CANIS SAFETY, RAW-POL, BORDER PPE TRADING LLC, SOYUZSPECODEZHDA LTD, Walker Footwear Industries, and Bata Industrials, offering a granular view of market dynamics and competitive landscape.
Safety Footwear Market Concentration & Innovation
This section analyzes the market concentration, innovation drivers, regulatory frameworks, product substitutes, end-user trends, and M&A activities within the safety footwear industry. The market is moderately concentrated, with the top five players holding approximately xx% of the global market share in 2025. Innovation is driven by advancements in materials science (e.g., lighter, stronger composites), ergonomic design, and smart technology integration (e.g., sensors for worker safety monitoring). Stringent safety regulations across various industries are a significant driver, while the availability of substitute products (e.g., regular work boots) presents a challenge. End-user trends indicate a growing preference for comfortable, lightweight, and technologically advanced safety footwear. M&A activity in the sector is moderate, with xx million USD worth of deals recorded between 2019 and 2024. Key metrics observed include:
- Market Share Concentration: Top 5 players hold xx% in 2025.
- M&A Deal Value (2019-2024): xx million USD.
- Key Innovation Drivers: Advanced materials, ergonomic design, smart technology.
- Regulatory Impact: Stringent safety standards drive demand for compliant footwear.
Safety Footwear Industry Trends & Insights
The global safety footwear market is experiencing robust growth, fueled by several key factors. The construction, manufacturing, and oil & gas sectors are major contributors, driving demand for specialized safety footwear. Technological disruptions, such as the integration of smart sensors and advanced materials, are transforming the industry, offering enhanced safety and comfort. Consumer preferences are shifting towards lightweight, durable, and aesthetically pleasing safety footwear. Competitive dynamics are intense, with companies focusing on product differentiation, technological innovation, and brand building. The market exhibited a CAGR of xx% during the historical period (2019-2024) and is projected to maintain a healthy growth trajectory in the forecast period. Market penetration of advanced safety features like composite toes and puncture-resistant midsoles is increasing steadily.
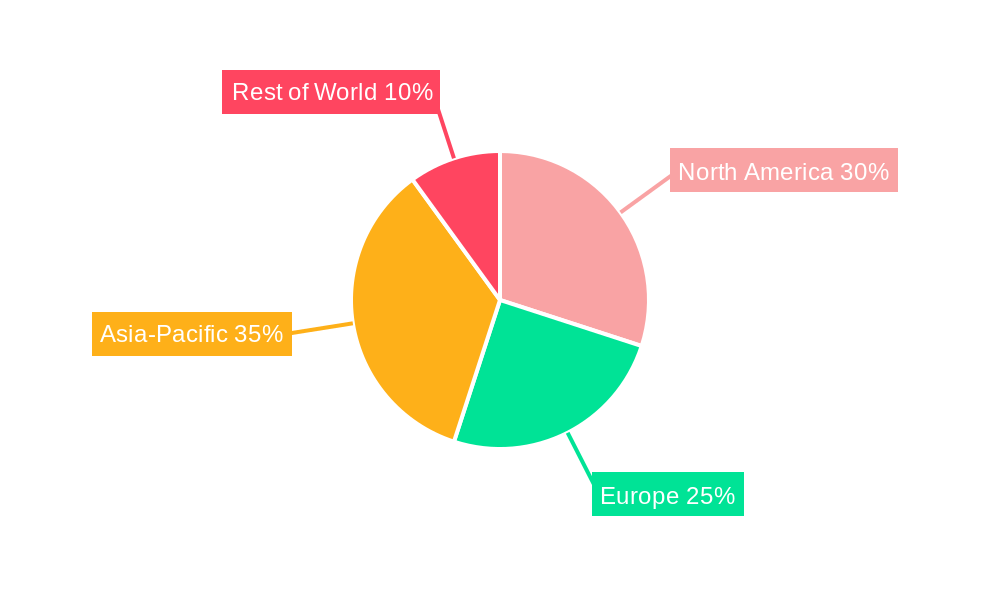
Dominant Markets & Segments in Safety Footwear
The North American region holds a dominant position in the global safety footwear market, driven by robust construction and manufacturing sectors and a high level of safety consciousness. Key drivers in this region include stringent workplace safety regulations and a strong emphasis on worker protection. Other significant markets include Europe and Asia-Pacific, though North America continues to maintain a leading market share.
North America Dominance:
- Stringent safety regulations
- Strong construction and manufacturing sectors
- High worker safety awareness
Europe and Asia-Pacific: Significant but secondary market share compared to North America.
Safety Footwear Product Developments
Recent innovations in safety footwear focus on lighter, more comfortable designs using advanced materials like carbon fiber and high-performance polymers. These materials offer superior protection while reducing weight and improving flexibility. New applications are emerging in specialized sectors, such as healthcare and the food industry, where specific hygiene and safety requirements are paramount. These advancements provide significant competitive advantages, appealing to workers seeking improved comfort and safety without sacrificing protection.
Report Scope & Segmentation Analysis
This report segments the safety footwear market based on product type (e.g., steel toe, composite toe, metatarsal guard), end-use industry (e.g., construction, manufacturing, oil & gas), and region (e.g., North America, Europe, Asia-Pacific). Each segment's growth projections, market size, and competitive dynamics are analyzed in detail. The market is expected to experience significant growth across all segments, driven by factors like increasing industrialization and stringent safety regulations.
Key Drivers of Safety Footwear Growth
Several factors drive the growth of the safety footwear market:
- Stringent Safety Regulations: Governments worldwide are implementing stricter safety standards, mandating the use of safety footwear in various industries.
- Industrialization and Construction Boom: Rapid industrialization and infrastructure development in emerging economies fuel demand for safety footwear.
- Technological Advancements: Innovations in materials science and design are leading to lighter, more comfortable, and durable safety footwear.
Challenges in the Safety Footwear Sector
The safety footwear sector faces several challenges:
- Supply Chain Disruptions: Global supply chain disruptions can impact the availability of raw materials and manufacturing capacity, affecting production and pricing.
- Intense Competition: The market is highly competitive, with numerous players vying for market share, requiring continuous innovation and cost optimization.
- Economic Fluctuations: Economic downturns can reduce demand for safety footwear, particularly in industries sensitive to economic cycles.
Emerging Opportunities in Safety Footwear
The market presents several promising opportunities:
- Smart Safety Footwear: Integration of sensors and tracking technologies for enhanced worker safety and monitoring.
- Sustainable Materials: Growing demand for eco-friendly and sustainable materials in safety footwear production.
- Expansion in Emerging Markets: Untapped potential in developing economies with growing industrialization and construction activities.
Leading Players in the Safety Footwear Market
- Jallatte S.A.S
- Dunlop Boots
- COFRA
- Modyf GmbH & Co. KG
- KEEN Footwear
- Rahman Group
- Rock Fall
- CLUTE S.A
- V.F.
- WOLVERINE
- Bova Safety Footwear
- Gabri Safety Shoes
- Simon
- Anbu Safety Industrial
- CANIS SAFETY
- RAW-POL
- BORDER PPE TRADING LLC
- SOYUZSPECODEZHDA LTD
- Walker Footwear Industries
- Bata Industrials
Key Developments in Safety Footwear Industry
- 2022 Q3: Launch of a new line of lightweight composite-toe safety boots by a major player.
- 2021 Q4: Acquisition of a smaller safety footwear manufacturer by a large multinational company.
- 2020 Q1: Introduction of new safety standards and regulations impacting the industry.
Strategic Outlook for Safety Footwear Market
The global safety footwear market is poised for continued growth, driven by technological advancements, stringent safety regulations, and the expansion of key industries. Opportunities exist in developing smart safety footwear, sustainable materials, and penetrating new and emerging markets. Companies adopting innovative strategies, focusing on product differentiation and sustainability, are best positioned to capitalize on future market growth.
Safety Footwear Segmentation
-
1. Application
- 1.1. Construction
- 1.2. Manufacturing
- 1.3. Oil & Gas
- 1.4. Chemicals
- 1.5. Mining
- 1.6. Agriculture
- 1.7. Food
- 1.8. Other
-
2. Types
- 2.1. Puncture Resistant Shoes
- 2.2. Slip Resistant Shoes
- 2.3. Antistatic Protection Shoes
- 2.4. Water Resistant Shoes
- 2.5. Heat Resistant Shoes
- 2.6. Other
Safety Footwear Segmentation By Geography
-
1. North America
- 1.1. United States
- 1.2. Canada
- 1.3. Mexico
-
2. South America
- 2.1. Brazil
- 2.2. Argentina
- 2.3. Rest of South America
-
3. Europe
- 3.1. United Kingdom
- 3.2. Germany
- 3.3. France
- 3.4. Italy
- 3.5. Spain
- 3.6. Russia
- 3.7. Benelux
- 3.8. Nordics
- 3.9. Rest of Europe
-
4. Middle East & Africa
- 4.1. Turkey
- 4.2. Israel
- 4.3. GCC
- 4.4. North Africa
- 4.5. South Africa
- 4.6. Rest of Middle East & Africa
-
5. Asia Pacific
- 5.1. China
- 5.2. India
- 5.3. Japan
- 5.4. South Korea
- 5.5. ASEAN
- 5.6. Oceania
- 5.7. Rest of Asia Pacific
Safety Footwear Regional Market Share
Geographic Coverage of Safety Footwear
Safety Footwear REPORT HIGHLIGHTS
| Aspects | Details |
|---|---|
| Study Period | 2020-2034 |
| Base Year | 2025 |
| Estimated Year | 2026 |
| Forecast Period | 2026-2034 |
| Historical Period | 2020-2025 |
| Growth Rate | CAGR of 9% from 2020-2034 |
| Segmentation |
|
Table of Contents
- 1. Introduction
- 1.1. Research Scope
- 1.2. Market Segmentation
- 1.3. Research Methodology
- 1.4. Definitions and Assumptions
- 2. Executive Summary
- 2.1. Introduction
- 3. Market Dynamics
- 3.1. Introduction
- 3.2. Market Drivers
- 3.3. Market Restrains
- 3.4. Market Trends
- 4. Market Factor Analysis
- 4.1. Porters Five Forces
- 4.2. Supply/Value Chain
- 4.3. PESTEL analysis
- 4.4. Market Entropy
- 4.5. Patent/Trademark Analysis
- 5. Global Safety Footwear Analysis, Insights and Forecast, 2020-2032
- 5.1. Market Analysis, Insights and Forecast - by Application
- 5.1.1. Construction
- 5.1.2. Manufacturing
- 5.1.3. Oil & Gas
- 5.1.4. Chemicals
- 5.1.5. Mining
- 5.1.6. Agriculture
- 5.1.7. Food
- 5.1.8. Other
- 5.2. Market Analysis, Insights and Forecast - by Types
- 5.2.1. Puncture Resistant Shoes
- 5.2.2. Slip Resistant Shoes
- 5.2.3. Antistatic Protection Shoes
- 5.2.4. Water Resistant Shoes
- 5.2.5. Heat Resistant Shoes
- 5.2.6. Other
- 5.3. Market Analysis, Insights and Forecast - by Region
- 5.3.1. North America
- 5.3.2. South America
- 5.3.3. Europe
- 5.3.4. Middle East & Africa
- 5.3.5. Asia Pacific
- 5.1. Market Analysis, Insights and Forecast - by Application
- 6. North America Safety Footwear Analysis, Insights and Forecast, 2020-2032
- 6.1. Market Analysis, Insights and Forecast - by Application
- 6.1.1. Construction
- 6.1.2. Manufacturing
- 6.1.3. Oil & Gas
- 6.1.4. Chemicals
- 6.1.5. Mining
- 6.1.6. Agriculture
- 6.1.7. Food
- 6.1.8. Other
- 6.2. Market Analysis, Insights and Forecast - by Types
- 6.2.1. Puncture Resistant Shoes
- 6.2.2. Slip Resistant Shoes
- 6.2.3. Antistatic Protection Shoes
- 6.2.4. Water Resistant Shoes
- 6.2.5. Heat Resistant Shoes
- 6.2.6. Other
- 6.1. Market Analysis, Insights and Forecast - by Application
- 7. South America Safety Footwear Analysis, Insights and Forecast, 2020-2032
- 7.1. Market Analysis, Insights and Forecast - by Application
- 7.1.1. Construction
- 7.1.2. Manufacturing
- 7.1.3. Oil & Gas
- 7.1.4. Chemicals
- 7.1.5. Mining
- 7.1.6. Agriculture
- 7.1.7. Food
- 7.1.8. Other
- 7.2. Market Analysis, Insights and Forecast - by Types
- 7.2.1. Puncture Resistant Shoes
- 7.2.2. Slip Resistant Shoes
- 7.2.3. Antistatic Protection Shoes
- 7.2.4. Water Resistant Shoes
- 7.2.5. Heat Resistant Shoes
- 7.2.6. Other
- 7.1. Market Analysis, Insights and Forecast - by Application
- 8. Europe Safety Footwear Analysis, Insights and Forecast, 2020-2032
- 8.1. Market Analysis, Insights and Forecast - by Application
- 8.1.1. Construction
- 8.1.2. Manufacturing
- 8.1.3. Oil & Gas
- 8.1.4. Chemicals
- 8.1.5. Mining
- 8.1.6. Agriculture
- 8.1.7. Food
- 8.1.8. Other
- 8.2. Market Analysis, Insights and Forecast - by Types
- 8.2.1. Puncture Resistant Shoes
- 8.2.2. Slip Resistant Shoes
- 8.2.3. Antistatic Protection Shoes
- 8.2.4. Water Resistant Shoes
- 8.2.5. Heat Resistant Shoes
- 8.2.6. Other
- 8.1. Market Analysis, Insights and Forecast - by Application
- 9. Middle East & Africa Safety Footwear Analysis, Insights and Forecast, 2020-2032
- 9.1. Market Analysis, Insights and Forecast - by Application
- 9.1.1. Construction
- 9.1.2. Manufacturing
- 9.1.3. Oil & Gas
- 9.1.4. Chemicals
- 9.1.5. Mining
- 9.1.6. Agriculture
- 9.1.7. Food
- 9.1.8. Other
- 9.2. Market Analysis, Insights and Forecast - by Types
- 9.2.1. Puncture Resistant Shoes
- 9.2.2. Slip Resistant Shoes
- 9.2.3. Antistatic Protection Shoes
- 9.2.4. Water Resistant Shoes
- 9.2.5. Heat Resistant Shoes
- 9.2.6. Other
- 9.1. Market Analysis, Insights and Forecast - by Application
- 10. Asia Pacific Safety Footwear Analysis, Insights and Forecast, 2020-2032
- 10.1. Market Analysis, Insights and Forecast - by Application
- 10.1.1. Construction
- 10.1.2. Manufacturing
- 10.1.3. Oil & Gas
- 10.1.4. Chemicals
- 10.1.5. Mining
- 10.1.6. Agriculture
- 10.1.7. Food
- 10.1.8. Other
- 10.2. Market Analysis, Insights and Forecast - by Types
- 10.2.1. Puncture Resistant Shoes
- 10.2.2. Slip Resistant Shoes
- 10.2.3. Antistatic Protection Shoes
- 10.2.4. Water Resistant Shoes
- 10.2.5. Heat Resistant Shoes
- 10.2.6. Other
- 10.1. Market Analysis, Insights and Forecast - by Application
- 11. Competitive Analysis
- 11.1. Global Market Share Analysis 2025
- 11.2. Company Profiles
- 11.2.1 Jallatte S.A.S
- 11.2.1.1. Overview
- 11.2.1.2. Products
- 11.2.1.3. SWOT Analysis
- 11.2.1.4. Recent Developments
- 11.2.1.5. Financials (Based on Availability)
- 11.2.2 Dunlop Boots
- 11.2.2.1. Overview
- 11.2.2.2. Products
- 11.2.2.3. SWOT Analysis
- 11.2.2.4. Recent Developments
- 11.2.2.5. Financials (Based on Availability)
- 11.2.3 COFRA
- 11.2.3.1. Overview
- 11.2.3.2. Products
- 11.2.3.3. SWOT Analysis
- 11.2.3.4. Recent Developments
- 11.2.3.5. Financials (Based on Availability)
- 11.2.4 Modyf GmbH & Co. KG
- 11.2.4.1. Overview
- 11.2.4.2. Products
- 11.2.4.3. SWOT Analysis
- 11.2.4.4. Recent Developments
- 11.2.4.5. Financials (Based on Availability)
- 11.2.5 KEEN Footwear
- 11.2.5.1. Overview
- 11.2.5.2. Products
- 11.2.5.3. SWOT Analysis
- 11.2.5.4. Recent Developments
- 11.2.5.5. Financials (Based on Availability)
- 11.2.6 Rahman Group
- 11.2.6.1. Overview
- 11.2.6.2. Products
- 11.2.6.3. SWOT Analysis
- 11.2.6.4. Recent Developments
- 11.2.6.5. Financials (Based on Availability)
- 11.2.7 Rock Fall
- 11.2.7.1. Overview
- 11.2.7.2. Products
- 11.2.7.3. SWOT Analysis
- 11.2.7.4. Recent Developments
- 11.2.7.5. Financials (Based on Availability)
- 11.2.8 CLUTE S.A
- 11.2.8.1. Overview
- 11.2.8.2. Products
- 11.2.8.3. SWOT Analysis
- 11.2.8.4. Recent Developments
- 11.2.8.5. Financials (Based on Availability)
- 11.2.9 V.F.
- 11.2.9.1. Overview
- 11.2.9.2. Products
- 11.2.9.3. SWOT Analysis
- 11.2.9.4. Recent Developments
- 11.2.9.5. Financials (Based on Availability)
- 11.2.10 WOLVERINE
- 11.2.10.1. Overview
- 11.2.10.2. Products
- 11.2.10.3. SWOT Analysis
- 11.2.10.4. Recent Developments
- 11.2.10.5. Financials (Based on Availability)
- 11.2.11 Bova Safety Footwear
- 11.2.11.1. Overview
- 11.2.11.2. Products
- 11.2.11.3. SWOT Analysis
- 11.2.11.4. Recent Developments
- 11.2.11.5. Financials (Based on Availability)
- 11.2.12 Gabri Safety Shoes
- 11.2.12.1. Overview
- 11.2.12.2. Products
- 11.2.12.3. SWOT Analysis
- 11.2.12.4. Recent Developments
- 11.2.12.5. Financials (Based on Availability)
- 11.2.13 Simon
- 11.2.13.1. Overview
- 11.2.13.2. Products
- 11.2.13.3. SWOT Analysis
- 11.2.13.4. Recent Developments
- 11.2.13.5. Financials (Based on Availability)
- 11.2.14 Anbu Safety Industrial
- 11.2.14.1. Overview
- 11.2.14.2. Products
- 11.2.14.3. SWOT Analysis
- 11.2.14.4. Recent Developments
- 11.2.14.5. Financials (Based on Availability)
- 11.2.15 CANIS SAFETY
- 11.2.15.1. Overview
- 11.2.15.2. Products
- 11.2.15.3. SWOT Analysis
- 11.2.15.4. Recent Developments
- 11.2.15.5. Financials (Based on Availability)
- 11.2.16 RAW- POL
- 11.2.16.1. Overview
- 11.2.16.2. Products
- 11.2.16.3. SWOT Analysis
- 11.2.16.4. Recent Developments
- 11.2.16.5. Financials (Based on Availability)
- 11.2.17 BORDER PPE TRADING LLC
- 11.2.17.1. Overview
- 11.2.17.2. Products
- 11.2.17.3. SWOT Analysis
- 11.2.17.4. Recent Developments
- 11.2.17.5. Financials (Based on Availability)
- 11.2.18 SOYUZSPECODEZHDA LTD
- 11.2.18.1. Overview
- 11.2.18.2. Products
- 11.2.18.3. SWOT Analysis
- 11.2.18.4. Recent Developments
- 11.2.18.5. Financials (Based on Availability)
- 11.2.19 Walker Footwear Industries
- 11.2.19.1. Overview
- 11.2.19.2. Products
- 11.2.19.3. SWOT Analysis
- 11.2.19.4. Recent Developments
- 11.2.19.5. Financials (Based on Availability)
- 11.2.20 Bata Industrials
- 11.2.20.1. Overview
- 11.2.20.2. Products
- 11.2.20.3. SWOT Analysis
- 11.2.20.4. Recent Developments
- 11.2.20.5. Financials (Based on Availability)
- 11.2.1 Jallatte S.A.S
List of Figures
- Figure 1: Global Safety Footwear Revenue Breakdown (undefined, %) by Region 2025 & 2033
- Figure 2: Global Safety Footwear Volume Breakdown (K, %) by Region 2025 & 2033
- Figure 3: North America Safety Footwear Revenue (undefined), by Application 2025 & 2033
- Figure 4: North America Safety Footwear Volume (K), by Application 2025 & 2033
- Figure 5: North America Safety Footwear Revenue Share (%), by Application 2025 & 2033
- Figure 6: North America Safety Footwear Volume Share (%), by Application 2025 & 2033
- Figure 7: North America Safety Footwear Revenue (undefined), by Types 2025 & 2033
- Figure 8: North America Safety Footwear Volume (K), by Types 2025 & 2033
- Figure 9: North America Safety Footwear Revenue Share (%), by Types 2025 & 2033
- Figure 10: North America Safety Footwear Volume Share (%), by Types 2025 & 2033
- Figure 11: North America Safety Footwear Revenue (undefined), by Country 2025 & 2033
- Figure 12: North America Safety Footwear Volume (K), by Country 2025 & 2033
- Figure 13: North America Safety Footwear Revenue Share (%), by Country 2025 & 2033
- Figure 14: North America Safety Footwear Volume Share (%), by Country 2025 & 2033
- Figure 15: South America Safety Footwear Revenue (undefined), by Application 2025 & 2033
- Figure 16: South America Safety Footwear Volume (K), by Application 2025 & 2033
- Figure 17: South America Safety Footwear Revenue Share (%), by Application 2025 & 2033
- Figure 18: South America Safety Footwear Volume Share (%), by Application 2025 & 2033
- Figure 19: South America Safety Footwear Revenue (undefined), by Types 2025 & 2033
- Figure 20: South America Safety Footwear Volume (K), by Types 2025 & 2033
- Figure 21: South America Safety Footwear Revenue Share (%), by Types 2025 & 2033
- Figure 22: South America Safety Footwear Volume Share (%), by Types 2025 & 2033
- Figure 23: South America Safety Footwear Revenue (undefined), by Country 2025 & 2033
- Figure 24: South America Safety Footwear Volume (K), by Country 2025 & 2033
- Figure 25: South America Safety Footwear Revenue Share (%), by Country 2025 & 2033
- Figure 26: South America Safety Footwear Volume Share (%), by Country 2025 & 2033
- Figure 27: Europe Safety Footwear Revenue (undefined), by Application 2025 & 2033
- Figure 28: Europe Safety Footwear Volume (K), by Application 2025 & 2033
- Figure 29: Europe Safety Footwear Revenue Share (%), by Application 2025 & 2033
- Figure 30: Europe Safety Footwear Volume Share (%), by Application 2025 & 2033
- Figure 31: Europe Safety Footwear Revenue (undefined), by Types 2025 & 2033
- Figure 32: Europe Safety Footwear Volume (K), by Types 2025 & 2033
- Figure 33: Europe Safety Footwear Revenue Share (%), by Types 2025 & 2033
- Figure 34: Europe Safety Footwear Volume Share (%), by Types 2025 & 2033
- Figure 35: Europe Safety Footwear Revenue (undefined), by Country 2025 & 2033
- Figure 36: Europe Safety Footwear Volume (K), by Country 2025 & 2033
- Figure 37: Europe Safety Footwear Revenue Share (%), by Country 2025 & 2033
- Figure 38: Europe Safety Footwear Volume Share (%), by Country 2025 & 2033
- Figure 39: Middle East & Africa Safety Footwear Revenue (undefined), by Application 2025 & 2033
- Figure 40: Middle East & Africa Safety Footwear Volume (K), by Application 2025 & 2033
- Figure 41: Middle East & Africa Safety Footwear Revenue Share (%), by Application 2025 & 2033
- Figure 42: Middle East & Africa Safety Footwear Volume Share (%), by Application 2025 & 2033
- Figure 43: Middle East & Africa Safety Footwear Revenue (undefined), by Types 2025 & 2033
- Figure 44: Middle East & Africa Safety Footwear Volume (K), by Types 2025 & 2033
- Figure 45: Middle East & Africa Safety Footwear Revenue Share (%), by Types 2025 & 2033
- Figure 46: Middle East & Africa Safety Footwear Volume Share (%), by Types 2025 & 2033
- Figure 47: Middle East & Africa Safety Footwear Revenue (undefined), by Country 2025 & 2033
- Figure 48: Middle East & Africa Safety Footwear Volume (K), by Country 2025 & 2033
- Figure 49: Middle East & Africa Safety Footwear Revenue Share (%), by Country 2025 & 2033
- Figure 50: Middle East & Africa Safety Footwear Volume Share (%), by Country 2025 & 2033
- Figure 51: Asia Pacific Safety Footwear Revenue (undefined), by Application 2025 & 2033
- Figure 52: Asia Pacific Safety Footwear Volume (K), by Application 2025 & 2033
- Figure 53: Asia Pacific Safety Footwear Revenue Share (%), by Application 2025 & 2033
- Figure 54: Asia Pacific Safety Footwear Volume Share (%), by Application 2025 & 2033
- Figure 55: Asia Pacific Safety Footwear Revenue (undefined), by Types 2025 & 2033
- Figure 56: Asia Pacific Safety Footwear Volume (K), by Types 2025 & 2033
- Figure 57: Asia Pacific Safety Footwear Revenue Share (%), by Types 2025 & 2033
- Figure 58: Asia Pacific Safety Footwear Volume Share (%), by Types 2025 & 2033
- Figure 59: Asia Pacific Safety Footwear Revenue (undefined), by Country 2025 & 2033
- Figure 60: Asia Pacific Safety Footwear Volume (K), by Country 2025 & 2033
- Figure 61: Asia Pacific Safety Footwear Revenue Share (%), by Country 2025 & 2033
- Figure 62: Asia Pacific Safety Footwear Volume Share (%), by Country 2025 & 2033
List of Tables
- Table 1: Global Safety Footwear Revenue undefined Forecast, by Application 2020 & 2033
- Table 2: Global Safety Footwear Volume K Forecast, by Application 2020 & 2033
- Table 3: Global Safety Footwear Revenue undefined Forecast, by Types 2020 & 2033
- Table 4: Global Safety Footwear Volume K Forecast, by Types 2020 & 2033
- Table 5: Global Safety Footwear Revenue undefined Forecast, by Region 2020 & 2033
- Table 6: Global Safety Footwear Volume K Forecast, by Region 2020 & 2033
- Table 7: Global Safety Footwear Revenue undefined Forecast, by Application 2020 & 2033
- Table 8: Global Safety Footwear Volume K Forecast, by Application 2020 & 2033
- Table 9: Global Safety Footwear Revenue undefined Forecast, by Types 2020 & 2033
- Table 10: Global Safety Footwear Volume K Forecast, by Types 2020 & 2033
- Table 11: Global Safety Footwear Revenue undefined Forecast, by Country 2020 & 2033
- Table 12: Global Safety Footwear Volume K Forecast, by Country 2020 & 2033
- Table 13: United States Safety Footwear Revenue (undefined) Forecast, by Application 2020 & 2033
- Table 14: United States Safety Footwear Volume (K) Forecast, by Application 2020 & 2033
- Table 15: Canada Safety Footwear Revenue (undefined) Forecast, by Application 2020 & 2033
- Table 16: Canada Safety Footwear Volume (K) Forecast, by Application 2020 & 2033
- Table 17: Mexico Safety Footwear Revenue (undefined) Forecast, by Application 2020 & 2033
- Table 18: Mexico Safety Footwear Volume (K) Forecast, by Application 2020 & 2033
- Table 19: Global Safety Footwear Revenue undefined Forecast, by Application 2020 & 2033
- Table 20: Global Safety Footwear Volume K Forecast, by Application 2020 & 2033
- Table 21: Global Safety Footwear Revenue undefined Forecast, by Types 2020 & 2033
- Table 22: Global Safety Footwear Volume K Forecast, by Types 2020 & 2033
- Table 23: Global Safety Footwear Revenue undefined Forecast, by Country 2020 & 2033
- Table 24: Global Safety Footwear Volume K Forecast, by Country 2020 & 2033
- Table 25: Brazil Safety Footwear Revenue (undefined) Forecast, by Application 2020 & 2033
- Table 26: Brazil Safety Footwear Volume (K) Forecast, by Application 2020 & 2033
- Table 27: Argentina Safety Footwear Revenue (undefined) Forecast, by Application 2020 & 2033
- Table 28: Argentina Safety Footwear Volume (K) Forecast, by Application 2020 & 2033
- Table 29: Rest of South America Safety Footwear Revenue (undefined) Forecast, by Application 2020 & 2033
- Table 30: Rest of South America Safety Footwear Volume (K) Forecast, by Application 2020 & 2033
- Table 31: Global Safety Footwear Revenue undefined Forecast, by Application 2020 & 2033
- Table 32: Global Safety Footwear Volume K Forecast, by Application 2020 & 2033
- Table 33: Global Safety Footwear Revenue undefined Forecast, by Types 2020 & 2033
- Table 34: Global Safety Footwear Volume K Forecast, by Types 2020 & 2033
- Table 35: Global Safety Footwear Revenue undefined Forecast, by Country 2020 & 2033
- Table 36: Global Safety Footwear Volume K Forecast, by Country 2020 & 2033
- Table 37: United Kingdom Safety Footwear Revenue (undefined) Forecast, by Application 2020 & 2033
- Table 38: United Kingdom Safety Footwear Volume (K) Forecast, by Application 2020 & 2033
- Table 39: Germany Safety Footwear Revenue (undefined) Forecast, by Application 2020 & 2033
- Table 40: Germany Safety Footwear Volume (K) Forecast, by Application 2020 & 2033
- Table 41: France Safety Footwear Revenue (undefined) Forecast, by Application 2020 & 2033
- Table 42: France Safety Footwear Volume (K) Forecast, by Application 2020 & 2033
- Table 43: Italy Safety Footwear Revenue (undefined) Forecast, by Application 2020 & 2033
- Table 44: Italy Safety Footwear Volume (K) Forecast, by Application 2020 & 2033
- Table 45: Spain Safety Footwear Revenue (undefined) Forecast, by Application 2020 & 2033
- Table 46: Spain Safety Footwear Volume (K) Forecast, by Application 2020 & 2033
- Table 47: Russia Safety Footwear Revenue (undefined) Forecast, by Application 2020 & 2033
- Table 48: Russia Safety Footwear Volume (K) Forecast, by Application 2020 & 2033
- Table 49: Benelux Safety Footwear Revenue (undefined) Forecast, by Application 2020 & 2033
- Table 50: Benelux Safety Footwear Volume (K) Forecast, by Application 2020 & 2033
- Table 51: Nordics Safety Footwear Revenue (undefined) Forecast, by Application 2020 & 2033
- Table 52: Nordics Safety Footwear Volume (K) Forecast, by Application 2020 & 2033
- Table 53: Rest of Europe Safety Footwear Revenue (undefined) Forecast, by Application 2020 & 2033
- Table 54: Rest of Europe Safety Footwear Volume (K) Forecast, by Application 2020 & 2033
- Table 55: Global Safety Footwear Revenue undefined Forecast, by Application 2020 & 2033
- Table 56: Global Safety Footwear Volume K Forecast, by Application 2020 & 2033
- Table 57: Global Safety Footwear Revenue undefined Forecast, by Types 2020 & 2033
- Table 58: Global Safety Footwear Volume K Forecast, by Types 2020 & 2033
- Table 59: Global Safety Footwear Revenue undefined Forecast, by Country 2020 & 2033
- Table 60: Global Safety Footwear Volume K Forecast, by Country 2020 & 2033
- Table 61: Turkey Safety Footwear Revenue (undefined) Forecast, by Application 2020 & 2033
- Table 62: Turkey Safety Footwear Volume (K) Forecast, by Application 2020 & 2033
- Table 63: Israel Safety Footwear Revenue (undefined) Forecast, by Application 2020 & 2033
- Table 64: Israel Safety Footwear Volume (K) Forecast, by Application 2020 & 2033
- Table 65: GCC Safety Footwear Revenue (undefined) Forecast, by Application 2020 & 2033
- Table 66: GCC Safety Footwear Volume (K) Forecast, by Application 2020 & 2033
- Table 67: North Africa Safety Footwear Revenue (undefined) Forecast, by Application 2020 & 2033
- Table 68: North Africa Safety Footwear Volume (K) Forecast, by Application 2020 & 2033
- Table 69: South Africa Safety Footwear Revenue (undefined) Forecast, by Application 2020 & 2033
- Table 70: South Africa Safety Footwear Volume (K) Forecast, by Application 2020 & 2033
- Table 71: Rest of Middle East & Africa Safety Footwear Revenue (undefined) Forecast, by Application 2020 & 2033
- Table 72: Rest of Middle East & Africa Safety Footwear Volume (K) Forecast, by Application 2020 & 2033
- Table 73: Global Safety Footwear Revenue undefined Forecast, by Application 2020 & 2033
- Table 74: Global Safety Footwear Volume K Forecast, by Application 2020 & 2033
- Table 75: Global Safety Footwear Revenue undefined Forecast, by Types 2020 & 2033
- Table 76: Global Safety Footwear Volume K Forecast, by Types 2020 & 2033
- Table 77: Global Safety Footwear Revenue undefined Forecast, by Country 2020 & 2033
- Table 78: Global Safety Footwear Volume K Forecast, by Country 2020 & 2033
- Table 79: China Safety Footwear Revenue (undefined) Forecast, by Application 2020 & 2033
- Table 80: China Safety Footwear Volume (K) Forecast, by Application 2020 & 2033
- Table 81: India Safety Footwear Revenue (undefined) Forecast, by Application 2020 & 2033
- Table 82: India Safety Footwear Volume (K) Forecast, by Application 2020 & 2033
- Table 83: Japan Safety Footwear Revenue (undefined) Forecast, by Application 2020 & 2033
- Table 84: Japan Safety Footwear Volume (K) Forecast, by Application 2020 & 2033
- Table 85: South Korea Safety Footwear Revenue (undefined) Forecast, by Application 2020 & 2033
- Table 86: South Korea Safety Footwear Volume (K) Forecast, by Application 2020 & 2033
- Table 87: ASEAN Safety Footwear Revenue (undefined) Forecast, by Application 2020 & 2033
- Table 88: ASEAN Safety Footwear Volume (K) Forecast, by Application 2020 & 2033
- Table 89: Oceania Safety Footwear Revenue (undefined) Forecast, by Application 2020 & 2033
- Table 90: Oceania Safety Footwear Volume (K) Forecast, by Application 2020 & 2033
- Table 91: Rest of Asia Pacific Safety Footwear Revenue (undefined) Forecast, by Application 2020 & 2033
- Table 92: Rest of Asia Pacific Safety Footwear Volume (K) Forecast, by Application 2020 & 2033
Frequently Asked Questions
1. What is the projected Compound Annual Growth Rate (CAGR) of the Safety Footwear?
The projected CAGR is approximately 9%.
2. Which companies are prominent players in the Safety Footwear?
Key companies in the market include Jallatte S.A.S, Dunlop Boots, COFRA, Modyf GmbH & Co. KG, KEEN Footwear, Rahman Group, Rock Fall, CLUTE S.A, V.F., WOLVERINE, Bova Safety Footwear, Gabri Safety Shoes, Simon, Anbu Safety Industrial, CANIS SAFETY, RAW- POL, BORDER PPE TRADING LLC, SOYUZSPECODEZHDA LTD, Walker Footwear Industries, Bata Industrials.
3. What are the main segments of the Safety Footwear?
The market segments include Application, Types.
4. Can you provide details about the market size?
The market size is estimated to be USD XXX N/A as of 2022.
5. What are some drivers contributing to market growth?
N/A
6. What are the notable trends driving market growth?
N/A
7. Are there any restraints impacting market growth?
N/A
8. Can you provide examples of recent developments in the market?
N/A
9. What pricing options are available for accessing the report?
Pricing options include single-user, multi-user, and enterprise licenses priced at USD 3350.00, USD 5025.00, and USD 6700.00 respectively.
10. Is the market size provided in terms of value or volume?
The market size is provided in terms of value, measured in N/A and volume, measured in K.
11. Are there any specific market keywords associated with the report?
Yes, the market keyword associated with the report is "Safety Footwear," which aids in identifying and referencing the specific market segment covered.
12. How do I determine which pricing option suits my needs best?
The pricing options vary based on user requirements and access needs. Individual users may opt for single-user licenses, while businesses requiring broader access may choose multi-user or enterprise licenses for cost-effective access to the report.
13. Are there any additional resources or data provided in the Safety Footwear report?
While the report offers comprehensive insights, it's advisable to review the specific contents or supplementary materials provided to ascertain if additional resources or data are available.
14. How can I stay updated on further developments or reports in the Safety Footwear?
To stay informed about further developments, trends, and reports in the Safety Footwear, consider subscribing to industry newsletters, following relevant companies and organizations, or regularly checking reputable industry news sources and publications.
Methodology
Step 1 - Identification of Relevant Samples Size from Population Database


Step 2 - Approaches for Defining Global Market Size (Value, Volume* & Price*)

Note*: In applicable scenarios
Step 3 - Data Sources
Primary Research
- Web Analytics
- Survey Reports
- Research Institute
- Latest Research Reports
- Opinion Leaders
Secondary Research
- Annual Reports
- White Paper
- Latest Press Release
- Industry Association
- Paid Database
- Investor Presentations

Step 4 - Data Triangulation
Involves using different sources of information in order to increase the validity of a study
These sources are likely to be stakeholders in a program - participants, other researchers, program staff, other community members, and so on.
Then we put all data in single framework & apply various statistical tools to find out the dynamic on the market.
During the analysis stage, feedback from the stakeholder groups would be compared to determine areas of agreement as well as areas of divergence