

Key Insights
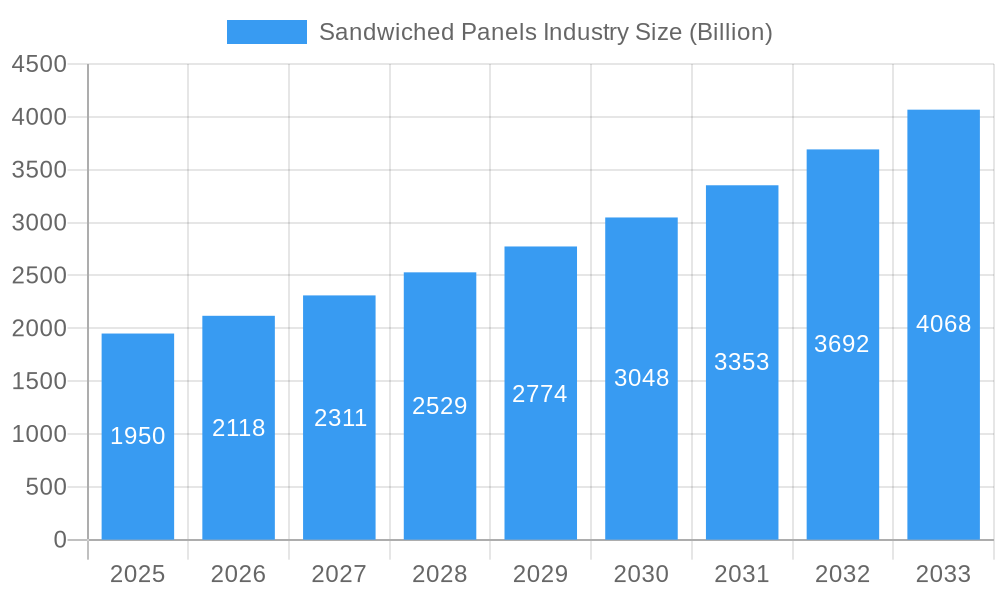
The global sandwiched panels market, valued at $1.95 billion in 2025, is experiencing robust growth, projected to expand at a compound annual growth rate (CAGR) of 8.85% from 2025 to 2033. This expansion is fueled by several key drivers. The increasing demand for energy-efficient buildings in both residential and commercial sectors is a significant factor, driving adoption of sandwiched panels due to their superior insulation properties compared to traditional building materials. Furthermore, the construction industry's ongoing push for faster and more efficient construction methods favors prefabricated sandwiched panels, reducing on-site labor and construction time. Growth is also spurred by rising infrastructure development globally, particularly in developing economies experiencing rapid urbanization. While material cost fluctuations and potential supply chain disruptions pose challenges, the long-term outlook remains positive due to the inherent advantages of sandwiched panels in terms of cost-effectiveness, durability, and thermal performance. The market segmentation reveals a diverse landscape, with EPS (Expanded Polystyrene) panels holding a significant share amongst product types, alongside Rigid Polyurethane (PUR) and Rigid Polyisocyanurate (PIR) panels. Oriented Strand Board (OSB) and Plywood are dominant skin materials, reflecting their widespread use in construction. Building walls and roofs are the primary application areas, underscoring the vital role of sandwiched panels in building envelopes. Key players such as Kingspan Group, Owens Corning, and ArcelorMittal are strategically positioned to capitalize on market opportunities through technological innovation and expansion into new geographic regions. The Asia-Pacific region is anticipated to exhibit strong growth, driven by rapid infrastructure development and a rising middle class.
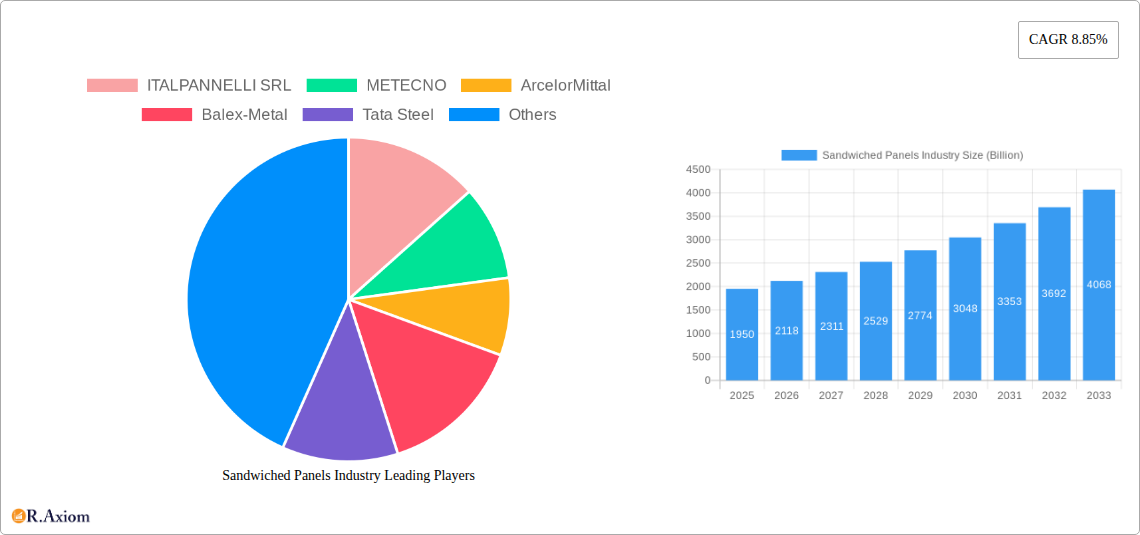
Sandwiched Panels Industry Market Size (In Billion)
The competitive landscape is characterized by a mix of large multinational corporations and regional players. Established players benefit from strong brand recognition and extensive distribution networks, while smaller companies often focus on niche applications or specialized product offerings. Technological advancements in panel materials and manufacturing processes are continuously improving the performance and sustainability of sandwiched panels, further enhancing their market appeal. Looking ahead, the market is expected to witness increasing adoption of sustainable and eco-friendly materials in sandwiched panel production, aligning with global sustainability initiatives. This includes the development of panels with recycled content and improved recyclability characteristics. The integration of smart technologies, such as sensors for building monitoring and energy management, is also anticipated to create new growth avenues within the sandwiched panels market. Overall, the market exhibits a positive trajectory, driven by a convergence of economic, technological, and environmental factors favoring the adoption of this efficient and versatile building material.
Sandwiched Panels Industry Company Market Share
This detailed report provides a comprehensive analysis of the global sandwiched panels industry, offering invaluable insights for stakeholders across the value chain. With a study period spanning 2019-2033, a base year of 2025, and a forecast period of 2025-2033, this report leverages historical data (2019-2024) to predict future market trends and growth opportunities within the multi-billion dollar industry. The report covers key market segments, leading players, and crucial industry developments, providing actionable intelligence for strategic decision-making.
Sandwiched Panels Industry Market Concentration & Innovation
The global sandwiched panels market is characterized by a moderately concentrated landscape, with several key players holding significant market share. While precise market share figures for individual companies are proprietary, we estimate that the top ten players account for approximately xx billion USD in revenue, representing approximately 60% of the total market value. This concentration reflects the high capital investment required for production and the specialized technologies involved. Innovation drivers within the industry are primarily focused on enhancing thermal performance, improving fire resistance, reducing weight, and increasing durability. Regulatory frameworks, such as building codes and energy efficiency standards, significantly influence the market. The presence of substitute materials, like traditional building materials, creates competitive pressure. End-user trends favor sustainable and environmentally friendly solutions, prompting the industry to develop products with improved life-cycle assessments and reduced environmental impact. M&A activity has been relatively moderate in recent years; however, the estimated value of completed deals since 2019 is approximately xx billion USD.
- Market Concentration: Top 10 players account for approximately 60% market share (estimated).
- Innovation Drivers: Improved thermal performance, fire resistance, weight reduction, durability.
- Regulatory Impact: Building codes, energy efficiency standards drive demand for high-performance panels.
- M&A Activity: Estimated value of deals since 2019: xx billion USD.
Sandwiched Panels Industry Industry Trends & Insights
The sandwiched panels market is projected to experience significant growth over the forecast period (2025-2033), with a Compound Annual Growth Rate (CAGR) of xx%. This growth is fueled by several key factors, including the increasing demand for energy-efficient buildings, the expansion of the construction industry in developing economies, and the rising adoption of prefabricated construction methods. Technological disruptions, such as the development of innovative core materials and improved manufacturing processes, are further contributing to market expansion. Consumer preferences are shifting towards sustainable and high-performance building materials, boosting the demand for eco-friendly sandwiched panels. Competitive dynamics are intensifying, with companies focusing on product differentiation, cost optimization, and strategic partnerships to enhance their market position. Market penetration of sandwiched panels within the construction sector is currently estimated at xx%, projected to increase to xx% by 2033.
Dominant Markets & Segments in Sandwiched Panels Industry
The global sandwiched panels market is geographically diverse, with significant contributions from North America, Europe, and Asia Pacific. However, the Asia Pacific region is expected to witness the fastest growth over the forecast period. This dominance is driven by rapid urbanization, infrastructure development, and increasing government support for energy-efficient construction in several developing nations within the region.
Key Drivers:
- Rapid urbanization and infrastructure development.
- Favorable government policies and initiatives.
- Growing awareness of energy efficiency.
Product Segmentation: The Rigid Polyurethane (PUR) and Rigid Polyisocyanurate (PIR) Panel segment currently holds the largest market share, owing to their superior insulation properties and widespread adoption in various applications. The EPS (Expanded Polystyrene) Panel segment is also a significant contributor, driven by cost-effectiveness.
Skin Material Segmentation: Oriented Strand Board (OSB) is the dominant skin material due to its cost-effectiveness and mechanical properties. However, other skin materials are increasingly gaining traction, driven by demands for enhanced aesthetics, durability, and specific performance characteristics.
Application Segmentation: Building wall and roof applications account for the majority of market demand, with cold storage applications exhibiting significant growth potential due to the stringent temperature requirements.
Sandwiched Panels Industry Product Developments
Recent product innovations focus on enhancing thermal performance, fire resistance, and acoustic insulation. Advances in core materials, such as the introduction of vacuum insulated panels (VIPs), are driving improvements in energy efficiency. New manufacturing processes are improving the precision and speed of panel production, thereby lowering costs. The market is seeing increased integration of smart technologies, including sensors and monitoring systems, to enhance building performance and optimize energy usage. These developments address market needs for sustainable, cost-effective, and high-performance building solutions.
Report Scope & Segmentation Analysis
This report provides a comprehensive segmentation analysis of the sandwiched panels market across various parameters:
Product: EPS (Expanded Polystyrene) Panel, Rigid Polyurethane (PUR) and Rigid Polyisocyanurate (PIR) Panel, Glass Wool Panel, Other Products (Extruded Polystyrene Foam). Growth projections vary significantly by product type, reflecting differences in cost, performance, and suitability for specific applications. The PIR/PUR segment is projected to maintain the largest market share due to superior insulation and performance.
Skin Material: Oriented Strand Board (OSB), Plywood, Other Skin Materials (Cement Board). Market share is heavily dominated by OSB, due to its cost and widespread availability. However, the "Other" category is growing, spurred by specialized applications requiring fire resistance, or enhanced aesthetics.
Application: Building Wall, Building Roof, Cold Storage. The building wall and roof segments comprise the bulk of the market. Cold storage is a high-growth segment owing to increasing demand for temperature-controlled facilities. Each segment presents unique competitive dynamics, influenced by material costs, performance requirements, and regional regulations.
Key Drivers of Sandwiched Panels Industry Growth
The growth of the sandwiched panels industry is driven by several key factors:
- Technological advancements: Innovations in core materials and manufacturing processes lead to improved performance and cost reduction.
- Economic factors: Increased construction activity globally and rising disposable incomes fuel demand for high-quality building materials.
- Regulatory pressures: Stringent building codes and energy efficiency standards mandate the use of high-performance insulation materials.
Challenges in the Sandwiched Panels Industry Sector
The sandwiched panels industry faces several challenges:
- Fluctuating raw material prices: The cost of core materials and skin materials impacts profitability and price competitiveness.
- Supply chain disruptions: Global supply chain issues can affect the availability of raw materials and components.
- Intense competition: Numerous manufacturers compete on price and performance, leading to price pressure.
Emerging Opportunities in Sandwiched Panels Industry
Emerging opportunities in the sandwiched panels industry include:
- Sustainable and eco-friendly products: Growing demand for environmentally friendly building materials presents significant opportunities for manufacturers.
- Innovative applications: Expansion into new applications, such as modular construction and cold chain logistics, offers growth potential.
- Smart building technologies: Integration of sensors and monitoring systems enhances building performance and adds value.
Leading Players in the Sandwiched Panels Industry Market
- ITALPANNELLI SRL
- METECNO
- ArcelorMittal
- Balex-Metal
- Tata Steel
- Rautaruukki Corporation
- Premium Building Systems
- Owens Corning
- Kingspan Group
- Multicolor Steels (India) Pvt Ltd
- Cornerstone Building Brands
- DANA Group of Companies
- Zamil Industrial Pre-Engineered Buildings Co Ltd
- Jiangsu Jingxue Insulation Technology Co Ltd
- Alubel SpA
- Nucor Building Systems
- Manni Group SpA
- PFB Corporation(Riverside)
Key Developments in Sandwiched Panels Industry Industry
- June 2022: Owens Corning's acquisition of WearDeck strengthens its position in the weather-resistant decking and structural lumber markets, expanding its residential and commercial reach.
- January 2022: Owens Corning's introduction of FOAMGLAS Perinsul SIP offers a thermal bridge solution for high-performance buildings, improving energy efficiency and moisture resistance.
Strategic Outlook for Sandwiched Panels Industry Market
The future of the sandwiched panels industry appears bright, driven by sustained growth in the construction sector and the increasing adoption of energy-efficient building practices. Continued innovation in materials and manufacturing processes, coupled with the growing demand for sustainable building solutions, will propel market expansion. Companies that embrace technological advancements, adapt to evolving regulatory requirements, and cater to specific market needs will be well-positioned to capture significant market share in the years to come. The market's diverse applications across various construction sectors and industrial needs ensure a robust and resilient outlook for continued, multi-billion dollar growth.
Sandwiched Panels Industry Segmentation
-
1. Product
- 1.1. EPS (Expanded Polystyrene) Panel
- 1.2. Rigid Po
- 1.3. Glass Wool Panel
- 1.4. Other Products (Extruded Polystyrene Foam)
-
2. Skin Material
- 2.1. Oriented Strand Board (OSB)
- 2.2. Plywood
- 2.3. Other Skin Materials (Cement Board)
-
3. Application
- 3.1. Building Wall
- 3.2. Building Roof
- 3.3. Cold Storage
Sandwiched Panels Industry Segmentation By Geography
-
1. Asia Pacific
- 1.1. China
- 1.2. India
- 1.3. Japan
- 1.4. South Korea
- 1.5. Rest of Asia Pacific
-
2. North America
- 2.1. United States
- 2.2. Canada
- 2.3. Mexico
- 2.4. Rest of North America
-
3. Europe
- 3.1. Germany
- 3.2. United Kingdom
- 3.3. Italy
- 3.4. France
- 3.5. Rest of Europe
-
4. South America
- 4.1. Brazil
- 4.2. Argentina
- 4.3. Rest of South America
-
5. Middle East and Africa
- 5.1. Saudi Arabia
- 5.2. South Africa
- 5.3. Rest of Middle East and Africa
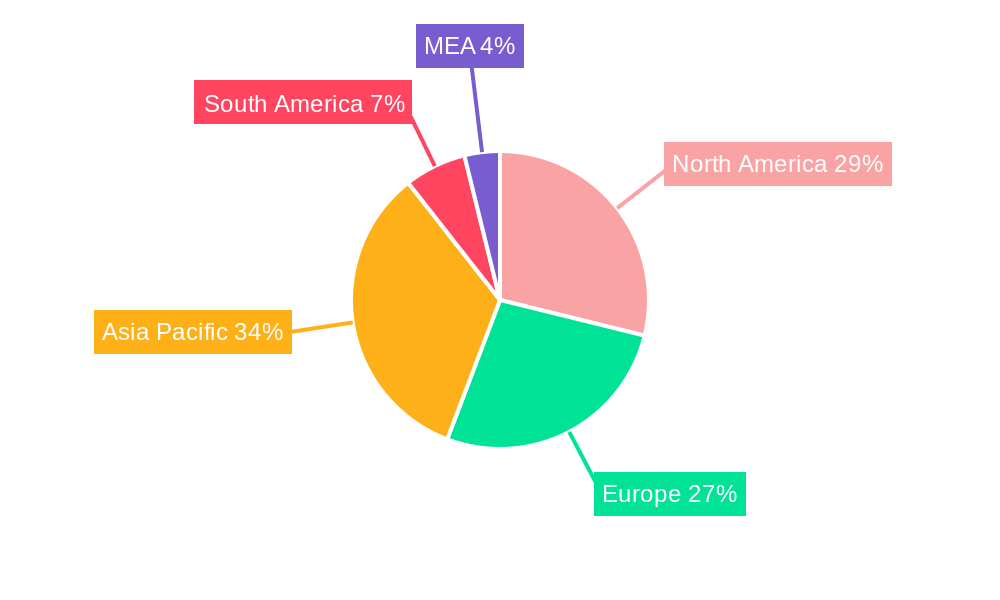
Sandwiched Panels Industry Regional Market Share
Geographic Coverage of Sandwiched Panels Industry
Sandwiched Panels Industry REPORT HIGHLIGHTS
| Aspects | Details |
|---|---|
| Study Period | 2020-2034 |
| Base Year | 2025 |
| Estimated Year | 2026 |
| Forecast Period | 2026-2034 |
| Historical Period | 2020-2025 |
| Growth Rate | CAGR of 8.85% from 2020-2034 |
| Segmentation |
|
Table of Contents
- 1. Introduction
- 1.1. Research Scope
- 1.2. Market Segmentation
- 1.3. Research Objective
- 1.4. Definitions and Assumptions
- 2. Executive Summary
- 2.1. Market Snapshot
- 3. Market Dynamics
- 3.1. Market Drivers
- 3.2. Market Restrains
- 3.3. Market Trends
- 3.4. Market Opportunities
- 4. Market Factor Analysis
- 4.1. Porters Five Forces
- 4.1.1. Bargaining Power of Suppliers
- 4.1.2. Bargaining Power of Buyers
- 4.1.3. Threat of New Entrants
- 4.1.4. Threat of Substitutes
- 4.1.5. Competitive Rivalry
- 4.2. PESTEL analysis
- 4.3. BCG Analysis
- 4.3.1. Stars (High Growth, High Market Share)
- 4.3.2. Cash Cows (Low Growth, High Market Share)
- 4.3.3. Question Mark (High Growth, Low Market Share)
- 4.3.4. Dogs (Low Growth, Low Market Share)
- 4.4. Ansoff Matrix Analysis
- 4.5. Supply Chain Analysis
- 4.6. Regulatory Landscape
- 4.7. Current Market Potential and Opportunity Assessment (TAM–SAM–SOM Framework)
- 4.8. RAX Analyst Note
- 4.1. Porters Five Forces
- 5. Market Analysis, Insights and Forecast 2021-2033
- 5.1. Market Analysis, Insights and Forecast - by Product
- 5.1.1. EPS (Expanded Polystyrene) Panel
- 5.1.2. Rigid Po
- 5.1.3. Glass Wool Panel
- 5.1.4. Other Products (Extruded Polystyrene Foam)
- 5.2. Market Analysis, Insights and Forecast - by Skin Material
- 5.2.1. Oriented Strand Board (OSB)
- 5.2.2. Plywood
- 5.2.3. Other Skin Materials (Cement Board)
- 5.3. Market Analysis, Insights and Forecast - by Application
- 5.3.1. Building Wall
- 5.3.2. Building Roof
- 5.3.3. Cold Storage
- 5.4. Market Analysis, Insights and Forecast - by Region
- 5.4.1. Asia Pacific
- 5.4.2. North America
- 5.4.3. Europe
- 5.4.4. South America
- 5.4.5. Middle East and Africa
- 5.1. Market Analysis, Insights and Forecast - by Product
- 6. Global Sandwiched Panels Industry Analysis, Insights and Forecast, 2021-2033
- 6.1. Market Analysis, Insights and Forecast - by Product
- 6.1.1. EPS (Expanded Polystyrene) Panel
- 6.1.2. Rigid Po
- 6.1.3. Glass Wool Panel
- 6.1.4. Other Products (Extruded Polystyrene Foam)
- 6.2. Market Analysis, Insights and Forecast - by Skin Material
- 6.2.1. Oriented Strand Board (OSB)
- 6.2.2. Plywood
- 6.2.3. Other Skin Materials (Cement Board)
- 6.3. Market Analysis, Insights and Forecast - by Application
- 6.3.1. Building Wall
- 6.3.2. Building Roof
- 6.3.3. Cold Storage
- 6.1. Market Analysis, Insights and Forecast - by Product
- 7. Asia Pacific Sandwiched Panels Industry Analysis, Insights and Forecast, 2020-2032
- 7.1. Market Analysis, Insights and Forecast - by Product
- 7.1.1. EPS (Expanded Polystyrene) Panel
- 7.1.2. Rigid Po
- 7.1.3. Glass Wool Panel
- 7.1.4. Other Products (Extruded Polystyrene Foam)
- 7.2. Market Analysis, Insights and Forecast - by Skin Material
- 7.2.1. Oriented Strand Board (OSB)
- 7.2.2. Plywood
- 7.2.3. Other Skin Materials (Cement Board)
- 7.3. Market Analysis, Insights and Forecast - by Application
- 7.3.1. Building Wall
- 7.3.2. Building Roof
- 7.3.3. Cold Storage
- 7.1. Market Analysis, Insights and Forecast - by Product
- 8. North America Sandwiched Panels Industry Analysis, Insights and Forecast, 2020-2032
- 8.1. Market Analysis, Insights and Forecast - by Product
- 8.1.1. EPS (Expanded Polystyrene) Panel
- 8.1.2. Rigid Po
- 8.1.3. Glass Wool Panel
- 8.1.4. Other Products (Extruded Polystyrene Foam)
- 8.2. Market Analysis, Insights and Forecast - by Skin Material
- 8.2.1. Oriented Strand Board (OSB)
- 8.2.2. Plywood
- 8.2.3. Other Skin Materials (Cement Board)
- 8.3. Market Analysis, Insights and Forecast - by Application
- 8.3.1. Building Wall
- 8.3.2. Building Roof
- 8.3.3. Cold Storage
- 8.1. Market Analysis, Insights and Forecast - by Product
- 9. Europe Sandwiched Panels Industry Analysis, Insights and Forecast, 2020-2032
- 9.1. Market Analysis, Insights and Forecast - by Product
- 9.1.1. EPS (Expanded Polystyrene) Panel
- 9.1.2. Rigid Po
- 9.1.3. Glass Wool Panel
- 9.1.4. Other Products (Extruded Polystyrene Foam)
- 9.2. Market Analysis, Insights and Forecast - by Skin Material
- 9.2.1. Oriented Strand Board (OSB)
- 9.2.2. Plywood
- 9.2.3. Other Skin Materials (Cement Board)
- 9.3. Market Analysis, Insights and Forecast - by Application
- 9.3.1. Building Wall
- 9.3.2. Building Roof
- 9.3.3. Cold Storage
- 9.1. Market Analysis, Insights and Forecast - by Product
- 10. South America Sandwiched Panels Industry Analysis, Insights and Forecast, 2020-2032
- 10.1. Market Analysis, Insights and Forecast - by Product
- 10.1.1. EPS (Expanded Polystyrene) Panel
- 10.1.2. Rigid Po
- 10.1.3. Glass Wool Panel
- 10.1.4. Other Products (Extruded Polystyrene Foam)
- 10.2. Market Analysis, Insights and Forecast - by Skin Material
- 10.2.1. Oriented Strand Board (OSB)
- 10.2.2. Plywood
- 10.2.3. Other Skin Materials (Cement Board)
- 10.3. Market Analysis, Insights and Forecast - by Application
- 10.3.1. Building Wall
- 10.3.2. Building Roof
- 10.3.3. Cold Storage
- 10.1. Market Analysis, Insights and Forecast - by Product
- 11. Middle East and Africa Sandwiched Panels Industry Analysis, Insights and Forecast, 2020-2032
- 11.1. Market Analysis, Insights and Forecast - by Product
- 11.1.1. EPS (Expanded Polystyrene) Panel
- 11.1.2. Rigid Po
- 11.1.3. Glass Wool Panel
- 11.1.4. Other Products (Extruded Polystyrene Foam)
- 11.2. Market Analysis, Insights and Forecast - by Skin Material
- 11.2.1. Oriented Strand Board (OSB)
- 11.2.2. Plywood
- 11.2.3. Other Skin Materials (Cement Board)
- 11.3. Market Analysis, Insights and Forecast - by Application
- 11.3.1. Building Wall
- 11.3.2. Building Roof
- 11.3.3. Cold Storage
- 11.1. Market Analysis, Insights and Forecast - by Product
- 12. Competitive Analysis
- 12.1. Company Profiles
- 12.1.1 ITALPANNELLI SRL
- 12.1.1.1. Company Overview
- 12.1.1.2. Products
- 12.1.1.3. Company Financials
- 12.1.1.4. SWOT Analysis
- 12.1.2 METECNO
- 12.1.2.1. Company Overview
- 12.1.2.2. Products
- 12.1.2.3. Company Financials
- 12.1.2.4. SWOT Analysis
- 12.1.3 ArcelorMittal
- 12.1.3.1. Company Overview
- 12.1.3.2. Products
- 12.1.3.3. Company Financials
- 12.1.3.4. SWOT Analysis
- 12.1.4 Balex-Metal
- 12.1.4.1. Company Overview
- 12.1.4.2. Products
- 12.1.4.3. Company Financials
- 12.1.4.4. SWOT Analysis
- 12.1.5 Tata Steel
- 12.1.5.1. Company Overview
- 12.1.5.2. Products
- 12.1.5.3. Company Financials
- 12.1.5.4. SWOT Analysis
- 12.1.6 Rautaruukki Corporation
- 12.1.6.1. Company Overview
- 12.1.6.2. Products
- 12.1.6.3. Company Financials
- 12.1.6.4. SWOT Analysis
- 12.1.7 Premium Building Systems
- 12.1.7.1. Company Overview
- 12.1.7.2. Products
- 12.1.7.3. Company Financials
- 12.1.7.4. SWOT Analysis
- 12.1.8 Owens Corning
- 12.1.8.1. Company Overview
- 12.1.8.2. Products
- 12.1.8.3. Company Financials
- 12.1.8.4. SWOT Analysis
- 12.1.9 Kingspan Group
- 12.1.9.1. Company Overview
- 12.1.9.2. Products
- 12.1.9.3. Company Financials
- 12.1.9.4. SWOT Analysis
- 12.1.10 Multicolor Steels (India) Pvt Ltd
- 12.1.10.1. Company Overview
- 12.1.10.2. Products
- 12.1.10.3. Company Financials
- 12.1.10.4. SWOT Analysis
- 12.1.11 Cornerstone Building Brands
- 12.1.11.1. Company Overview
- 12.1.11.2. Products
- 12.1.11.3. Company Financials
- 12.1.11.4. SWOT Analysis
- 12.1.12 DANA Group of Companies
- 12.1.12.1. Company Overview
- 12.1.12.2. Products
- 12.1.12.3. Company Financials
- 12.1.12.4. SWOT Analysis
- 12.1.13 Zamil Industrial Pre-Engineered Buildings Co Ltd
- 12.1.13.1. Company Overview
- 12.1.13.2. Products
- 12.1.13.3. Company Financials
- 12.1.13.4. SWOT Analysis
- 12.1.14 Jiangsu Jingxue Insulation Technology Co Ltd
- 12.1.14.1. Company Overview
- 12.1.14.2. Products
- 12.1.14.3. Company Financials
- 12.1.14.4. SWOT Analysis
- 12.1.15 Alubel SpA
- 12.1.15.1. Company Overview
- 12.1.15.2. Products
- 12.1.15.3. Company Financials
- 12.1.15.4. SWOT Analysis
- 12.1.16 Nucor Building Systems
- 12.1.16.1. Company Overview
- 12.1.16.2. Products
- 12.1.16.3. Company Financials
- 12.1.16.4. SWOT Analysis
- 12.1.17 Manni Group SpA
- 12.1.17.1. Company Overview
- 12.1.17.2. Products
- 12.1.17.3. Company Financials
- 12.1.17.4. SWOT Analysis
- 12.1.18 PFB Corporation(Riverside)
- 12.1.18.1. Company Overview
- 12.1.18.2. Products
- 12.1.18.3. Company Financials
- 12.1.18.4. SWOT Analysis
- 12.1.1 ITALPANNELLI SRL
- 12.2. Market Entropy
- 12.2.1 Company's Key Areas Served
- 12.2.2 Recent Developments
- 12.3. Company Market Share Analysis 2025
- 12.3.1 Top 5 Companies Market Share Analysis
- 12.3.2 Top 3 Companies Market Share Analysis
- 12.4. List of Potential Customers
- 13. Research Methodology
List of Figures
- Figure 1: Global Sandwiched Panels Industry Revenue Breakdown (Billion, %) by Region 2025 & 2033
- Figure 2: Global Sandwiched Panels Industry Volume Breakdown (Square Meters, %) by Region 2025 & 2033
- Figure 3: Asia Pacific Sandwiched Panels Industry Revenue (Billion), by Product 2025 & 2033
- Figure 4: Asia Pacific Sandwiched Panels Industry Volume (Square Meters), by Product 2025 & 2033
- Figure 5: Asia Pacific Sandwiched Panels Industry Revenue Share (%), by Product 2025 & 2033
- Figure 6: Asia Pacific Sandwiched Panels Industry Volume Share (%), by Product 2025 & 2033
- Figure 7: Asia Pacific Sandwiched Panels Industry Revenue (Billion), by Skin Material 2025 & 2033
- Figure 8: Asia Pacific Sandwiched Panels Industry Volume (Square Meters), by Skin Material 2025 & 2033
- Figure 9: Asia Pacific Sandwiched Panels Industry Revenue Share (%), by Skin Material 2025 & 2033
- Figure 10: Asia Pacific Sandwiched Panels Industry Volume Share (%), by Skin Material 2025 & 2033
- Figure 11: Asia Pacific Sandwiched Panels Industry Revenue (Billion), by Application 2025 & 2033
- Figure 12: Asia Pacific Sandwiched Panels Industry Volume (Square Meters), by Application 2025 & 2033
- Figure 13: Asia Pacific Sandwiched Panels Industry Revenue Share (%), by Application 2025 & 2033
- Figure 14: Asia Pacific Sandwiched Panels Industry Volume Share (%), by Application 2025 & 2033
- Figure 15: Asia Pacific Sandwiched Panels Industry Revenue (Billion), by Country 2025 & 2033
- Figure 16: Asia Pacific Sandwiched Panels Industry Volume (Square Meters), by Country 2025 & 2033
- Figure 17: Asia Pacific Sandwiched Panels Industry Revenue Share (%), by Country 2025 & 2033
- Figure 18: Asia Pacific Sandwiched Panels Industry Volume Share (%), by Country 2025 & 2033
- Figure 19: North America Sandwiched Panels Industry Revenue (Billion), by Product 2025 & 2033
- Figure 20: North America Sandwiched Panels Industry Volume (Square Meters), by Product 2025 & 2033
- Figure 21: North America Sandwiched Panels Industry Revenue Share (%), by Product 2025 & 2033
- Figure 22: North America Sandwiched Panels Industry Volume Share (%), by Product 2025 & 2033
- Figure 23: North America Sandwiched Panels Industry Revenue (Billion), by Skin Material 2025 & 2033
- Figure 24: North America Sandwiched Panels Industry Volume (Square Meters), by Skin Material 2025 & 2033
- Figure 25: North America Sandwiched Panels Industry Revenue Share (%), by Skin Material 2025 & 2033
- Figure 26: North America Sandwiched Panels Industry Volume Share (%), by Skin Material 2025 & 2033
- Figure 27: North America Sandwiched Panels Industry Revenue (Billion), by Application 2025 & 2033
- Figure 28: North America Sandwiched Panels Industry Volume (Square Meters), by Application 2025 & 2033
- Figure 29: North America Sandwiched Panels Industry Revenue Share (%), by Application 2025 & 2033
- Figure 30: North America Sandwiched Panels Industry Volume Share (%), by Application 2025 & 2033
- Figure 31: North America Sandwiched Panels Industry Revenue (Billion), by Country 2025 & 2033
- Figure 32: North America Sandwiched Panels Industry Volume (Square Meters), by Country 2025 & 2033
- Figure 33: North America Sandwiched Panels Industry Revenue Share (%), by Country 2025 & 2033
- Figure 34: North America Sandwiched Panels Industry Volume Share (%), by Country 2025 & 2033
- Figure 35: Europe Sandwiched Panels Industry Revenue (Billion), by Product 2025 & 2033
- Figure 36: Europe Sandwiched Panels Industry Volume (Square Meters), by Product 2025 & 2033
- Figure 37: Europe Sandwiched Panels Industry Revenue Share (%), by Product 2025 & 2033
- Figure 38: Europe Sandwiched Panels Industry Volume Share (%), by Product 2025 & 2033
- Figure 39: Europe Sandwiched Panels Industry Revenue (Billion), by Skin Material 2025 & 2033
- Figure 40: Europe Sandwiched Panels Industry Volume (Square Meters), by Skin Material 2025 & 2033
- Figure 41: Europe Sandwiched Panels Industry Revenue Share (%), by Skin Material 2025 & 2033
- Figure 42: Europe Sandwiched Panels Industry Volume Share (%), by Skin Material 2025 & 2033
- Figure 43: Europe Sandwiched Panels Industry Revenue (Billion), by Application 2025 & 2033
- Figure 44: Europe Sandwiched Panels Industry Volume (Square Meters), by Application 2025 & 2033
- Figure 45: Europe Sandwiched Panels Industry Revenue Share (%), by Application 2025 & 2033
- Figure 46: Europe Sandwiched Panels Industry Volume Share (%), by Application 2025 & 2033
- Figure 47: Europe Sandwiched Panels Industry Revenue (Billion), by Country 2025 & 2033
- Figure 48: Europe Sandwiched Panels Industry Volume (Square Meters), by Country 2025 & 2033
- Figure 49: Europe Sandwiched Panels Industry Revenue Share (%), by Country 2025 & 2033
- Figure 50: Europe Sandwiched Panels Industry Volume Share (%), by Country 2025 & 2033
- Figure 51: South America Sandwiched Panels Industry Revenue (Billion), by Product 2025 & 2033
- Figure 52: South America Sandwiched Panels Industry Volume (Square Meters), by Product 2025 & 2033
- Figure 53: South America Sandwiched Panels Industry Revenue Share (%), by Product 2025 & 2033
- Figure 54: South America Sandwiched Panels Industry Volume Share (%), by Product 2025 & 2033
- Figure 55: South America Sandwiched Panels Industry Revenue (Billion), by Skin Material 2025 & 2033
- Figure 56: South America Sandwiched Panels Industry Volume (Square Meters), by Skin Material 2025 & 2033
- Figure 57: South America Sandwiched Panels Industry Revenue Share (%), by Skin Material 2025 & 2033
- Figure 58: South America Sandwiched Panels Industry Volume Share (%), by Skin Material 2025 & 2033
- Figure 59: South America Sandwiched Panels Industry Revenue (Billion), by Application 2025 & 2033
- Figure 60: South America Sandwiched Panels Industry Volume (Square Meters), by Application 2025 & 2033
- Figure 61: South America Sandwiched Panels Industry Revenue Share (%), by Application 2025 & 2033
- Figure 62: South America Sandwiched Panels Industry Volume Share (%), by Application 2025 & 2033
- Figure 63: South America Sandwiched Panels Industry Revenue (Billion), by Country 2025 & 2033
- Figure 64: South America Sandwiched Panels Industry Volume (Square Meters), by Country 2025 & 2033
- Figure 65: South America Sandwiched Panels Industry Revenue Share (%), by Country 2025 & 2033
- Figure 66: South America Sandwiched Panels Industry Volume Share (%), by Country 2025 & 2033
- Figure 67: Middle East and Africa Sandwiched Panels Industry Revenue (Billion), by Product 2025 & 2033
- Figure 68: Middle East and Africa Sandwiched Panels Industry Volume (Square Meters), by Product 2025 & 2033
- Figure 69: Middle East and Africa Sandwiched Panels Industry Revenue Share (%), by Product 2025 & 2033
- Figure 70: Middle East and Africa Sandwiched Panels Industry Volume Share (%), by Product 2025 & 2033
- Figure 71: Middle East and Africa Sandwiched Panels Industry Revenue (Billion), by Skin Material 2025 & 2033
- Figure 72: Middle East and Africa Sandwiched Panels Industry Volume (Square Meters), by Skin Material 2025 & 2033
- Figure 73: Middle East and Africa Sandwiched Panels Industry Revenue Share (%), by Skin Material 2025 & 2033
- Figure 74: Middle East and Africa Sandwiched Panels Industry Volume Share (%), by Skin Material 2025 & 2033
- Figure 75: Middle East and Africa Sandwiched Panels Industry Revenue (Billion), by Application 2025 & 2033
- Figure 76: Middle East and Africa Sandwiched Panels Industry Volume (Square Meters), by Application 2025 & 2033
- Figure 77: Middle East and Africa Sandwiched Panels Industry Revenue Share (%), by Application 2025 & 2033
- Figure 78: Middle East and Africa Sandwiched Panels Industry Volume Share (%), by Application 2025 & 2033
- Figure 79: Middle East and Africa Sandwiched Panels Industry Revenue (Billion), by Country 2025 & 2033
- Figure 80: Middle East and Africa Sandwiched Panels Industry Volume (Square Meters), by Country 2025 & 2033
- Figure 81: Middle East and Africa Sandwiched Panels Industry Revenue Share (%), by Country 2025 & 2033
- Figure 82: Middle East and Africa Sandwiched Panels Industry Volume Share (%), by Country 2025 & 2033
List of Tables
- Table 1: Global Sandwiched Panels Industry Revenue Billion Forecast, by Product 2020 & 2033
- Table 2: Global Sandwiched Panels Industry Volume Square Meters Forecast, by Product 2020 & 2033
- Table 3: Global Sandwiched Panels Industry Revenue Billion Forecast, by Skin Material 2020 & 2033
- Table 4: Global Sandwiched Panels Industry Volume Square Meters Forecast, by Skin Material 2020 & 2033
- Table 5: Global Sandwiched Panels Industry Revenue Billion Forecast, by Application 2020 & 2033
- Table 6: Global Sandwiched Panels Industry Volume Square Meters Forecast, by Application 2020 & 2033
- Table 7: Global Sandwiched Panels Industry Revenue Billion Forecast, by Region 2020 & 2033
- Table 8: Global Sandwiched Panels Industry Volume Square Meters Forecast, by Region 2020 & 2033
- Table 9: Global Sandwiched Panels Industry Revenue Billion Forecast, by Product 2020 & 2033
- Table 10: Global Sandwiched Panels Industry Volume Square Meters Forecast, by Product 2020 & 2033
- Table 11: Global Sandwiched Panels Industry Revenue Billion Forecast, by Skin Material 2020 & 2033
- Table 12: Global Sandwiched Panels Industry Volume Square Meters Forecast, by Skin Material 2020 & 2033
- Table 13: Global Sandwiched Panels Industry Revenue Billion Forecast, by Application 2020 & 2033
- Table 14: Global Sandwiched Panels Industry Volume Square Meters Forecast, by Application 2020 & 2033
- Table 15: Global Sandwiched Panels Industry Revenue Billion Forecast, by Country 2020 & 2033
- Table 16: Global Sandwiched Panels Industry Volume Square Meters Forecast, by Country 2020 & 2033
- Table 17: China Sandwiched Panels Industry Revenue (Billion) Forecast, by Application 2020 & 2033
- Table 18: China Sandwiched Panels Industry Volume (Square Meters) Forecast, by Application 2020 & 2033
- Table 19: India Sandwiched Panels Industry Revenue (Billion) Forecast, by Application 2020 & 2033
- Table 20: India Sandwiched Panels Industry Volume (Square Meters) Forecast, by Application 2020 & 2033
- Table 21: Japan Sandwiched Panels Industry Revenue (Billion) Forecast, by Application 2020 & 2033
- Table 22: Japan Sandwiched Panels Industry Volume (Square Meters) Forecast, by Application 2020 & 2033
- Table 23: South Korea Sandwiched Panels Industry Revenue (Billion) Forecast, by Application 2020 & 2033
- Table 24: South Korea Sandwiched Panels Industry Volume (Square Meters) Forecast, by Application 2020 & 2033
- Table 25: Rest of Asia Pacific Sandwiched Panels Industry Revenue (Billion) Forecast, by Application 2020 & 2033
- Table 26: Rest of Asia Pacific Sandwiched Panels Industry Volume (Square Meters) Forecast, by Application 2020 & 2033
- Table 27: Global Sandwiched Panels Industry Revenue Billion Forecast, by Product 2020 & 2033
- Table 28: Global Sandwiched Panels Industry Volume Square Meters Forecast, by Product 2020 & 2033
- Table 29: Global Sandwiched Panels Industry Revenue Billion Forecast, by Skin Material 2020 & 2033
- Table 30: Global Sandwiched Panels Industry Volume Square Meters Forecast, by Skin Material 2020 & 2033
- Table 31: Global Sandwiched Panels Industry Revenue Billion Forecast, by Application 2020 & 2033
- Table 32: Global Sandwiched Panels Industry Volume Square Meters Forecast, by Application 2020 & 2033
- Table 33: Global Sandwiched Panels Industry Revenue Billion Forecast, by Country 2020 & 2033
- Table 34: Global Sandwiched Panels Industry Volume Square Meters Forecast, by Country 2020 & 2033
- Table 35: United States Sandwiched Panels Industry Revenue (Billion) Forecast, by Application 2020 & 2033
- Table 36: United States Sandwiched Panels Industry Volume (Square Meters) Forecast, by Application 2020 & 2033
- Table 37: Canada Sandwiched Panels Industry Revenue (Billion) Forecast, by Application 2020 & 2033
- Table 38: Canada Sandwiched Panels Industry Volume (Square Meters) Forecast, by Application 2020 & 2033
- Table 39: Mexico Sandwiched Panels Industry Revenue (Billion) Forecast, by Application 2020 & 2033
- Table 40: Mexico Sandwiched Panels Industry Volume (Square Meters) Forecast, by Application 2020 & 2033
- Table 41: Rest of North America Sandwiched Panels Industry Revenue (Billion) Forecast, by Application 2020 & 2033
- Table 42: Rest of North America Sandwiched Panels Industry Volume (Square Meters) Forecast, by Application 2020 & 2033
- Table 43: Global Sandwiched Panels Industry Revenue Billion Forecast, by Product 2020 & 2033
- Table 44: Global Sandwiched Panels Industry Volume Square Meters Forecast, by Product 2020 & 2033
- Table 45: Global Sandwiched Panels Industry Revenue Billion Forecast, by Skin Material 2020 & 2033
- Table 46: Global Sandwiched Panels Industry Volume Square Meters Forecast, by Skin Material 2020 & 2033
- Table 47: Global Sandwiched Panels Industry Revenue Billion Forecast, by Application 2020 & 2033
- Table 48: Global Sandwiched Panels Industry Volume Square Meters Forecast, by Application 2020 & 2033
- Table 49: Global Sandwiched Panels Industry Revenue Billion Forecast, by Country 2020 & 2033
- Table 50: Global Sandwiched Panels Industry Volume Square Meters Forecast, by Country 2020 & 2033
- Table 51: Germany Sandwiched Panels Industry Revenue (Billion) Forecast, by Application 2020 & 2033
- Table 52: Germany Sandwiched Panels Industry Volume (Square Meters) Forecast, by Application 2020 & 2033
- Table 53: United Kingdom Sandwiched Panels Industry Revenue (Billion) Forecast, by Application 2020 & 2033
- Table 54: United Kingdom Sandwiched Panels Industry Volume (Square Meters) Forecast, by Application 2020 & 2033
- Table 55: Italy Sandwiched Panels Industry Revenue (Billion) Forecast, by Application 2020 & 2033
- Table 56: Italy Sandwiched Panels Industry Volume (Square Meters) Forecast, by Application 2020 & 2033
- Table 57: France Sandwiched Panels Industry Revenue (Billion) Forecast, by Application 2020 & 2033
- Table 58: France Sandwiched Panels Industry Volume (Square Meters) Forecast, by Application 2020 & 2033
- Table 59: Rest of Europe Sandwiched Panels Industry Revenue (Billion) Forecast, by Application 2020 & 2033
- Table 60: Rest of Europe Sandwiched Panels Industry Volume (Square Meters) Forecast, by Application 2020 & 2033
- Table 61: Global Sandwiched Panels Industry Revenue Billion Forecast, by Product 2020 & 2033
- Table 62: Global Sandwiched Panels Industry Volume Square Meters Forecast, by Product 2020 & 2033
- Table 63: Global Sandwiched Panels Industry Revenue Billion Forecast, by Skin Material 2020 & 2033
- Table 64: Global Sandwiched Panels Industry Volume Square Meters Forecast, by Skin Material 2020 & 2033
- Table 65: Global Sandwiched Panels Industry Revenue Billion Forecast, by Application 2020 & 2033
- Table 66: Global Sandwiched Panels Industry Volume Square Meters Forecast, by Application 2020 & 2033
- Table 67: Global Sandwiched Panels Industry Revenue Billion Forecast, by Country 2020 & 2033
- Table 68: Global Sandwiched Panels Industry Volume Square Meters Forecast, by Country 2020 & 2033
- Table 69: Brazil Sandwiched Panels Industry Revenue (Billion) Forecast, by Application 2020 & 2033
- Table 70: Brazil Sandwiched Panels Industry Volume (Square Meters) Forecast, by Application 2020 & 2033
- Table 71: Argentina Sandwiched Panels Industry Revenue (Billion) Forecast, by Application 2020 & 2033
- Table 72: Argentina Sandwiched Panels Industry Volume (Square Meters) Forecast, by Application 2020 & 2033
- Table 73: Rest of South America Sandwiched Panels Industry Revenue (Billion) Forecast, by Application 2020 & 2033
- Table 74: Rest of South America Sandwiched Panels Industry Volume (Square Meters) Forecast, by Application 2020 & 2033
- Table 75: Global Sandwiched Panels Industry Revenue Billion Forecast, by Product 2020 & 2033
- Table 76: Global Sandwiched Panels Industry Volume Square Meters Forecast, by Product 2020 & 2033
- Table 77: Global Sandwiched Panels Industry Revenue Billion Forecast, by Skin Material 2020 & 2033
- Table 78: Global Sandwiched Panels Industry Volume Square Meters Forecast, by Skin Material 2020 & 2033
- Table 79: Global Sandwiched Panels Industry Revenue Billion Forecast, by Application 2020 & 2033
- Table 80: Global Sandwiched Panels Industry Volume Square Meters Forecast, by Application 2020 & 2033
- Table 81: Global Sandwiched Panels Industry Revenue Billion Forecast, by Country 2020 & 2033
- Table 82: Global Sandwiched Panels Industry Volume Square Meters Forecast, by Country 2020 & 2033
- Table 83: Saudi Arabia Sandwiched Panels Industry Revenue (Billion) Forecast, by Application 2020 & 2033
- Table 84: Saudi Arabia Sandwiched Panels Industry Volume (Square Meters) Forecast, by Application 2020 & 2033
- Table 85: South Africa Sandwiched Panels Industry Revenue (Billion) Forecast, by Application 2020 & 2033
- Table 86: South Africa Sandwiched Panels Industry Volume (Square Meters) Forecast, by Application 2020 & 2033
- Table 87: Rest of Middle East and Africa Sandwiched Panels Industry Revenue (Billion) Forecast, by Application 2020 & 2033
- Table 88: Rest of Middle East and Africa Sandwiched Panels Industry Volume (Square Meters) Forecast, by Application 2020 & 2033
Frequently Asked Questions
1. What is the projected Compound Annual Growth Rate (CAGR) of the Sandwiched Panels Industry?
The projected CAGR is approximately 8.85%.
2. Which companies are prominent players in the Sandwiched Panels Industry?
Key companies in the market include ITALPANNELLI SRL, METECNO, ArcelorMittal, Balex-Metal, Tata Steel, Rautaruukki Corporation, Premium Building Systems, Owens Corning, Kingspan Group, Multicolor Steels (India) Pvt Ltd, Cornerstone Building Brands, DANA Group of Companies, Zamil Industrial Pre-Engineered Buildings Co Ltd, Jiangsu Jingxue Insulation Technology Co Ltd, Alubel SpA, Nucor Building Systems, Manni Group SpA, PFB Corporation(Riverside).
3. What are the main segments of the Sandwiched Panels Industry?
The market segments include Product, Skin Material, Application.
4. Can you provide details about the market size?
The market size is estimated to be USD 1.95 Billion as of 2022.
5. What are some drivers contributing to market growth?
Increasing Demand from Construction Sector; Increasing Cold Storage Applications.
6. What are the notable trends driving market growth?
Increasing Demand from Building Walls.
7. Are there any restraints impacting market growth?
Advancements in Building Technologies. such as Modular Construction Techniques; Other Restraints.
8. Can you provide examples of recent developments in the market?
June 2022: Owens Corning announced the acquisition of a Florida-based composite decking and structural lumber manufacturer, WearDeck. With the acquisition, Owens Corning would strengthen its portfolio of weather-resistant decking and structural lumber and expand its expertise in both commercial and residential applications.
9. What pricing options are available for accessing the report?
Pricing options include single-user, multi-user, and enterprise licenses priced at USD 4750, USD 5250, and USD 8750 respectively.
10. Is the market size provided in terms of value or volume?
The market size is provided in terms of value, measured in Billion and volume, measured in Square Meters.
11. Are there any specific market keywords associated with the report?
Yes, the market keyword associated with the report is "Sandwiched Panels Industry," which aids in identifying and referencing the specific market segment covered.
12. How do I determine which pricing option suits my needs best?
The pricing options vary based on user requirements and access needs. Individual users may opt for single-user licenses, while businesses requiring broader access may choose multi-user or enterprise licenses for cost-effective access to the report.
13. Are there any additional resources or data provided in the Sandwiched Panels Industry report?
While the report offers comprehensive insights, it's advisable to review the specific contents or supplementary materials provided to ascertain if additional resources or data are available.
14. How can I stay updated on further developments or reports in the Sandwiched Panels Industry?
To stay informed about further developments, trends, and reports in the Sandwiched Panels Industry, consider subscribing to industry newsletters, following relevant companies and organizations, or regularly checking reputable industry news sources and publications.
Methodology
Step 1 - Identification of Relevant Samples Size from Population Database


Step 2 - Approaches for Defining Global Market Size (Value, Volume* & Price*)

Note*: In applicable scenarios
Step 3 - Data Sources
Primary Research
- Web Analytics
- Survey Reports
- Research Institute
- Latest Research Reports
- Opinion Leaders
Secondary Research
- Annual Reports
- White Paper
- Latest Press Release
- Industry Association
- Paid Database
- Investor Presentations

Step 4 - Data Triangulation
Involves using different sources of information in order to increase the validity of a study
These sources are likely to be stakeholders in a program - participants, other researchers, program staff, other community members, and so on.
Then we put all data in single framework & apply various statistical tools to find out the dynamic on the market.
During the analysis stage, feedback from the stakeholder groups would be compared to determine areas of agreement as well as areas of divergence