

Key Insights
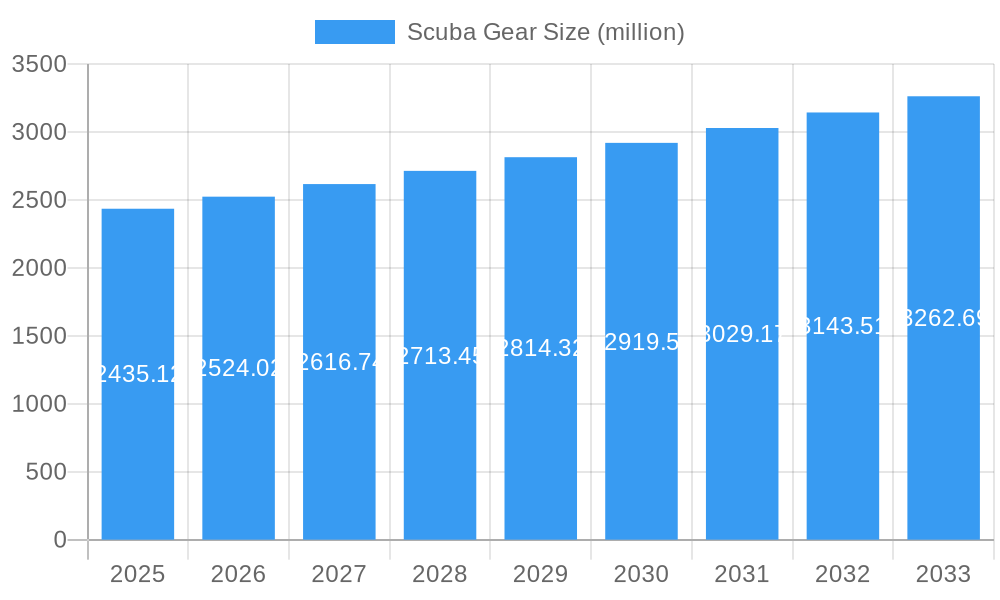
The global scuba gear market is poised for steady growth, with a projected market size of $2435.12 million in 2025, expanding at a Compound Annual Growth Rate (CAGR) of 3.6% through 2033. This sustained expansion is fueled by a confluence of factors, including increasing participation in recreational diving activities driven by a growing interest in underwater exploration and adventure tourism. The rising disposable incomes in emerging economies further bolster this trend, making scuba diving more accessible to a broader demographic. Technological advancements in gear design, leading to lighter, more durable, and user-friendly equipment, also contribute significantly to market attractiveness. Furthermore, the military sector’s continued reliance on advanced underwater exploration and operational capabilities for training and defense applications represents a consistent demand driver. The market is characterized by a diverse range of product types, encompassing both open and enclosed systems, catering to various diving environments and user preferences.
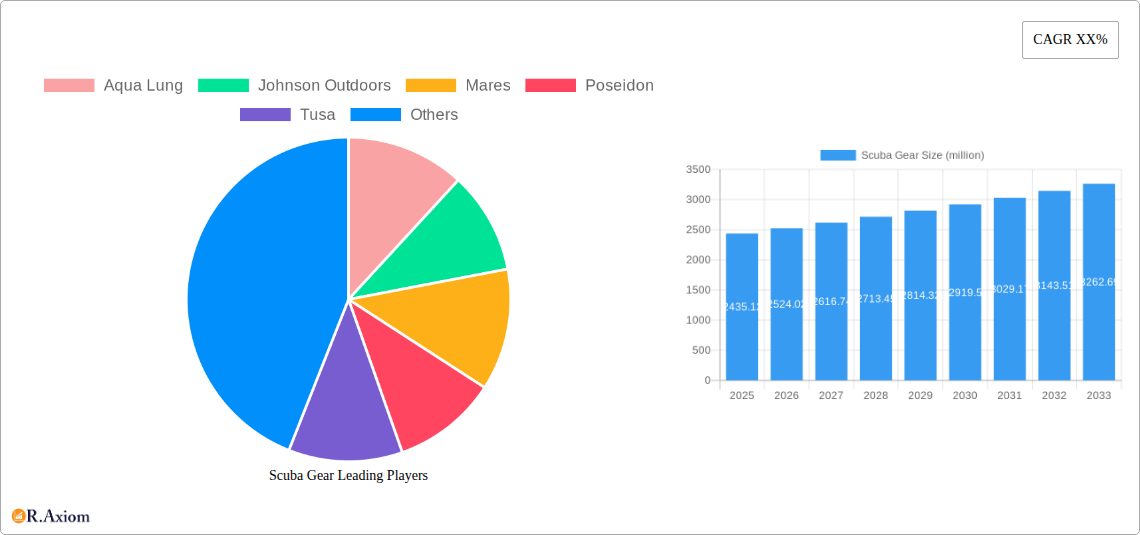
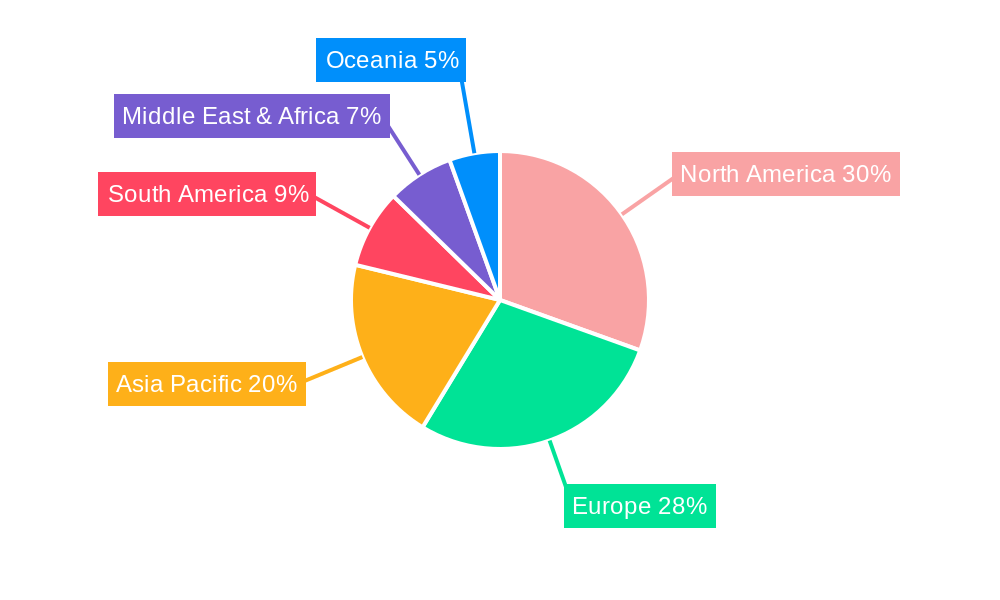
Scuba Gear Market Size (In Billion)
The scuba gear market exhibits distinct segmentation by application and type, with recreational diving expected to lead in terms of volume and revenue generation. However, the commercial sector, encompassing underwater research, construction, and salvage operations, presents substantial opportunities for high-value equipment. Innovations in materials science and ergonomic design are crucial trends shaping product development, focusing on enhanced safety, comfort, and performance. While the market enjoys robust growth, it faces certain restraints, including the high initial cost of quality scuba equipment, which can be a barrier for novice divers. Stringent safety regulations and the need for specialized training also contribute to the market's dynamics. Geographically, North America and Europe currently dominate the market due to well-established diving infrastructures and a high concentration of experienced divers. However, the Asia Pacific region is anticipated to witness the fastest growth, driven by increasing tourism and a burgeoning middle class. Key players such as Aqua Lung, Johnson Outdoors, and Mares are actively involved in product innovation and strategic partnerships to capture market share.
Scuba Gear Company Market Share
Scuba Gear Market Concentration & Innovation
The global scuba gear market exhibits a moderately concentrated landscape, with a mix of established multinational corporations and specialized niche players. Key innovators like Aqua Lung, Johnson Outdoors, Mares, and Poseidon consistently drive advancements, accounting for an estimated 70% of the market share in new product development and intellectual property filings. Innovation is primarily fueled by the relentless pursuit of enhanced diver safety, improved underwater exploration capabilities, and the integration of smart technologies. Regulatory frameworks, such as those established by diving certification agencies and international safety standards, play a crucial role in shaping product design and manufacturing processes, ensuring diver well-being and fostering trust. While direct product substitutes for life-support scuba equipment are limited, advancements in underwater scooters or freediving gear can be considered indirect competitive pressures. End-user trends are increasingly leaning towards sustainable materials, user-friendly interfaces, and compact, portable equipment for recreational divers. Commercial and military segments, on the other hand, prioritize ruggedness, advanced communication, and specialized functionalities. Mergers and acquisitions (M&A) have been observed, with estimated deal values in the range of $50 million to $200 million, aimed at consolidating market presence, acquiring proprietary technologies, and expanding product portfolios. For instance, the acquisition of smaller technology firms by larger scuba gear manufacturers contributes to market consolidation and synergistic growth.
Scuba Gear Industry Trends & Insights
The global scuba gear market is poised for significant expansion, driven by a confluence of factors, including a growing interest in adventure tourism and a rising disposable income among consumers worldwide. The market is projected to witness a Compound Annual Growth Rate (CAGR) of approximately 6.5% over the forecast period of 2025–2033. This robust growth is underpinned by several key market growth drivers. Firstly, the burgeoning recreational diving segment is a primary catalyst. An increasing number of individuals are participating in recreational diving activities, spurred by accessible certification courses and the desire to explore vibrant underwater ecosystems. This trend is particularly pronounced in regions with extensive coastlines and thriving marine tourism industries. Secondly, technological disruptions are continuously reshaping the industry. Innovations such as advanced dive computers with integrated GPS and physiological monitoring, streamlined and ergonomic regulator designs, and the development of lighter, more durable materials for BCDs and wetsuits are enhancing diver comfort, safety, and performance. The integration of artificial intelligence in dive planning software and virtual reality training simulations also represents a significant technological shift. Thirdly, consumer preferences are evolving. There is a growing demand for eco-friendly and sustainable scuba gear, prompting manufacturers to adopt greener production methods and materials. Divers are also seeking integrated systems and smart devices that offer real-time data and connectivity. Finally, competitive dynamics remain intense, with established players and emerging brands vying for market share. Companies are focusing on product differentiation, strategic partnerships, and expanding their distribution networks to cater to a diverse global customer base. The market penetration of advanced dive technology is steadily increasing, particularly within developed economies, as divers become more aware of and willing to invest in performance-enhancing equipment. The military segment, driven by defense spending and the need for specialized underwater operations, also contributes a steady demand for high-performance scuba gear.
Dominant Markets & Segments in Scuba Gear
The Recreational Application segment stands as the dominant force within the global scuba gear market, projected to account for over 65% of the total market value by 2033. This dominance is driven by a confluence of factors, including a burgeoning global middle class with increasing disposable incomes, a growing appetite for adventure tourism, and the widespread availability of accessible dive certification programs. Countries in Southeast Asia, the Caribbean, and Oceania, renowned for their pristine dive sites and established tourism infrastructure, are leading this charge. Economic policies promoting tourism and environmental conservation efforts that protect marine biodiversity further bolster the recreational segment's appeal.
Within the Types of scuba gear, Open Circuit scuba systems, which release exhaled gas into the environment, continue to hold the largest market share, estimated at 85%. This is primarily due to their cost-effectiveness, ease of use, and widespread adoption in recreational training and diving. However, the Enclosed Circuit scuba systems, commonly known as rebreathers, are experiencing a notable growth trajectory, albeit from a smaller base. This growth is fueled by their extended dive times, reduced gas consumption, and minimal bubble exhaust, making them ideal for technical diving, scientific research, and military operations.
The Commercial Application segment represents a significant, albeit smaller, portion of the market, driven by the demands of underwater construction, marine research, offshore oil and gas exploration, and search and rescue operations. Investment in marine infrastructure and the increasing complexity of offshore projects necessitate reliable and specialized scuba equipment. Government initiatives supporting marine resource management and infrastructure development indirectly fuel this segment.
The Military Application segment, while niche, is characterized by high-value, technologically advanced equipment. Defense spending, evolving geopolitical landscapes, and the need for specialized underwater capabilities for surveillance, special operations, and anti-terrorism efforts contribute to its consistent demand. The development of advanced dive suits, communication systems, and life support technology tailored for extreme environments are key drivers.
Scuba Gear Product Developments
Product innovation in the scuba gear market is characterized by a strong emphasis on enhanced diver safety and extended underwater endurance. Manufacturers are integrating smart technologies into dive computers, offering real-time physiological monitoring and advanced navigation. Innovations in materials science are leading to lighter, more durable, and environmentally friendly wetsuits and BCDs. Streamlined regulator designs and improved buoyancy control devices are enhancing diver comfort and maneuverability. The development of compact, high-performance rebreathers is also a significant trend, catering to technical and military applications by offering extended dive times and minimal bubble exhaust, providing a distinct competitive advantage in demanding underwater environments.
Report Scope & Segmentation Analysis
The scuba gear market is segmented across multiple dimensions to provide a comprehensive analysis. In terms of Application, the market is divided into Recreational, Commercial, and Military uses. The Recreational segment, driven by tourism and leisure activities, is projected to experience a robust CAGR of approximately 7.0% from 2025 to 2033, with an estimated market size of $3.5 billion in 2025. The Commercial segment, vital for underwater industries, is expected to grow at a CAGR of 5.5%, reaching an estimated $1.2 billion by 2025. The Military segment, characterized by high-tech demands, is forecast to grow at a CAGR of 4.8%, with an estimated market size of $0.8 billion in 2025.
Further segmentation by Types of scuba gear includes Open Circuit and Enclosed Circuit systems. The Open Circuit segment is expected to maintain its dominance, growing at a CAGR of 6.0% and projected to reach $4.0 billion by 2025. The Enclosed Circuit (rebreather) segment, though smaller, is exhibiting higher growth rates, projected at a CAGR of 8.5%, with an estimated market size of $0.5 billion in 2025, indicating a shift towards advanced diving technologies.
Key Drivers of Scuba Gear Growth
The scuba gear market's growth is propelled by several interconnected factors. The burgeoning adventure tourism sector, particularly in coastal and island destinations, is a primary driver, encouraging more individuals to take up diving. Technological advancements in dive computers, safety equipment, and materials are enhancing diver experience and safety, making diving more accessible and appealing. Furthermore, increasing disposable incomes globally translate into greater consumer spending on recreational activities and high-value equipment. Government initiatives promoting marine conservation and eco-tourism indirectly support the market by preserving dive sites and attracting a larger pool of divers. Finally, the growing popularity of underwater photography and videography is also creating a demand for specialized gear that enhances performance and capture quality.
Challenges in the Scuba Gear Sector
Despite the positive growth outlook, the scuba gear sector faces several challenges. Stringent safety regulations and certification requirements, while crucial for diver safety, can increase production costs and complexity. Supply chain disruptions, exacerbated by global events, can impact the availability of raw materials and finished products, leading to price volatility. High initial investment costs for advanced scuba equipment can be a barrier for new entrants and budget-conscious divers. Environmental concerns and the impact of climate change on marine ecosystems can affect dive site accessibility and appeal. Moreover, intense competition among established brands and the emergence of lower-cost alternatives can put pressure on profit margins, necessitating continuous innovation and cost optimization strategies.
Emerging Opportunities in Scuba Gear
Emerging opportunities in the scuba gear market are centered around innovation and evolving consumer needs. The increasing demand for sustainable and eco-friendly diving equipment presents a significant opportunity for manufacturers to develop and market environmentally conscious products. The rise of smart diving technology, including integrated dive computers, wearable sensors, and AI-powered dive planning, offers avenues for product differentiation and enhanced user experience. Expansion into emerging markets in Asia and South America, where diving is gaining popularity, represents a substantial growth potential. Furthermore, the development of specialized gear for technical diving, freediving, and underwater exploration caters to niche but high-value segments. The integration of virtual and augmented reality for dive training and simulation also offers new avenues for market engagement.
Leading Players in the Scuba Gear Market
- Aqua Lung
- Johnson Outdoors
- Mares
- Poseidon
- Tusa
- Seac
- Sherwood Scuba
- American Underwater Products
- Saekodive
- Cressi
- Beuchat International
- IST Sports
- Dive Rite
- Aquatec-Duton
- Zeagles Systems
- H2Odyssey
- Atomic Aquatics
Key Developments in Scuba Gear Industry
- 2023, Q4: Aqua Lung launches its new line of eco-friendly wetsuits made from recycled materials, aligning with growing sustainability demands.
- 2024, Q1: Johnson Outdoors introduces an advanced dive computer with integrated physiological monitoring, enhancing diver safety and performance analysis.
- 2024, Q2: Mares unveils a lightweight, compact rebreather designed for increased accessibility in technical diving applications.
- 2024, Q3: Poseidon patents a new regulator technology offering improved breathing resistance and efficiency in extreme cold water conditions.
- 2024, Q4: Tusa announces a strategic partnership with a leading underwater camera manufacturer to offer integrated dive imaging solutions.
- 2025, Q1: Seac acquires a specialized manufacturer of drysuits, expanding its portfolio for cold-water diving.
- 2025, Q2: Sherwood Scuba invests heavily in R&D for advanced buoyancy control devices, focusing on ergonomic design and improved functionality.
- 2025, Q3: American Underwater Products showcases a new line of dive masks with enhanced field of vision and improved anti-fog technology.
- 2025, Q4: Saekodive introduces a budget-friendly range of recreational dive gear, targeting emerging markets.
- 2026, Q1: Cressi patents a novel fin design for increased propulsion efficiency with reduced diver effort.
- 2026, Q2: Beuchat International launches a range of smart apparel for divers, integrating sensors for performance tracking.
- 2026, Q3: IST Sports announces a collaboration with a research institute to develop next-generation dive computers for scientific exploration.
- 2026, Q4: Dive Rite introduces modular BCD systems that can be customized for various diving applications, enhancing versatility.
- 2027, Q1: Aquatec-Duton invests in advanced manufacturing techniques to produce lighter and more durable dive tanks.
- 2027, Q2: Zeagles Systems focuses on enhancing its integrated breathing systems for military applications, prioritizing reliability and stealth.
- 2027, Q3: H2Odyssey develops innovative materials for wetsuits that offer superior thermal insulation with reduced environmental impact.
- 2027, Q4: Atomic Aquatics launches a premium regulator line with advanced features for high-performance diving.
Strategic Outlook for Scuba Gear Market
The strategic outlook for the scuba gear market is one of optimistic growth, fueled by evolving consumer preferences and continuous technological innovation. The increasing emphasis on sustainable products and the integration of smart technologies present significant opportunities for market leaders to expand their reach and enhance brand loyalty. The growing demand in emerging economies, coupled with the consistent need for specialized equipment in commercial and military sectors, provides a diversified revenue stream. Companies that can effectively leverage these trends through strategic product development, targeted marketing campaigns, and robust distribution networks are well-positioned for sustained success in the coming years. The market's future hinges on its ability to adapt to environmental concerns, embrace technological advancements, and cater to the diverse needs of the global diving community.
Scuba Gear Segmentation
-
1. Application
- 1.1. Recreational
- 1.2. Commercial
- 1.3. Military
-
2. Types
- 2.1. Open
- 2.2. Enclosed
Scuba Gear Segmentation By Geography
-
1. North America
- 1.1. United States
- 1.2. Canada
- 1.3. Mexico
-
2. South America
- 2.1. Brazil
- 2.2. Argentina
- 2.3. Rest of South America
-
3. Europe
- 3.1. United Kingdom
- 3.2. Germany
- 3.3. France
- 3.4. Italy
- 3.5. Spain
- 3.6. Russia
- 3.7. Benelux
- 3.8. Nordics
- 3.9. Rest of Europe
-
4. Middle East & Africa
- 4.1. Turkey
- 4.2. Israel
- 4.3. GCC
- 4.4. North Africa
- 4.5. South Africa
- 4.6. Rest of Middle East & Africa
-
5. Asia Pacific
- 5.1. China
- 5.2. India
- 5.3. Japan
- 5.4. South Korea
- 5.5. ASEAN
- 5.6. Oceania
- 5.7. Rest of Asia Pacific
Scuba Gear Regional Market Share
Geographic Coverage of Scuba Gear
Scuba Gear REPORT HIGHLIGHTS
| Aspects | Details |
|---|---|
| Study Period | 2020-2034 |
| Base Year | 2025 |
| Estimated Year | 2026 |
| Forecast Period | 2026-2034 |
| Historical Period | 2020-2025 |
| Growth Rate | CAGR of 4.9% from 2020-2034 |
| Segmentation |
|
Table of Contents
- 1. Introduction
- 1.1. Research Scope
- 1.2. Market Segmentation
- 1.3. Research Objective
- 1.4. Definitions and Assumptions
- 2. Executive Summary
- 2.1. Market Snapshot
- 3. Market Dynamics
- 3.1. Market Drivers
- 3.2. Market Restrains
- 3.3. Market Trends
- 3.4. Market Opportunities
- 4. Market Factor Analysis
- 4.1. Porters Five Forces
- 4.1.1. Bargaining Power of Suppliers
- 4.1.2. Bargaining Power of Buyers
- 4.1.3. Threat of New Entrants
- 4.1.4. Threat of Substitutes
- 4.1.5. Competitive Rivalry
- 4.2. PESTEL analysis
- 4.3. BCG Analysis
- 4.3.1. Stars (High Growth, High Market Share)
- 4.3.2. Cash Cows (Low Growth, High Market Share)
- 4.3.3. Question Mark (High Growth, Low Market Share)
- 4.3.4. Dogs (Low Growth, Low Market Share)
- 4.4. Ansoff Matrix Analysis
- 4.5. Supply Chain Analysis
- 4.6. Regulatory Landscape
- 4.7. Current Market Potential and Opportunity Assessment (TAM–SAM–SOM Framework)
- 4.8. RAX Analyst Note
- 4.1. Porters Five Forces
- 5. Market Analysis, Insights and Forecast 2021-2033
- 5.1. Market Analysis, Insights and Forecast - by Application
- 5.1.1. Recreational
- 5.1.2. Commercial
- 5.1.3. Military
- 5.2. Market Analysis, Insights and Forecast - by Types
- 5.2.1. Open
- 5.2.2. Enclosed
- 5.3. Market Analysis, Insights and Forecast - by Region
- 5.3.1. North America
- 5.3.2. South America
- 5.3.3. Europe
- 5.3.4. Middle East & Africa
- 5.3.5. Asia Pacific
- 5.1. Market Analysis, Insights and Forecast - by Application
- 6. Global Scuba Gear Analysis, Insights and Forecast, 2021-2033
- 6.1. Market Analysis, Insights and Forecast - by Application
- 6.1.1. Recreational
- 6.1.2. Commercial
- 6.1.3. Military
- 6.2. Market Analysis, Insights and Forecast - by Types
- 6.2.1. Open
- 6.2.2. Enclosed
- 6.1. Market Analysis, Insights and Forecast - by Application
- 7. North America Scuba Gear Analysis, Insights and Forecast, 2020-2032
- 7.1. Market Analysis, Insights and Forecast - by Application
- 7.1.1. Recreational
- 7.1.2. Commercial
- 7.1.3. Military
- 7.2. Market Analysis, Insights and Forecast - by Types
- 7.2.1. Open
- 7.2.2. Enclosed
- 7.1. Market Analysis, Insights and Forecast - by Application
- 8. South America Scuba Gear Analysis, Insights and Forecast, 2020-2032
- 8.1. Market Analysis, Insights and Forecast - by Application
- 8.1.1. Recreational
- 8.1.2. Commercial
- 8.1.3. Military
- 8.2. Market Analysis, Insights and Forecast - by Types
- 8.2.1. Open
- 8.2.2. Enclosed
- 8.1. Market Analysis, Insights and Forecast - by Application
- 9. Europe Scuba Gear Analysis, Insights and Forecast, 2020-2032
- 9.1. Market Analysis, Insights and Forecast - by Application
- 9.1.1. Recreational
- 9.1.2. Commercial
- 9.1.3. Military
- 9.2. Market Analysis, Insights and Forecast - by Types
- 9.2.1. Open
- 9.2.2. Enclosed
- 9.1. Market Analysis, Insights and Forecast - by Application
- 10. Middle East & Africa Scuba Gear Analysis, Insights and Forecast, 2020-2032
- 10.1. Market Analysis, Insights and Forecast - by Application
- 10.1.1. Recreational
- 10.1.2. Commercial
- 10.1.3. Military
- 10.2. Market Analysis, Insights and Forecast - by Types
- 10.2.1. Open
- 10.2.2. Enclosed
- 10.1. Market Analysis, Insights and Forecast - by Application
- 11. Asia Pacific Scuba Gear Analysis, Insights and Forecast, 2020-2032
- 11.1. Market Analysis, Insights and Forecast - by Application
- 11.1.1. Recreational
- 11.1.2. Commercial
- 11.1.3. Military
- 11.2. Market Analysis, Insights and Forecast - by Types
- 11.2.1. Open
- 11.2.2. Enclosed
- 11.1. Market Analysis, Insights and Forecast - by Application
- 12. Competitive Analysis
- 12.1. Company Profiles
- 12.1.1 Aqua Lung
- 12.1.1.1. Company Overview
- 12.1.1.2. Products
- 12.1.1.3. Company Financials
- 12.1.1.4. SWOT Analysis
- 12.1.2 Johnson Outdoors
- 12.1.2.1. Company Overview
- 12.1.2.2. Products
- 12.1.2.3. Company Financials
- 12.1.2.4. SWOT Analysis
- 12.1.3 Mares
- 12.1.3.1. Company Overview
- 12.1.3.2. Products
- 12.1.3.3. Company Financials
- 12.1.3.4. SWOT Analysis
- 12.1.4 Poseidon
- 12.1.4.1. Company Overview
- 12.1.4.2. Products
- 12.1.4.3. Company Financials
- 12.1.4.4. SWOT Analysis
- 12.1.5 Tusa
- 12.1.5.1. Company Overview
- 12.1.5.2. Products
- 12.1.5.3. Company Financials
- 12.1.5.4. SWOT Analysis
- 12.1.6 Seac
- 12.1.6.1. Company Overview
- 12.1.6.2. Products
- 12.1.6.3. Company Financials
- 12.1.6.4. SWOT Analysis
- 12.1.7 Sherwood Scuba
- 12.1.7.1. Company Overview
- 12.1.7.2. Products
- 12.1.7.3. Company Financials
- 12.1.7.4. SWOT Analysis
- 12.1.8 American Underwater Products
- 12.1.8.1. Company Overview
- 12.1.8.2. Products
- 12.1.8.3. Company Financials
- 12.1.8.4. SWOT Analysis
- 12.1.9 Saekodive
- 12.1.9.1. Company Overview
- 12.1.9.2. Products
- 12.1.9.3. Company Financials
- 12.1.9.4. SWOT Analysis
- 12.1.10 Cressi
- 12.1.10.1. Company Overview
- 12.1.10.2. Products
- 12.1.10.3. Company Financials
- 12.1.10.4. SWOT Analysis
- 12.1.11 Beuchat International
- 12.1.11.1. Company Overview
- 12.1.11.2. Products
- 12.1.11.3. Company Financials
- 12.1.11.4. SWOT Analysis
- 12.1.12 IST Sports
- 12.1.12.1. Company Overview
- 12.1.12.2. Products
- 12.1.12.3. Company Financials
- 12.1.12.4. SWOT Analysis
- 12.1.13 Dive Rite
- 12.1.13.1. Company Overview
- 12.1.13.2. Products
- 12.1.13.3. Company Financials
- 12.1.13.4. SWOT Analysis
- 12.1.14 Aquatec-Duton
- 12.1.14.1. Company Overview
- 12.1.14.2. Products
- 12.1.14.3. Company Financials
- 12.1.14.4. SWOT Analysis
- 12.1.15 Zeagles Systems
- 12.1.15.1. Company Overview
- 12.1.15.2. Products
- 12.1.15.3. Company Financials
- 12.1.15.4. SWOT Analysis
- 12.1.16 H2Odyssey
- 12.1.16.1. Company Overview
- 12.1.16.2. Products
- 12.1.16.3. Company Financials
- 12.1.16.4. SWOT Analysis
- 12.1.17 Atomic Aquatics
- 12.1.17.1. Company Overview
- 12.1.17.2. Products
- 12.1.17.3. Company Financials
- 12.1.17.4. SWOT Analysis
- 12.1.1 Aqua Lung
- 12.2. Market Entropy
- 12.2.1 Company's Key Areas Served
- 12.2.2 Recent Developments
- 12.3. Company Market Share Analysis 2025
- 12.3.1 Top 5 Companies Market Share Analysis
- 12.3.2 Top 3 Companies Market Share Analysis
- 12.4. List of Potential Customers
- 13. Research Methodology
List of Figures
- Figure 1: Global Scuba Gear Revenue Breakdown (undefined, %) by Region 2025 & 2033
- Figure 2: Global Scuba Gear Volume Breakdown (K, %) by Region 2025 & 2033
- Figure 3: North America Scuba Gear Revenue (undefined), by Application 2025 & 2033
- Figure 4: North America Scuba Gear Volume (K), by Application 2025 & 2033
- Figure 5: North America Scuba Gear Revenue Share (%), by Application 2025 & 2033
- Figure 6: North America Scuba Gear Volume Share (%), by Application 2025 & 2033
- Figure 7: North America Scuba Gear Revenue (undefined), by Types 2025 & 2033
- Figure 8: North America Scuba Gear Volume (K), by Types 2025 & 2033
- Figure 9: North America Scuba Gear Revenue Share (%), by Types 2025 & 2033
- Figure 10: North America Scuba Gear Volume Share (%), by Types 2025 & 2033
- Figure 11: North America Scuba Gear Revenue (undefined), by Country 2025 & 2033
- Figure 12: North America Scuba Gear Volume (K), by Country 2025 & 2033
- Figure 13: North America Scuba Gear Revenue Share (%), by Country 2025 & 2033
- Figure 14: North America Scuba Gear Volume Share (%), by Country 2025 & 2033
- Figure 15: South America Scuba Gear Revenue (undefined), by Application 2025 & 2033
- Figure 16: South America Scuba Gear Volume (K), by Application 2025 & 2033
- Figure 17: South America Scuba Gear Revenue Share (%), by Application 2025 & 2033
- Figure 18: South America Scuba Gear Volume Share (%), by Application 2025 & 2033
- Figure 19: South America Scuba Gear Revenue (undefined), by Types 2025 & 2033
- Figure 20: South America Scuba Gear Volume (K), by Types 2025 & 2033
- Figure 21: South America Scuba Gear Revenue Share (%), by Types 2025 & 2033
- Figure 22: South America Scuba Gear Volume Share (%), by Types 2025 & 2033
- Figure 23: South America Scuba Gear Revenue (undefined), by Country 2025 & 2033
- Figure 24: South America Scuba Gear Volume (K), by Country 2025 & 2033
- Figure 25: South America Scuba Gear Revenue Share (%), by Country 2025 & 2033
- Figure 26: South America Scuba Gear Volume Share (%), by Country 2025 & 2033
- Figure 27: Europe Scuba Gear Revenue (undefined), by Application 2025 & 2033
- Figure 28: Europe Scuba Gear Volume (K), by Application 2025 & 2033
- Figure 29: Europe Scuba Gear Revenue Share (%), by Application 2025 & 2033
- Figure 30: Europe Scuba Gear Volume Share (%), by Application 2025 & 2033
- Figure 31: Europe Scuba Gear Revenue (undefined), by Types 2025 & 2033
- Figure 32: Europe Scuba Gear Volume (K), by Types 2025 & 2033
- Figure 33: Europe Scuba Gear Revenue Share (%), by Types 2025 & 2033
- Figure 34: Europe Scuba Gear Volume Share (%), by Types 2025 & 2033
- Figure 35: Europe Scuba Gear Revenue (undefined), by Country 2025 & 2033
- Figure 36: Europe Scuba Gear Volume (K), by Country 2025 & 2033
- Figure 37: Europe Scuba Gear Revenue Share (%), by Country 2025 & 2033
- Figure 38: Europe Scuba Gear Volume Share (%), by Country 2025 & 2033
- Figure 39: Middle East & Africa Scuba Gear Revenue (undefined), by Application 2025 & 2033
- Figure 40: Middle East & Africa Scuba Gear Volume (K), by Application 2025 & 2033
- Figure 41: Middle East & Africa Scuba Gear Revenue Share (%), by Application 2025 & 2033
- Figure 42: Middle East & Africa Scuba Gear Volume Share (%), by Application 2025 & 2033
- Figure 43: Middle East & Africa Scuba Gear Revenue (undefined), by Types 2025 & 2033
- Figure 44: Middle East & Africa Scuba Gear Volume (K), by Types 2025 & 2033
- Figure 45: Middle East & Africa Scuba Gear Revenue Share (%), by Types 2025 & 2033
- Figure 46: Middle East & Africa Scuba Gear Volume Share (%), by Types 2025 & 2033
- Figure 47: Middle East & Africa Scuba Gear Revenue (undefined), by Country 2025 & 2033
- Figure 48: Middle East & Africa Scuba Gear Volume (K), by Country 2025 & 2033
- Figure 49: Middle East & Africa Scuba Gear Revenue Share (%), by Country 2025 & 2033
- Figure 50: Middle East & Africa Scuba Gear Volume Share (%), by Country 2025 & 2033
- Figure 51: Asia Pacific Scuba Gear Revenue (undefined), by Application 2025 & 2033
- Figure 52: Asia Pacific Scuba Gear Volume (K), by Application 2025 & 2033
- Figure 53: Asia Pacific Scuba Gear Revenue Share (%), by Application 2025 & 2033
- Figure 54: Asia Pacific Scuba Gear Volume Share (%), by Application 2025 & 2033
- Figure 55: Asia Pacific Scuba Gear Revenue (undefined), by Types 2025 & 2033
- Figure 56: Asia Pacific Scuba Gear Volume (K), by Types 2025 & 2033
- Figure 57: Asia Pacific Scuba Gear Revenue Share (%), by Types 2025 & 2033
- Figure 58: Asia Pacific Scuba Gear Volume Share (%), by Types 2025 & 2033
- Figure 59: Asia Pacific Scuba Gear Revenue (undefined), by Country 2025 & 2033
- Figure 60: Asia Pacific Scuba Gear Volume (K), by Country 2025 & 2033
- Figure 61: Asia Pacific Scuba Gear Revenue Share (%), by Country 2025 & 2033
- Figure 62: Asia Pacific Scuba Gear Volume Share (%), by Country 2025 & 2033
List of Tables
- Table 1: Global Scuba Gear Revenue undefined Forecast, by Application 2020 & 2033
- Table 2: Global Scuba Gear Volume K Forecast, by Application 2020 & 2033
- Table 3: Global Scuba Gear Revenue undefined Forecast, by Types 2020 & 2033
- Table 4: Global Scuba Gear Volume K Forecast, by Types 2020 & 2033
- Table 5: Global Scuba Gear Revenue undefined Forecast, by Region 2020 & 2033
- Table 6: Global Scuba Gear Volume K Forecast, by Region 2020 & 2033
- Table 7: Global Scuba Gear Revenue undefined Forecast, by Application 2020 & 2033
- Table 8: Global Scuba Gear Volume K Forecast, by Application 2020 & 2033
- Table 9: Global Scuba Gear Revenue undefined Forecast, by Types 2020 & 2033
- Table 10: Global Scuba Gear Volume K Forecast, by Types 2020 & 2033
- Table 11: Global Scuba Gear Revenue undefined Forecast, by Country 2020 & 2033
- Table 12: Global Scuba Gear Volume K Forecast, by Country 2020 & 2033
- Table 13: United States Scuba Gear Revenue (undefined) Forecast, by Application 2020 & 2033
- Table 14: United States Scuba Gear Volume (K) Forecast, by Application 2020 & 2033
- Table 15: Canada Scuba Gear Revenue (undefined) Forecast, by Application 2020 & 2033
- Table 16: Canada Scuba Gear Volume (K) Forecast, by Application 2020 & 2033
- Table 17: Mexico Scuba Gear Revenue (undefined) Forecast, by Application 2020 & 2033
- Table 18: Mexico Scuba Gear Volume (K) Forecast, by Application 2020 & 2033
- Table 19: Global Scuba Gear Revenue undefined Forecast, by Application 2020 & 2033
- Table 20: Global Scuba Gear Volume K Forecast, by Application 2020 & 2033
- Table 21: Global Scuba Gear Revenue undefined Forecast, by Types 2020 & 2033
- Table 22: Global Scuba Gear Volume K Forecast, by Types 2020 & 2033
- Table 23: Global Scuba Gear Revenue undefined Forecast, by Country 2020 & 2033
- Table 24: Global Scuba Gear Volume K Forecast, by Country 2020 & 2033
- Table 25: Brazil Scuba Gear Revenue (undefined) Forecast, by Application 2020 & 2033
- Table 26: Brazil Scuba Gear Volume (K) Forecast, by Application 2020 & 2033
- Table 27: Argentina Scuba Gear Revenue (undefined) Forecast, by Application 2020 & 2033
- Table 28: Argentina Scuba Gear Volume (K) Forecast, by Application 2020 & 2033
- Table 29: Rest of South America Scuba Gear Revenue (undefined) Forecast, by Application 2020 & 2033
- Table 30: Rest of South America Scuba Gear Volume (K) Forecast, by Application 2020 & 2033
- Table 31: Global Scuba Gear Revenue undefined Forecast, by Application 2020 & 2033
- Table 32: Global Scuba Gear Volume K Forecast, by Application 2020 & 2033
- Table 33: Global Scuba Gear Revenue undefined Forecast, by Types 2020 & 2033
- Table 34: Global Scuba Gear Volume K Forecast, by Types 2020 & 2033
- Table 35: Global Scuba Gear Revenue undefined Forecast, by Country 2020 & 2033
- Table 36: Global Scuba Gear Volume K Forecast, by Country 2020 & 2033
- Table 37: United Kingdom Scuba Gear Revenue (undefined) Forecast, by Application 2020 & 2033
- Table 38: United Kingdom Scuba Gear Volume (K) Forecast, by Application 2020 & 2033
- Table 39: Germany Scuba Gear Revenue (undefined) Forecast, by Application 2020 & 2033
- Table 40: Germany Scuba Gear Volume (K) Forecast, by Application 2020 & 2033
- Table 41: France Scuba Gear Revenue (undefined) Forecast, by Application 2020 & 2033
- Table 42: France Scuba Gear Volume (K) Forecast, by Application 2020 & 2033
- Table 43: Italy Scuba Gear Revenue (undefined) Forecast, by Application 2020 & 2033
- Table 44: Italy Scuba Gear Volume (K) Forecast, by Application 2020 & 2033
- Table 45: Spain Scuba Gear Revenue (undefined) Forecast, by Application 2020 & 2033
- Table 46: Spain Scuba Gear Volume (K) Forecast, by Application 2020 & 2033
- Table 47: Russia Scuba Gear Revenue (undefined) Forecast, by Application 2020 & 2033
- Table 48: Russia Scuba Gear Volume (K) Forecast, by Application 2020 & 2033
- Table 49: Benelux Scuba Gear Revenue (undefined) Forecast, by Application 2020 & 2033
- Table 50: Benelux Scuba Gear Volume (K) Forecast, by Application 2020 & 2033
- Table 51: Nordics Scuba Gear Revenue (undefined) Forecast, by Application 2020 & 2033
- Table 52: Nordics Scuba Gear Volume (K) Forecast, by Application 2020 & 2033
- Table 53: Rest of Europe Scuba Gear Revenue (undefined) Forecast, by Application 2020 & 2033
- Table 54: Rest of Europe Scuba Gear Volume (K) Forecast, by Application 2020 & 2033
- Table 55: Global Scuba Gear Revenue undefined Forecast, by Application 2020 & 2033
- Table 56: Global Scuba Gear Volume K Forecast, by Application 2020 & 2033
- Table 57: Global Scuba Gear Revenue undefined Forecast, by Types 2020 & 2033
- Table 58: Global Scuba Gear Volume K Forecast, by Types 2020 & 2033
- Table 59: Global Scuba Gear Revenue undefined Forecast, by Country 2020 & 2033
- Table 60: Global Scuba Gear Volume K Forecast, by Country 2020 & 2033
- Table 61: Turkey Scuba Gear Revenue (undefined) Forecast, by Application 2020 & 2033
- Table 62: Turkey Scuba Gear Volume (K) Forecast, by Application 2020 & 2033
- Table 63: Israel Scuba Gear Revenue (undefined) Forecast, by Application 2020 & 2033
- Table 64: Israel Scuba Gear Volume (K) Forecast, by Application 2020 & 2033
- Table 65: GCC Scuba Gear Revenue (undefined) Forecast, by Application 2020 & 2033
- Table 66: GCC Scuba Gear Volume (K) Forecast, by Application 2020 & 2033
- Table 67: North Africa Scuba Gear Revenue (undefined) Forecast, by Application 2020 & 2033
- Table 68: North Africa Scuba Gear Volume (K) Forecast, by Application 2020 & 2033
- Table 69: South Africa Scuba Gear Revenue (undefined) Forecast, by Application 2020 & 2033
- Table 70: South Africa Scuba Gear Volume (K) Forecast, by Application 2020 & 2033
- Table 71: Rest of Middle East & Africa Scuba Gear Revenue (undefined) Forecast, by Application 2020 & 2033
- Table 72: Rest of Middle East & Africa Scuba Gear Volume (K) Forecast, by Application 2020 & 2033
- Table 73: Global Scuba Gear Revenue undefined Forecast, by Application 2020 & 2033
- Table 74: Global Scuba Gear Volume K Forecast, by Application 2020 & 2033
- Table 75: Global Scuba Gear Revenue undefined Forecast, by Types 2020 & 2033
- Table 76: Global Scuba Gear Volume K Forecast, by Types 2020 & 2033
- Table 77: Global Scuba Gear Revenue undefined Forecast, by Country 2020 & 2033
- Table 78: Global Scuba Gear Volume K Forecast, by Country 2020 & 2033
- Table 79: China Scuba Gear Revenue (undefined) Forecast, by Application 2020 & 2033
- Table 80: China Scuba Gear Volume (K) Forecast, by Application 2020 & 2033
- Table 81: India Scuba Gear Revenue (undefined) Forecast, by Application 2020 & 2033
- Table 82: India Scuba Gear Volume (K) Forecast, by Application 2020 & 2033
- Table 83: Japan Scuba Gear Revenue (undefined) Forecast, by Application 2020 & 2033
- Table 84: Japan Scuba Gear Volume (K) Forecast, by Application 2020 & 2033
- Table 85: South Korea Scuba Gear Revenue (undefined) Forecast, by Application 2020 & 2033
- Table 86: South Korea Scuba Gear Volume (K) Forecast, by Application 2020 & 2033
- Table 87: ASEAN Scuba Gear Revenue (undefined) Forecast, by Application 2020 & 2033
- Table 88: ASEAN Scuba Gear Volume (K) Forecast, by Application 2020 & 2033
- Table 89: Oceania Scuba Gear Revenue (undefined) Forecast, by Application 2020 & 2033
- Table 90: Oceania Scuba Gear Volume (K) Forecast, by Application 2020 & 2033
- Table 91: Rest of Asia Pacific Scuba Gear Revenue (undefined) Forecast, by Application 2020 & 2033
- Table 92: Rest of Asia Pacific Scuba Gear Volume (K) Forecast, by Application 2020 & 2033
Frequently Asked Questions
1. What is the projected Compound Annual Growth Rate (CAGR) of the Scuba Gear?
The projected CAGR is approximately 4.9%.
2. Which companies are prominent players in the Scuba Gear?
Key companies in the market include Aqua Lung, Johnson Outdoors, Mares, Poseidon, Tusa, Seac, Sherwood Scuba, American Underwater Products, Saekodive, Cressi, Beuchat International, IST Sports, Dive Rite, Aquatec-Duton, Zeagles Systems, H2Odyssey, Atomic Aquatics.
3. What are the main segments of the Scuba Gear?
The market segments include Application, Types.
4. Can you provide details about the market size?
The market size is estimated to be USD XXX N/A as of 2022.
5. What are some drivers contributing to market growth?
N/A
6. What are the notable trends driving market growth?
N/A
7. Are there any restraints impacting market growth?
N/A
8. Can you provide examples of recent developments in the market?
N/A
9. What pricing options are available for accessing the report?
Pricing options include single-user, multi-user, and enterprise licenses priced at USD 4350.00, USD 6525.00, and USD 8700.00 respectively.
10. Is the market size provided in terms of value or volume?
The market size is provided in terms of value, measured in N/A and volume, measured in K.
11. Are there any specific market keywords associated with the report?
Yes, the market keyword associated with the report is "Scuba Gear," which aids in identifying and referencing the specific market segment covered.
12. How do I determine which pricing option suits my needs best?
The pricing options vary based on user requirements and access needs. Individual users may opt for single-user licenses, while businesses requiring broader access may choose multi-user or enterprise licenses for cost-effective access to the report.
13. Are there any additional resources or data provided in the Scuba Gear report?
While the report offers comprehensive insights, it's advisable to review the specific contents or supplementary materials provided to ascertain if additional resources or data are available.
14. How can I stay updated on further developments or reports in the Scuba Gear?
To stay informed about further developments, trends, and reports in the Scuba Gear, consider subscribing to industry newsletters, following relevant companies and organizations, or regularly checking reputable industry news sources and publications.
Methodology
Step 1 - Identification of Relevant Samples Size from Population Database


Step 2 - Approaches for Defining Global Market Size (Value, Volume* & Price*)

Note*: In applicable scenarios
Step 3 - Data Sources
Primary Research
- Web Analytics
- Survey Reports
- Research Institute
- Latest Research Reports
- Opinion Leaders
Secondary Research
- Annual Reports
- White Paper
- Latest Press Release
- Industry Association
- Paid Database
- Investor Presentations

Step 4 - Data Triangulation
Involves using different sources of information in order to increase the validity of a study
These sources are likely to be stakeholders in a program - participants, other researchers, program staff, other community members, and so on.
Then we put all data in single framework & apply various statistical tools to find out the dynamic on the market.
During the analysis stage, feedback from the stakeholder groups would be compared to determine areas of agreement as well as areas of divergence