

Key Insights
India's Sealants Market Poised for Strong Growth: Key Drivers and Trends. The Indian sealants market is projected for substantial expansion, with an estimated Compound Annual Growth Rate (CAGR) of 7.42%. This dynamic market is anticipated to reach approximately 339.78 million by 2025, building on its robust performance from 2019 to 2024. Key growth catalysts include the booming construction industry, fueled by rapid urbanization and government infrastructure development initiatives. Increased sealant adoption across diverse sectors like automotive, aerospace, and packaging, driven by the demand for enhanced durability and performance, is a significant contributor. Technological advancements in sealant formulations, offering improved weather resistance, flexibility, and adhesion, are further propelling market expansion. The growing preference for high-performance, eco-friendly sealant solutions is also shaping industry trends. While raw material price volatility and supply chain disruptions present challenges, the market outlook remains highly positive, supported by sustained demand and ongoing innovation.
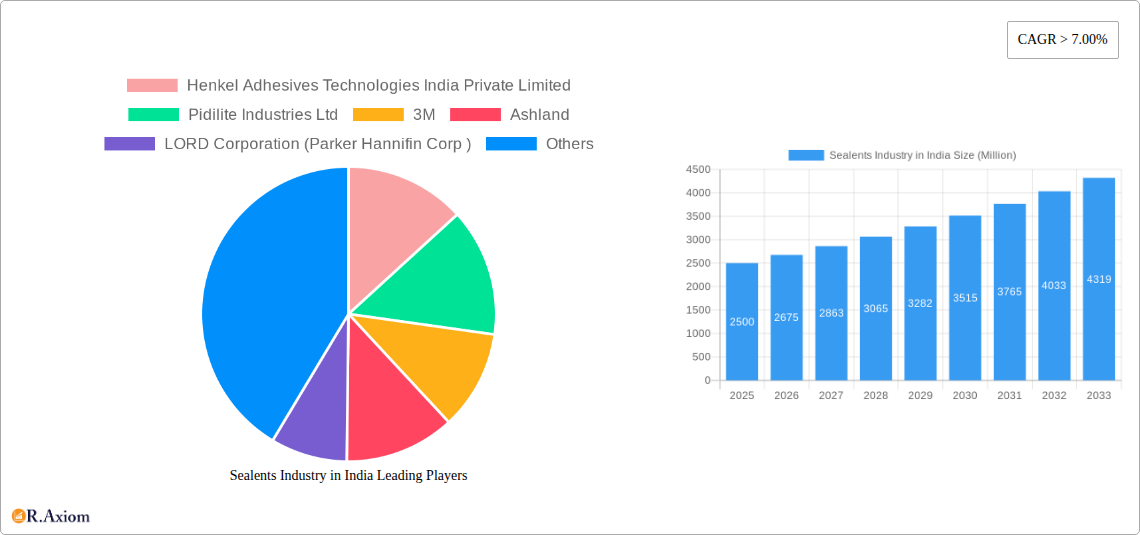
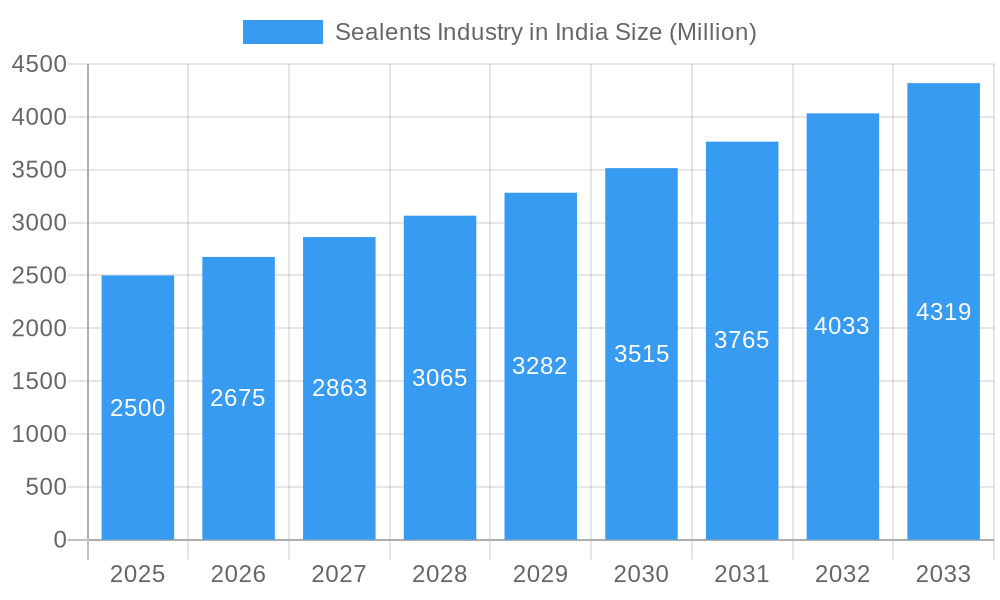
Sealents Industry in India Market Size (In Million)
The competitive landscape is characterized by intense rivalry between domestic and international players. Leading companies such as Pidilite Industries, Henkel, 3M, and Sika are actively investing in product diversification and distribution network expansion to secure greater market share. The market is segmented by resin type (polyurethane, epoxy, silicone, acrylic), technology (solvent-borne, reactive, hot melt, UV cured), and end-user industry. Polyurethane sealants currently dominate the market due to their versatility and broad application. However, rising environmental consciousness is fostering the adoption of eco-friendly alternatives, creating growth opportunities for silicone and acrylic-based sealants. Regional growth patterns are expected to vary, with metropolitan areas and rapidly developing regions showing the highest demand.
Sealents Industry in India Company Market Share
Sealants Industry in India: A Comprehensive Market Report (2019-2033)
This in-depth report provides a comprehensive analysis of the Sealants Industry in India, covering market size, segmentation, key players, growth drivers, challenges, and future opportunities. The study period spans from 2019 to 2033, with 2025 serving as the base and estimated year. This report is essential for industry stakeholders, investors, and strategic decision-makers seeking actionable insights into this dynamic market.
Sealents Industry in India Market Concentration & Innovation
The Indian sealants market exhibits a moderately concentrated landscape, dominated by a mix of multinational corporations and domestic players. Key players such as Pidilite Industries Ltd, 3M, Henkel, and Ashland hold significant market share, estimated at xx Million in 2025, collectively accounting for approximately xx% of the total market. However, the presence of several smaller, regional players ensures a competitive environment. Innovation is driven by increasing demand for specialized sealants with enhanced properties like high temperature resistance, UV stability, and biodegradability. Stringent environmental regulations are pushing the adoption of eco-friendly sealants, creating new opportunities for innovative formulations. The regulatory framework, while generally supportive of industry growth, necessitates compliance with safety and environmental standards. Product substitution is a key dynamic, with manufacturers constantly striving to offer superior performance and cost-effectiveness compared to traditional materials. End-user trends, such as the rising construction sector and the growing automotive industry, are major drivers of market expansion.
M&A activity has played a significant role in shaping the market. Notable transactions include:
- November 2020: Pidilite Industries' acquisition of Huntsman Group's Indian subsidiary for Rupee 2,100 crore (approximately xx Million USD) significantly expanded its product portfolio.
- May 2022: Azelis' acquisition of Chemo India and Unipharm Laboratories strengthened its presence in the CASE (Coatings, Adhesives, Sealants, Elastomers) segment. Further M&A activity is anticipated, driven by the desire for increased market share and access to new technologies. The total value of M&A deals in the Indian sealants market during the historical period (2019-2024) is estimated at xx Million USD.
Sealents Industry in India Industry Trends & Insights
The Indian sealants market is experiencing robust growth, driven by a confluence of factors. The construction sector, fueled by government infrastructure projects and rising urbanization, is a major driver, exhibiting a CAGR of xx% during the forecast period (2025-2033). The automotive industry’s expansion, particularly in the passenger vehicle segment, contributes significantly to demand. Technological advancements, such as the development of high-performance sealants with improved durability and adhesion properties, are further propelling market expansion. Consumer preferences are shifting towards eco-friendly and sustainable sealants, leading to increased adoption of water-based and bio-based alternatives. Competitive dynamics are characterized by intense rivalry among established players and the emergence of new entrants, fostering innovation and price competition. Market penetration of advanced sealants, such as those utilizing nanotechnology, is gradually increasing, while the market share of conventional sealants is declining. The overall market is expected to reach xx Million by 2033, driven by a CAGR of xx% from 2025 to 2033.
Dominant Markets & Segments in Sealants Industry in India
The Building and Construction sector constitutes the largest end-user segment in the Indian sealants market, commanding approximately xx% of the market share in 2025. This dominance is fueled by robust growth in residential and commercial construction, coupled with infrastructure development initiatives.
Key Drivers for Building & Construction Segment Dominance:
- Government infrastructure projects: Significant investments in roads, bridges, and other infrastructure projects are driving demand.
- Rising urbanization: Rapid urbanization is leading to increased construction activity in both rural and urban areas.
- Favorable economic policies: Government policies aimed at promoting affordable housing are boosting the construction sector.
Within the resin type segmentation, Polyurethane sealants hold the largest market share due to their versatility, durability, and superior performance characteristics. Solvent-borne adhesives also maintain a significant share owing to their established usage and cost-effectiveness. However, the market is witnessing a gradual shift towards water-based and reactive adhesives driven by environmental considerations. The Southern and Western regions of India represent the most significant regional markets, fueled by higher levels of construction activity and industrial development.
Sealents Industry in India Product Developments
Recent product innovations focus on enhanced performance characteristics, such as improved adhesion, durability, and resistance to extreme temperatures and UV exposure. Manufacturers are also focusing on developing eco-friendly formulations that minimize environmental impact. These innovations are driven by stringent environmental regulations and growing consumer preference for sustainable products. The key competitive advantages stem from superior performance, cost-effectiveness, and tailored solutions to meet specific end-user requirements. Technological trends are moving towards bio-based sealants, nanotechnology-enhanced formulations, and smart sealants that incorporate sensors for improved monitoring and maintenance.
Report Scope & Segmentation Analysis
This report segments the Indian sealants market by resin type (Polyurethane, Epoxy, Acrylic, Silicone, Cyanoacrylate, VAE/EVA, Other Resins), technology (Solvent-borne, Reactive, Hot Melt, UV Cured Adhesives), and end-user industry (Aerospace, Automotive, Building and Construction, Footwear and Leather, Healthcare, Packaging, Woodworking & Joinery, Other End-user Industries). Each segment's growth projections, market size (in Million USD), and competitive dynamics are analyzed in detail. For instance, the Polyurethane segment is projected to experience the highest growth due to its versatility, while the Building and Construction end-user segment will remain the largest market. The competitive landscape varies across segments, with different players holding dominance in different areas.
Key Drivers of Sealents Industry in India Growth
The Indian sealants market's growth is propelled by several key factors:
- Booming construction sector: Government initiatives and rising urbanization are fueling construction activity.
- Automotive industry expansion: Increased vehicle production and a growing middle class drive demand.
- Technological advancements: Innovation in sealant formulations leads to improved performance.
- Favorable government policies: Incentives and infrastructure development plans stimulate growth.
Challenges in the Sealants Industry in India Sector
The industry faces challenges including:
- Fluctuating raw material prices: This impacts profitability and pricing strategies.
- Stringent environmental regulations: Compliance with emission norms necessitates investments.
- Intense competition: Established players and new entrants create a competitive landscape.
- Supply chain disruptions: Global events can affect raw material availability and delivery times.
Emerging Opportunities in Sealents Industry in India
Emerging opportunities include:
- Growing demand for specialized sealants: This creates niche market segments with high growth potential.
- Expansion into new end-user industries: Exploration of applications in renewable energy and other sectors.
- Adoption of sustainable and eco-friendly sealants: Meeting increasing consumer demand for environmentally conscious products.
- Development of smart sealants: Integration of sensors and other technologies for improved functionality.
Leading Players in the Sealants Industry in India Market
- Henkel Adhesives Technologies India Private Limited
- Pidilite Industries Ltd
- 3M
- Ashland
- LORD Corporation (Parker Hannifin Corp)
- Arkema Group
- Jubilant Industries Ltd
- Huntsman International LLC
- Dow
- H B Fuller Company
- ASTRAL ADHESIVES
- Sika AG
- MAPEI SpA
- Atul Ltd
- AVERY DENNISON CORPORATION
Key Developments in Sealents Industry in India Industry
- November 2020: Pidilite Industries acquired Huntsman Group's Indian subsidiary for Rupee 2,100 crore (approximately xx Million USD), expanding its product portfolio.
- May 2022: Azelis expanded its presence in India through the acquisition of Chemo India and Unipharm Laboratories, strengthening its position in the CASE segment.
Strategic Outlook for Sealents Industry in India Market
The Indian sealants market presents significant growth potential driven by sustained growth in key end-user sectors, technological innovation, and favorable government policies. The focus on sustainable and high-performance sealants will shape future market dynamics. Companies adopting strategic initiatives, such as mergers and acquisitions, product diversification, and investment in R&D, are poised to capitalize on the market's expanding opportunities. The market is expected to witness continued consolidation and increasing competition among players.
Sealents Industry in India Segmentation
-
1. Adhesives Resin
- 1.1. Polyurethane
- 1.2. Epoxy
- 1.3. Acrylic
- 1.4. Silicone
- 1.5. Cyanoacrylate
- 1.6. VAE/EVA
- 1.7. Other Resins
-
2. Adhesives Technology
- 2.1. Solvent-borne
- 2.2. Reactive
- 2.3. Hot Melt
- 2.4. UV Cured Adhesives
-
3. Sealants Resin
- 3.1. Polyurethane
- 3.2. Epoxy
- 3.3. Acrylic
- 3.4. Silicone
- 3.5. Other Resins
-
4. End-user Industry
- 4.1. Aerospace
- 4.2. Automotive
- 4.3. Building and Construction
- 4.4. Footwear and Leather
- 4.5. Healthcare
- 4.6. Packaging
- 4.7. Woodworking And Joinery
- 4.8. Other End-user Industries
Sealents Industry in India Segmentation By Geography
-
1. North America
- 1.1. United States
- 1.2. Canada
- 1.3. Mexico
-
2. South America
- 2.1. Brazil
- 2.2. Argentina
- 2.3. Rest of South America
-
3. Europe
- 3.1. United Kingdom
- 3.2. Germany
- 3.3. France
- 3.4. Italy
- 3.5. Spain
- 3.6. Russia
- 3.7. Benelux
- 3.8. Nordics
- 3.9. Rest of Europe
-
4. Middle East & Africa
- 4.1. Turkey
- 4.2. Israel
- 4.3. GCC
- 4.4. North Africa
- 4.5. South Africa
- 4.6. Rest of Middle East & Africa
-
5. Asia Pacific
- 5.1. China
- 5.2. India
- 5.3. Japan
- 5.4. South Korea
- 5.5. ASEAN
- 5.6. Oceania
- 5.7. Rest of Asia Pacific
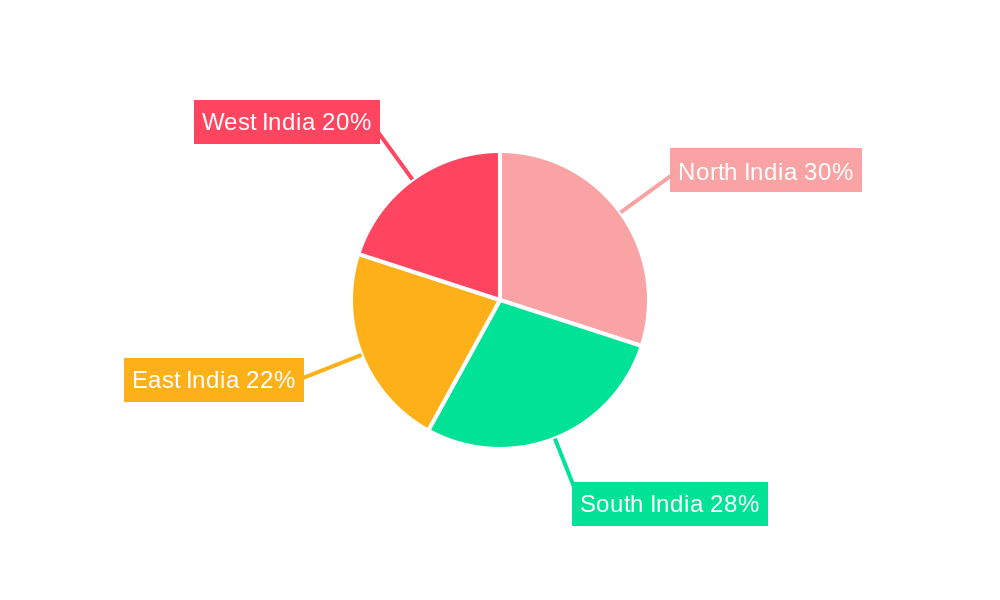
Sealents Industry in India Regional Market Share
Geographic Coverage of Sealents Industry in India
Sealents Industry in India REPORT HIGHLIGHTS
| Aspects | Details |
|---|---|
| Study Period | 2020-2034 |
| Base Year | 2025 |
| Estimated Year | 2026 |
| Forecast Period | 2026-2034 |
| Historical Period | 2020-2025 |
| Growth Rate | CAGR of 7.42% from 2020-2034 |
| Segmentation |
|
Table of Contents
- 1. Introduction
- 1.1. Research Scope
- 1.2. Market Segmentation
- 1.3. Research Objective
- 1.4. Definitions and Assumptions
- 2. Executive Summary
- 2.1. Market Snapshot
- 3. Market Dynamics
- 3.1. Market Drivers
- 3.2. Market Restrains
- 3.3. Market Trends
- 3.4. Market Opportunities
- 4. Market Factor Analysis
- 4.1. Porters Five Forces
- 4.1.1. Bargaining Power of Suppliers
- 4.1.2. Bargaining Power of Buyers
- 4.1.3. Threat of New Entrants
- 4.1.4. Threat of Substitutes
- 4.1.5. Competitive Rivalry
- 4.2. PESTEL analysis
- 4.3. BCG Analysis
- 4.3.1. Stars (High Growth, High Market Share)
- 4.3.2. Cash Cows (Low Growth, High Market Share)
- 4.3.3. Question Mark (High Growth, Low Market Share)
- 4.3.4. Dogs (Low Growth, Low Market Share)
- 4.4. Ansoff Matrix Analysis
- 4.5. Supply Chain Analysis
- 4.6. Regulatory Landscape
- 4.7. Current Market Potential and Opportunity Assessment (TAM–SAM–SOM Framework)
- 4.8. RAX Analyst Note
- 4.1. Porters Five Forces
- 5. Market Analysis, Insights and Forecast 2021-2033
- 5.1. Market Analysis, Insights and Forecast - by Adhesives Resin
- 5.1.1. Polyurethane
- 5.1.2. Epoxy
- 5.1.3. Acrylic
- 5.1.4. Silicone
- 5.1.5. Cyanoacrylate
- 5.1.6. VAE/EVA
- 5.1.7. Other Resins
- 5.2. Market Analysis, Insights and Forecast - by Adhesives Technology
- 5.2.1. Solvent-borne
- 5.2.2. Reactive
- 5.2.3. Hot Melt
- 5.2.4. UV Cured Adhesives
- 5.3. Market Analysis, Insights and Forecast - by Sealants Resin
- 5.3.1. Polyurethane
- 5.3.2. Epoxy
- 5.3.3. Acrylic
- 5.3.4. Silicone
- 5.3.5. Other Resins
- 5.4. Market Analysis, Insights and Forecast - by End-user Industry
- 5.4.1. Aerospace
- 5.4.2. Automotive
- 5.4.3. Building and Construction
- 5.4.4. Footwear and Leather
- 5.4.5. Healthcare
- 5.4.6. Packaging
- 5.4.7. Woodworking And Joinery
- 5.4.8. Other End-user Industries
- 5.5. Market Analysis, Insights and Forecast - by Region
- 5.5.1. North America
- 5.5.2. South America
- 5.5.3. Europe
- 5.5.4. Middle East & Africa
- 5.5.5. Asia Pacific
- 5.1. Market Analysis, Insights and Forecast - by Adhesives Resin
- 6. Global Sealents Industry in India Analysis, Insights and Forecast, 2021-2033
- 6.1. Market Analysis, Insights and Forecast - by Adhesives Resin
- 6.1.1. Polyurethane
- 6.1.2. Epoxy
- 6.1.3. Acrylic
- 6.1.4. Silicone
- 6.1.5. Cyanoacrylate
- 6.1.6. VAE/EVA
- 6.1.7. Other Resins
- 6.2. Market Analysis, Insights and Forecast - by Adhesives Technology
- 6.2.1. Solvent-borne
- 6.2.2. Reactive
- 6.2.3. Hot Melt
- 6.2.4. UV Cured Adhesives
- 6.3. Market Analysis, Insights and Forecast - by Sealants Resin
- 6.3.1. Polyurethane
- 6.3.2. Epoxy
- 6.3.3. Acrylic
- 6.3.4. Silicone
- 6.3.5. Other Resins
- 6.4. Market Analysis, Insights and Forecast - by End-user Industry
- 6.4.1. Aerospace
- 6.4.2. Automotive
- 6.4.3. Building and Construction
- 6.4.4. Footwear and Leather
- 6.4.5. Healthcare
- 6.4.6. Packaging
- 6.4.7. Woodworking And Joinery
- 6.4.8. Other End-user Industries
- 6.1. Market Analysis, Insights and Forecast - by Adhesives Resin
- 7. North America Sealents Industry in India Analysis, Insights and Forecast, 2020-2032
- 7.1. Market Analysis, Insights and Forecast - by Adhesives Resin
- 7.1.1. Polyurethane
- 7.1.2. Epoxy
- 7.1.3. Acrylic
- 7.1.4. Silicone
- 7.1.5. Cyanoacrylate
- 7.1.6. VAE/EVA
- 7.1.7. Other Resins
- 7.2. Market Analysis, Insights and Forecast - by Adhesives Technology
- 7.2.1. Solvent-borne
- 7.2.2. Reactive
- 7.2.3. Hot Melt
- 7.2.4. UV Cured Adhesives
- 7.3. Market Analysis, Insights and Forecast - by Sealants Resin
- 7.3.1. Polyurethane
- 7.3.2. Epoxy
- 7.3.3. Acrylic
- 7.3.4. Silicone
- 7.3.5. Other Resins
- 7.4. Market Analysis, Insights and Forecast - by End-user Industry
- 7.4.1. Aerospace
- 7.4.2. Automotive
- 7.4.3. Building and Construction
- 7.4.4. Footwear and Leather
- 7.4.5. Healthcare
- 7.4.6. Packaging
- 7.4.7. Woodworking And Joinery
- 7.4.8. Other End-user Industries
- 7.1. Market Analysis, Insights and Forecast - by Adhesives Resin
- 8. South America Sealents Industry in India Analysis, Insights and Forecast, 2020-2032
- 8.1. Market Analysis, Insights and Forecast - by Adhesives Resin
- 8.1.1. Polyurethane
- 8.1.2. Epoxy
- 8.1.3. Acrylic
- 8.1.4. Silicone
- 8.1.5. Cyanoacrylate
- 8.1.6. VAE/EVA
- 8.1.7. Other Resins
- 8.2. Market Analysis, Insights and Forecast - by Adhesives Technology
- 8.2.1. Solvent-borne
- 8.2.2. Reactive
- 8.2.3. Hot Melt
- 8.2.4. UV Cured Adhesives
- 8.3. Market Analysis, Insights and Forecast - by Sealants Resin
- 8.3.1. Polyurethane
- 8.3.2. Epoxy
- 8.3.3. Acrylic
- 8.3.4. Silicone
- 8.3.5. Other Resins
- 8.4. Market Analysis, Insights and Forecast - by End-user Industry
- 8.4.1. Aerospace
- 8.4.2. Automotive
- 8.4.3. Building and Construction
- 8.4.4. Footwear and Leather
- 8.4.5. Healthcare
- 8.4.6. Packaging
- 8.4.7. Woodworking And Joinery
- 8.4.8. Other End-user Industries
- 8.1. Market Analysis, Insights and Forecast - by Adhesives Resin
- 9. Europe Sealents Industry in India Analysis, Insights and Forecast, 2020-2032
- 9.1. Market Analysis, Insights and Forecast - by Adhesives Resin
- 9.1.1. Polyurethane
- 9.1.2. Epoxy
- 9.1.3. Acrylic
- 9.1.4. Silicone
- 9.1.5. Cyanoacrylate
- 9.1.6. VAE/EVA
- 9.1.7. Other Resins
- 9.2. Market Analysis, Insights and Forecast - by Adhesives Technology
- 9.2.1. Solvent-borne
- 9.2.2. Reactive
- 9.2.3. Hot Melt
- 9.2.4. UV Cured Adhesives
- 9.3. Market Analysis, Insights and Forecast - by Sealants Resin
- 9.3.1. Polyurethane
- 9.3.2. Epoxy
- 9.3.3. Acrylic
- 9.3.4. Silicone
- 9.3.5. Other Resins
- 9.4. Market Analysis, Insights and Forecast - by End-user Industry
- 9.4.1. Aerospace
- 9.4.2. Automotive
- 9.4.3. Building and Construction
- 9.4.4. Footwear and Leather
- 9.4.5. Healthcare
- 9.4.6. Packaging
- 9.4.7. Woodworking And Joinery
- 9.4.8. Other End-user Industries
- 9.1. Market Analysis, Insights and Forecast - by Adhesives Resin
- 10. Middle East & Africa Sealents Industry in India Analysis, Insights and Forecast, 2020-2032
- 10.1. Market Analysis, Insights and Forecast - by Adhesives Resin
- 10.1.1. Polyurethane
- 10.1.2. Epoxy
- 10.1.3. Acrylic
- 10.1.4. Silicone
- 10.1.5. Cyanoacrylate
- 10.1.6. VAE/EVA
- 10.1.7. Other Resins
- 10.2. Market Analysis, Insights and Forecast - by Adhesives Technology
- 10.2.1. Solvent-borne
- 10.2.2. Reactive
- 10.2.3. Hot Melt
- 10.2.4. UV Cured Adhesives
- 10.3. Market Analysis, Insights and Forecast - by Sealants Resin
- 10.3.1. Polyurethane
- 10.3.2. Epoxy
- 10.3.3. Acrylic
- 10.3.4. Silicone
- 10.3.5. Other Resins
- 10.4. Market Analysis, Insights and Forecast - by End-user Industry
- 10.4.1. Aerospace
- 10.4.2. Automotive
- 10.4.3. Building and Construction
- 10.4.4. Footwear and Leather
- 10.4.5. Healthcare
- 10.4.6. Packaging
- 10.4.7. Woodworking And Joinery
- 10.4.8. Other End-user Industries
- 10.1. Market Analysis, Insights and Forecast - by Adhesives Resin
- 11. Asia Pacific Sealents Industry in India Analysis, Insights and Forecast, 2020-2032
- 11.1. Market Analysis, Insights and Forecast - by Adhesives Resin
- 11.1.1. Polyurethane
- 11.1.2. Epoxy
- 11.1.3. Acrylic
- 11.1.4. Silicone
- 11.1.5. Cyanoacrylate
- 11.1.6. VAE/EVA
- 11.1.7. Other Resins
- 11.2. Market Analysis, Insights and Forecast - by Adhesives Technology
- 11.2.1. Solvent-borne
- 11.2.2. Reactive
- 11.2.3. Hot Melt
- 11.2.4. UV Cured Adhesives
- 11.3. Market Analysis, Insights and Forecast - by Sealants Resin
- 11.3.1. Polyurethane
- 11.3.2. Epoxy
- 11.3.3. Acrylic
- 11.3.4. Silicone
- 11.3.5. Other Resins
- 11.4. Market Analysis, Insights and Forecast - by End-user Industry
- 11.4.1. Aerospace
- 11.4.2. Automotive
- 11.4.3. Building and Construction
- 11.4.4. Footwear and Leather
- 11.4.5. Healthcare
- 11.4.6. Packaging
- 11.4.7. Woodworking And Joinery
- 11.4.8. Other End-user Industries
- 11.1. Market Analysis, Insights and Forecast - by Adhesives Resin
- 12. Competitive Analysis
- 12.1. Company Profiles
- 12.1.1 Henkel Adhesives Technologies India Private Limited
- 12.1.1.1. Company Overview
- 12.1.1.2. Products
- 12.1.1.3. Company Financials
- 12.1.1.4. SWOT Analysis
- 12.1.2 Pidilite Industries Ltd
- 12.1.2.1. Company Overview
- 12.1.2.2. Products
- 12.1.2.3. Company Financials
- 12.1.2.4. SWOT Analysis
- 12.1.3 3M
- 12.1.3.1. Company Overview
- 12.1.3.2. Products
- 12.1.3.3. Company Financials
- 12.1.3.4. SWOT Analysis
- 12.1.4 Ashland
- 12.1.4.1. Company Overview
- 12.1.4.2. Products
- 12.1.4.3. Company Financials
- 12.1.4.4. SWOT Analysis
- 12.1.5 LORD Corporation (Parker Hannifin Corp )
- 12.1.5.1. Company Overview
- 12.1.5.2. Products
- 12.1.5.3. Company Financials
- 12.1.5.4. SWOT Analysis
- 12.1.6 Arkema Group
- 12.1.6.1. Company Overview
- 12.1.6.2. Products
- 12.1.6.3. Company Financials
- 12.1.6.4. SWOT Analysis
- 12.1.7 Jubilant Industries Ltd
- 12.1.7.1. Company Overview
- 12.1.7.2. Products
- 12.1.7.3. Company Financials
- 12.1.7.4. SWOT Analysis
- 12.1.8 Huntsman International LLC
- 12.1.8.1. Company Overview
- 12.1.8.2. Products
- 12.1.8.3. Company Financials
- 12.1.8.4. SWOT Analysis
- 12.1.9 Dow
- 12.1.9.1. Company Overview
- 12.1.9.2. Products
- 12.1.9.3. Company Financials
- 12.1.9.4. SWOT Analysis
- 12.1.10 H B Fuller Company
- 12.1.10.1. Company Overview
- 12.1.10.2. Products
- 12.1.10.3. Company Financials
- 12.1.10.4. SWOT Analysis
- 12.1.11 ASTRAL ADHESIVES
- 12.1.11.1. Company Overview
- 12.1.11.2. Products
- 12.1.11.3. Company Financials
- 12.1.11.4. SWOT Analysis
- 12.1.12 Sika AG*List Not Exhaustive
- 12.1.12.1. Company Overview
- 12.1.12.2. Products
- 12.1.12.3. Company Financials
- 12.1.12.4. SWOT Analysis
- 12.1.13 MAPEI SpA
- 12.1.13.1. Company Overview
- 12.1.13.2. Products
- 12.1.13.3. Company Financials
- 12.1.13.4. SWOT Analysis
- 12.1.14 Atul Ltd
- 12.1.14.1. Company Overview
- 12.1.14.2. Products
- 12.1.14.3. Company Financials
- 12.1.14.4. SWOT Analysis
- 12.1.15 AVERY DENNISON CORPORATION
- 12.1.15.1. Company Overview
- 12.1.15.2. Products
- 12.1.15.3. Company Financials
- 12.1.15.4. SWOT Analysis
- 12.1.1 Henkel Adhesives Technologies India Private Limited
- 12.2. Market Entropy
- 12.2.1 Company's Key Areas Served
- 12.2.2 Recent Developments
- 12.3. Company Market Share Analysis 2025
- 12.3.1 Top 5 Companies Market Share Analysis
- 12.3.2 Top 3 Companies Market Share Analysis
- 12.4. List of Potential Customers
- 13. Research Methodology
List of Figures
- Figure 1: Global Sealents Industry in India Revenue Breakdown (million, %) by Region 2025 & 2033
- Figure 2: North America Sealents Industry in India Revenue (million), by Adhesives Resin 2025 & 2033
- Figure 3: North America Sealents Industry in India Revenue Share (%), by Adhesives Resin 2025 & 2033
- Figure 4: North America Sealents Industry in India Revenue (million), by Adhesives Technology 2025 & 2033
- Figure 5: North America Sealents Industry in India Revenue Share (%), by Adhesives Technology 2025 & 2033
- Figure 6: North America Sealents Industry in India Revenue (million), by Sealants Resin 2025 & 2033
- Figure 7: North America Sealents Industry in India Revenue Share (%), by Sealants Resin 2025 & 2033
- Figure 8: North America Sealents Industry in India Revenue (million), by End-user Industry 2025 & 2033
- Figure 9: North America Sealents Industry in India Revenue Share (%), by End-user Industry 2025 & 2033
- Figure 10: North America Sealents Industry in India Revenue (million), by Country 2025 & 2033
- Figure 11: North America Sealents Industry in India Revenue Share (%), by Country 2025 & 2033
- Figure 12: South America Sealents Industry in India Revenue (million), by Adhesives Resin 2025 & 2033
- Figure 13: South America Sealents Industry in India Revenue Share (%), by Adhesives Resin 2025 & 2033
- Figure 14: South America Sealents Industry in India Revenue (million), by Adhesives Technology 2025 & 2033
- Figure 15: South America Sealents Industry in India Revenue Share (%), by Adhesives Technology 2025 & 2033
- Figure 16: South America Sealents Industry in India Revenue (million), by Sealants Resin 2025 & 2033
- Figure 17: South America Sealents Industry in India Revenue Share (%), by Sealants Resin 2025 & 2033
- Figure 18: South America Sealents Industry in India Revenue (million), by End-user Industry 2025 & 2033
- Figure 19: South America Sealents Industry in India Revenue Share (%), by End-user Industry 2025 & 2033
- Figure 20: South America Sealents Industry in India Revenue (million), by Country 2025 & 2033
- Figure 21: South America Sealents Industry in India Revenue Share (%), by Country 2025 & 2033
- Figure 22: Europe Sealents Industry in India Revenue (million), by Adhesives Resin 2025 & 2033
- Figure 23: Europe Sealents Industry in India Revenue Share (%), by Adhesives Resin 2025 & 2033
- Figure 24: Europe Sealents Industry in India Revenue (million), by Adhesives Technology 2025 & 2033
- Figure 25: Europe Sealents Industry in India Revenue Share (%), by Adhesives Technology 2025 & 2033
- Figure 26: Europe Sealents Industry in India Revenue (million), by Sealants Resin 2025 & 2033
- Figure 27: Europe Sealents Industry in India Revenue Share (%), by Sealants Resin 2025 & 2033
- Figure 28: Europe Sealents Industry in India Revenue (million), by End-user Industry 2025 & 2033
- Figure 29: Europe Sealents Industry in India Revenue Share (%), by End-user Industry 2025 & 2033
- Figure 30: Europe Sealents Industry in India Revenue (million), by Country 2025 & 2033
- Figure 31: Europe Sealents Industry in India Revenue Share (%), by Country 2025 & 2033
- Figure 32: Middle East & Africa Sealents Industry in India Revenue (million), by Adhesives Resin 2025 & 2033
- Figure 33: Middle East & Africa Sealents Industry in India Revenue Share (%), by Adhesives Resin 2025 & 2033
- Figure 34: Middle East & Africa Sealents Industry in India Revenue (million), by Adhesives Technology 2025 & 2033
- Figure 35: Middle East & Africa Sealents Industry in India Revenue Share (%), by Adhesives Technology 2025 & 2033
- Figure 36: Middle East & Africa Sealents Industry in India Revenue (million), by Sealants Resin 2025 & 2033
- Figure 37: Middle East & Africa Sealents Industry in India Revenue Share (%), by Sealants Resin 2025 & 2033
- Figure 38: Middle East & Africa Sealents Industry in India Revenue (million), by End-user Industry 2025 & 2033
- Figure 39: Middle East & Africa Sealents Industry in India Revenue Share (%), by End-user Industry 2025 & 2033
- Figure 40: Middle East & Africa Sealents Industry in India Revenue (million), by Country 2025 & 2033
- Figure 41: Middle East & Africa Sealents Industry in India Revenue Share (%), by Country 2025 & 2033
- Figure 42: Asia Pacific Sealents Industry in India Revenue (million), by Adhesives Resin 2025 & 2033
- Figure 43: Asia Pacific Sealents Industry in India Revenue Share (%), by Adhesives Resin 2025 & 2033
- Figure 44: Asia Pacific Sealents Industry in India Revenue (million), by Adhesives Technology 2025 & 2033
- Figure 45: Asia Pacific Sealents Industry in India Revenue Share (%), by Adhesives Technology 2025 & 2033
- Figure 46: Asia Pacific Sealents Industry in India Revenue (million), by Sealants Resin 2025 & 2033
- Figure 47: Asia Pacific Sealents Industry in India Revenue Share (%), by Sealants Resin 2025 & 2033
- Figure 48: Asia Pacific Sealents Industry in India Revenue (million), by End-user Industry 2025 & 2033
- Figure 49: Asia Pacific Sealents Industry in India Revenue Share (%), by End-user Industry 2025 & 2033
- Figure 50: Asia Pacific Sealents Industry in India Revenue (million), by Country 2025 & 2033
- Figure 51: Asia Pacific Sealents Industry in India Revenue Share (%), by Country 2025 & 2033
List of Tables
- Table 1: Global Sealents Industry in India Revenue million Forecast, by Adhesives Resin 2020 & 2033
- Table 2: Global Sealents Industry in India Revenue million Forecast, by Adhesives Technology 2020 & 2033
- Table 3: Global Sealents Industry in India Revenue million Forecast, by Sealants Resin 2020 & 2033
- Table 4: Global Sealents Industry in India Revenue million Forecast, by End-user Industry 2020 & 2033
- Table 5: Global Sealents Industry in India Revenue million Forecast, by Region 2020 & 2033
- Table 6: Global Sealents Industry in India Revenue million Forecast, by Adhesives Resin 2020 & 2033
- Table 7: Global Sealents Industry in India Revenue million Forecast, by Adhesives Technology 2020 & 2033
- Table 8: Global Sealents Industry in India Revenue million Forecast, by Sealants Resin 2020 & 2033
- Table 9: Global Sealents Industry in India Revenue million Forecast, by End-user Industry 2020 & 2033
- Table 10: Global Sealents Industry in India Revenue million Forecast, by Country 2020 & 2033
- Table 11: United States Sealents Industry in India Revenue (million) Forecast, by Application 2020 & 2033
- Table 12: Canada Sealents Industry in India Revenue (million) Forecast, by Application 2020 & 2033
- Table 13: Mexico Sealents Industry in India Revenue (million) Forecast, by Application 2020 & 2033
- Table 14: Global Sealents Industry in India Revenue million Forecast, by Adhesives Resin 2020 & 2033
- Table 15: Global Sealents Industry in India Revenue million Forecast, by Adhesives Technology 2020 & 2033
- Table 16: Global Sealents Industry in India Revenue million Forecast, by Sealants Resin 2020 & 2033
- Table 17: Global Sealents Industry in India Revenue million Forecast, by End-user Industry 2020 & 2033
- Table 18: Global Sealents Industry in India Revenue million Forecast, by Country 2020 & 2033
- Table 19: Brazil Sealents Industry in India Revenue (million) Forecast, by Application 2020 & 2033
- Table 20: Argentina Sealents Industry in India Revenue (million) Forecast, by Application 2020 & 2033
- Table 21: Rest of South America Sealents Industry in India Revenue (million) Forecast, by Application 2020 & 2033
- Table 22: Global Sealents Industry in India Revenue million Forecast, by Adhesives Resin 2020 & 2033
- Table 23: Global Sealents Industry in India Revenue million Forecast, by Adhesives Technology 2020 & 2033
- Table 24: Global Sealents Industry in India Revenue million Forecast, by Sealants Resin 2020 & 2033
- Table 25: Global Sealents Industry in India Revenue million Forecast, by End-user Industry 2020 & 2033
- Table 26: Global Sealents Industry in India Revenue million Forecast, by Country 2020 & 2033
- Table 27: United Kingdom Sealents Industry in India Revenue (million) Forecast, by Application 2020 & 2033
- Table 28: Germany Sealents Industry in India Revenue (million) Forecast, by Application 2020 & 2033
- Table 29: France Sealents Industry in India Revenue (million) Forecast, by Application 2020 & 2033
- Table 30: Italy Sealents Industry in India Revenue (million) Forecast, by Application 2020 & 2033
- Table 31: Spain Sealents Industry in India Revenue (million) Forecast, by Application 2020 & 2033
- Table 32: Russia Sealents Industry in India Revenue (million) Forecast, by Application 2020 & 2033
- Table 33: Benelux Sealents Industry in India Revenue (million) Forecast, by Application 2020 & 2033
- Table 34: Nordics Sealents Industry in India Revenue (million) Forecast, by Application 2020 & 2033
- Table 35: Rest of Europe Sealents Industry in India Revenue (million) Forecast, by Application 2020 & 2033
- Table 36: Global Sealents Industry in India Revenue million Forecast, by Adhesives Resin 2020 & 2033
- Table 37: Global Sealents Industry in India Revenue million Forecast, by Adhesives Technology 2020 & 2033
- Table 38: Global Sealents Industry in India Revenue million Forecast, by Sealants Resin 2020 & 2033
- Table 39: Global Sealents Industry in India Revenue million Forecast, by End-user Industry 2020 & 2033
- Table 40: Global Sealents Industry in India Revenue million Forecast, by Country 2020 & 2033
- Table 41: Turkey Sealents Industry in India Revenue (million) Forecast, by Application 2020 & 2033
- Table 42: Israel Sealents Industry in India Revenue (million) Forecast, by Application 2020 & 2033
- Table 43: GCC Sealents Industry in India Revenue (million) Forecast, by Application 2020 & 2033
- Table 44: North Africa Sealents Industry in India Revenue (million) Forecast, by Application 2020 & 2033
- Table 45: South Africa Sealents Industry in India Revenue (million) Forecast, by Application 2020 & 2033
- Table 46: Rest of Middle East & Africa Sealents Industry in India Revenue (million) Forecast, by Application 2020 & 2033
- Table 47: Global Sealents Industry in India Revenue million Forecast, by Adhesives Resin 2020 & 2033
- Table 48: Global Sealents Industry in India Revenue million Forecast, by Adhesives Technology 2020 & 2033
- Table 49: Global Sealents Industry in India Revenue million Forecast, by Sealants Resin 2020 & 2033
- Table 50: Global Sealents Industry in India Revenue million Forecast, by End-user Industry 2020 & 2033
- Table 51: Global Sealents Industry in India Revenue million Forecast, by Country 2020 & 2033
- Table 52: China Sealents Industry in India Revenue (million) Forecast, by Application 2020 & 2033
- Table 53: India Sealents Industry in India Revenue (million) Forecast, by Application 2020 & 2033
- Table 54: Japan Sealents Industry in India Revenue (million) Forecast, by Application 2020 & 2033
- Table 55: South Korea Sealents Industry in India Revenue (million) Forecast, by Application 2020 & 2033
- Table 56: ASEAN Sealents Industry in India Revenue (million) Forecast, by Application 2020 & 2033
- Table 57: Oceania Sealents Industry in India Revenue (million) Forecast, by Application 2020 & 2033
- Table 58: Rest of Asia Pacific Sealents Industry in India Revenue (million) Forecast, by Application 2020 & 2033
Frequently Asked Questions
1. What is the projected Compound Annual Growth Rate (CAGR) of the Sealents Industry in India?
The projected CAGR is approximately 7.42%.
2. Which companies are prominent players in the Sealents Industry in India?
Key companies in the market include Henkel Adhesives Technologies India Private Limited, Pidilite Industries Ltd, 3M, Ashland, LORD Corporation (Parker Hannifin Corp ), Arkema Group, Jubilant Industries Ltd, Huntsman International LLC, Dow, H B Fuller Company, ASTRAL ADHESIVES, Sika AG*List Not Exhaustive, MAPEI SpA, Atul Ltd, AVERY DENNISON CORPORATION.
3. What are the main segments of the Sealents Industry in India?
The market segments include Adhesives Resin, Adhesives Technology, Sealants Resin, End-user Industry.
4. Can you provide details about the market size?
The market size is estimated to be USD 339.78 million as of 2022.
5. What are some drivers contributing to market growth?
Rising Demand from the Residential Construction Industry; Growing Usage in the Packaging Industry.
6. What are the notable trends driving market growth?
Rise in Demand for Aerospace Industry.
7. Are there any restraints impacting market growth?
Stringent Environmental Regulations Regarding VOC Emissions; Other Restraints.
8. Can you provide examples of recent developments in the market?
In Nov 2020, Pidilite Industries acquired Huntsman Group's Indian subsidiary for Rupee 2,100 crore. This increased the product portfolio of the company in the adhesives and sealants market.
9. What pricing options are available for accessing the report?
Pricing options include single-user, multi-user, and enterprise licenses priced at USD 3800, USD 4500, and USD 5800 respectively.
10. Is the market size provided in terms of value or volume?
The market size is provided in terms of value, measured in million.
11. Are there any specific market keywords associated with the report?
Yes, the market keyword associated with the report is "Sealents Industry in India," which aids in identifying and referencing the specific market segment covered.
12. How do I determine which pricing option suits my needs best?
The pricing options vary based on user requirements and access needs. Individual users may opt for single-user licenses, while businesses requiring broader access may choose multi-user or enterprise licenses for cost-effective access to the report.
13. Are there any additional resources or data provided in the Sealents Industry in India report?
While the report offers comprehensive insights, it's advisable to review the specific contents or supplementary materials provided to ascertain if additional resources or data are available.
14. How can I stay updated on further developments or reports in the Sealents Industry in India?
To stay informed about further developments, trends, and reports in the Sealents Industry in India, consider subscribing to industry newsletters, following relevant companies and organizations, or regularly checking reputable industry news sources and publications.
Methodology
Step 1 - Identification of Relevant Samples Size from Population Database


Step 2 - Approaches for Defining Global Market Size (Value, Volume* & Price*)

Note*: In applicable scenarios
Step 3 - Data Sources
Primary Research
- Web Analytics
- Survey Reports
- Research Institute
- Latest Research Reports
- Opinion Leaders
Secondary Research
- Annual Reports
- White Paper
- Latest Press Release
- Industry Association
- Paid Database
- Investor Presentations

Step 4 - Data Triangulation
Involves using different sources of information in order to increase the validity of a study
These sources are likely to be stakeholders in a program - participants, other researchers, program staff, other community members, and so on.
Then we put all data in single framework & apply various statistical tools to find out the dynamic on the market.
During the analysis stage, feedback from the stakeholder groups would be compared to determine areas of agreement as well as areas of divergence