Key Insights
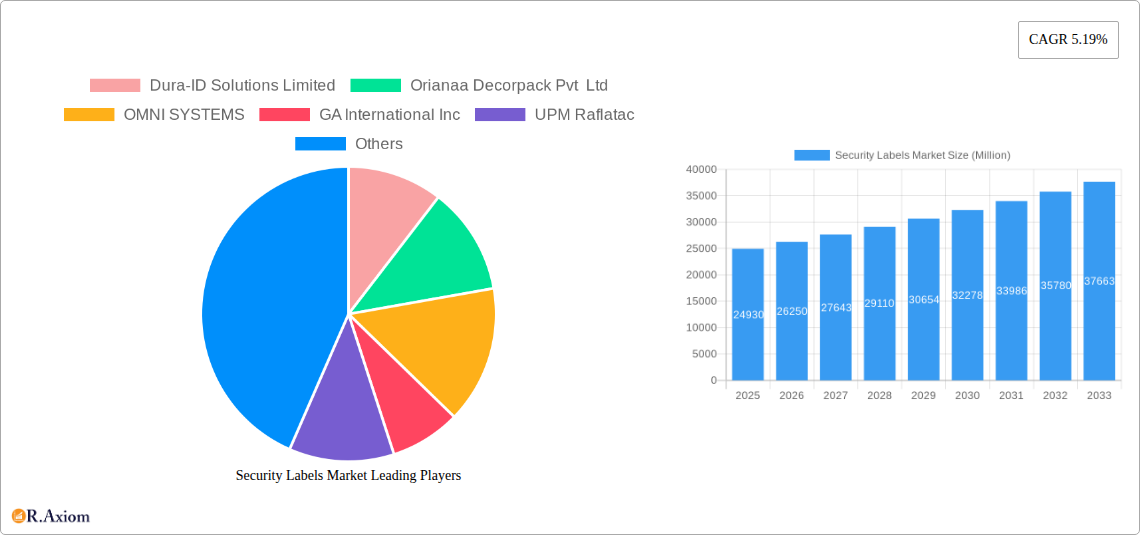
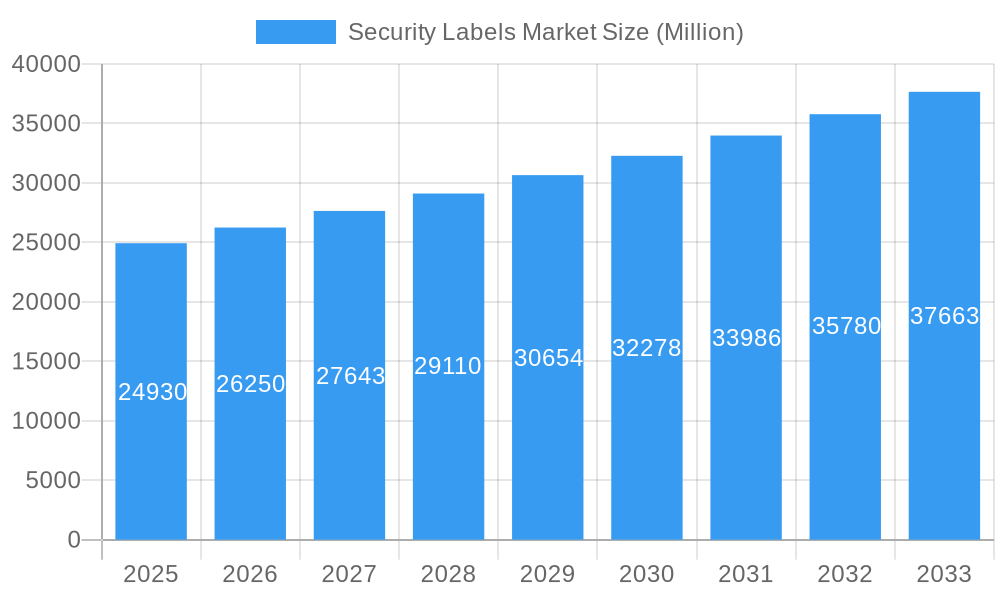
The global security labels market, valued at $24.93 billion in 2025, is projected to experience robust growth, driven by increasing demand for product authentication and brand protection across diverse sectors. The market's Compound Annual Growth Rate (CAGR) of 5.19% from 2019 to 2024 suggests a continued upward trajectory through 2033. Key drivers include rising counterfeiting concerns, stringent government regulations mandating product traceability, and the expanding adoption of sophisticated security features such as tamper-evident labels and RFID tags. Growth is further fueled by the burgeoning e-commerce sector, which necessitates enhanced security measures to combat fraud and ensure consumer trust. The market segmentation reveals a significant share held by pressure-sensitive labelling mechanisms and the electronics and food & beverage industries. Digital printing technology is gaining traction due to its cost-effectiveness and ability to personalize security labels. However, the market faces challenges from fluctuating raw material prices and the need for continuous innovation to counter evolving counterfeiting techniques. Geographical distribution shows strong performance in North America and Europe, with Asia-Pacific exhibiting high growth potential due to its expanding manufacturing and consumer base. Companies like 3M, Avery Dennison, and CCL Industries are major players, leveraging their expertise in material science and printing technologies to offer comprehensive security labelling solutions.
Security Labels Market Market Size (In Billion)
The forecast period (2025-2033) anticipates continued growth, propelled by advancements in label technologies, increasing integration of digital solutions for supply chain management, and rising consumer awareness of counterfeit products. The adoption of tamper-evident labels in pharmaceuticals and healthcare is particularly expected to drive substantial growth within specific segments. Companies are investing in research and development to develop more sophisticated and cost-effective security features, including those incorporating blockchain technology for improved traceability and authenticity verification. The competitive landscape is expected to remain dynamic with ongoing mergers and acquisitions, partnerships, and the introduction of innovative product offerings. Regional variations in market growth will depend on factors such as economic growth, regulatory environments, and the prevalence of counterfeiting in each region.
Security Labels Market Company Market Share
Security Labels Market: A Comprehensive Report (2019-2033)
This in-depth report provides a comprehensive analysis of the Security Labels Market, offering invaluable insights for industry stakeholders, investors, and strategic decision-makers. Covering the period from 2019 to 2033, with a focus on 2025, this report meticulously examines market dynamics, growth drivers, challenges, and future opportunities. The report leverages extensive market research and data analysis to deliver actionable intelligence, enabling informed strategic planning and investment decisions. The market size is projected to reach xx Million by 2033, showcasing significant growth potential.
Security Labels Market Concentration & Innovation
The Security Labels Market exhibits a moderately concentrated landscape, with key players like 3M Company, Avery Dennison Corporation, and CCL Industries Inc. holding significant market share. However, the market also features numerous smaller players and niche specialists, fostering innovation and competition. Market concentration is further analyzed through metrics like the Herfindahl-Hirschman Index (HHI) and market share distribution among top players. The value of M&A deals in the sector has seen considerable growth in recent years, exceeding xx Million in 2024 alone, reflecting the ongoing consolidation and expansion strategies of major players.
- Innovation Drivers: Technological advancements in printing technologies (digital and analog), material science (development of high-performance, eco-friendly materials), and smart label technologies (RFID, NFC) are key drivers of innovation.
- Regulatory Frameworks: Government regulations regarding product labeling, especially in sensitive sectors like healthcare and pharmaceuticals, significantly impact market dynamics. Compliance requirements drive demand for advanced security features.
- Product Substitutes: While security labels are often irreplaceable for certain applications, alternative technologies like digital watermarking and blockchain-based solutions pose potential challenges in niche segments.
- End-User Trends: Increasing demand for tamper-evident packaging, brand protection, and supply chain visibility across diverse sectors like electronics, healthcare, and food & beverage fuels market growth.
- M&A Activities: Recent acquisitions, including ProMach's acquisition of Etiflex and CCL Industries' acquisitions of eAgile Inc. and Alert Systems ApS, reflect the strategic focus on expanding product portfolios and technological capabilities.
Security Labels Market Industry Trends & Insights
The Security Labels Market is experiencing robust growth, driven by a confluence of factors including the rising prevalence of counterfeiting, growing demand for product authentication, and the increasing adoption of smart label technologies. The market is projected to exhibit a CAGR of xx% during the forecast period (2025-2033). Increased consumer awareness of counterfeit products and a growing preference for authentic and traceable goods fuel market growth. The market penetration of RFID and other intelligent label technologies is also on the rise, particularly within the healthcare and pharmaceutical sectors. Technological advancements, coupled with stringent regulatory requirements, are further driving market growth. Competitive dynamics are intense, with major players focusing on innovation, strategic partnerships, and mergers and acquisitions to maintain and enhance market share.
Dominant Markets & Segments in Security Labels Market
The global Security Labels Market is geographically diverse, with significant presence in North America, Europe, and Asia-Pacific. However, the Asia-Pacific region is expected to witness the most significant growth owing to rapid industrialization and a burgeoning consumer market. Within segments, Pressure Sensitive Labelling holds the largest market share by mechanism, driven by its ease of application and cost-effectiveness. Plastic/Polymer Labels dominate the raw material segment due to their versatility, durability, and cost-effectiveness. The Warning/Security Labels segment leads in product type, fueled by heightened security concerns and regulatory compliance needs.
- Key Drivers (Asia-Pacific):
- Rapid economic growth and industrialization
- Expanding e-commerce and logistics sectors
- Stringent regulations for product authenticity and traceability
- Dominance Analysis: The dominance of specific segments and regions is attributed to factors like economic growth, stringent regulations, consumer preferences, and technological advancements. Pressure sensitive labelling's dominance is linked to its ease of application, while plastic/polymer labels' dominance is linked to their cost-effectiveness and versatility. The Warning/Security label segment's dominance is primarily due to the increase in product counterfeiting and regulations.
Security Labels Market Product Developments
Recent product developments focus on integrating advanced technologies like RFID, NFC, and digital printing to enhance security features, track and trace products, and improve supply chain visibility. These innovations cater to the increasing demand for tamper-evident packaging and product authentication, particularly within sensitive sectors such as pharmaceuticals and healthcare. Competitive advantages are built through proprietary technologies, specialized materials, and efficient manufacturing processes. The integration of smart label technologies with existing packaging solutions is a significant trend.
Report Scope & Segmentation Analysis
This report segments the Security Labels Market across several key parameters:
By Raw Material: Metal Labels (growth projection: xx%, market size: xx Million in 2025), Plastic/Polymer Labels (growth projection: xx%, market size: xx Million in 2025). Plastic/Polymer Labels are expected to witness faster growth due to their cost-effectiveness and versatility. Competitive dynamics are intense, particularly within the Plastic/Polymer segment, with major players constantly innovating to provide superior products.
By Mechanism: Pressure Sensitive Labelling (growth projection: xx%, market size: xx Million in 2025), Shrink Sleeve Labelling (growth projection: xx%, market size: xx Million in 2025), Other Mechanism (growth projection: xx%, market size: xx Million in 2025). Pressure-sensitive labelling dominates due to its ease of application.
By Product Type: Warning/Security Labels (growth projection: xx%, market size: xx Million in 2025), Branding Labels (growth projection: xx%, market size: xx Million in 2025), Weatherproof Labels (growth projection: xx%, market size: xx Million in 2025), Equipment Asset Tags (growth projection: xx%, market size: xx Million in 2025), Other Product Types (growth projection: xx%, market size: xx Million in 2025). Warning/Security labels dominate due to heightened security concerns.
By Printing Technology: Analog Printing (growth projection: xx%, market size: xx Million in 2025), Digital Printing (growth projection: xx%, market size: xx Million in 2025). Digital printing's growth is fueled by its versatility and cost-effectiveness for shorter print runs.
By End-user Industry: Electronics Industry (growth projection: xx%, market size: xx Million in 2025), Food & Beverage (growth projection: xx%, market size: xx Million in 2025), Automotive (growth projection: xx%, market size: xx Million in 2025), Healthcare (growth projection: xx%, market size: xx Million in 2025), Other End-user Industry (growth projection: xx%, market size: xx Million in 2025). The healthcare sector's growth is driven by stringent regulatory requirements.
Key Drivers of Security Labels Market Growth
The Security Labels Market's growth is driven by several factors: the increasing prevalence of product counterfeiting, rising consumer demand for authentic products, stringent government regulations for product traceability, and technological advancements in printing and labeling technologies. The expansion of e-commerce and the need for secure packaging solutions further propel market growth. The rising adoption of smart label technologies, such as RFID and NFC, enhances product traceability and supply chain visibility, contributing significantly to market growth.
Challenges in the Security Labels Market Sector
Challenges facing the Security Labels Market include fluctuating raw material prices, intense competition among established players and new entrants, and the need for continuous innovation to stay ahead of counterfeiting techniques. Regulatory compliance costs can be significant, and supply chain disruptions can affect production and delivery. Maintaining consistent quality and meeting evolving customer demands present ongoing challenges. The high initial investment for advanced technologies can also limit market penetration in certain segments.
Emerging Opportunities in Security Labels Market
Emerging opportunities include the expanding adoption of smart label technologies with advanced security features, such as tamper-evident seals and unique identifiers, increasing demand for sustainable and eco-friendly labeling materials, and growth in emerging markets with rising consumer spending. The development of new applications in sectors like logistics, pharmaceuticals, and high-value goods presents substantial growth potential.
Leading Players in the Security Labels Market Market
- Dura-ID Solutions Limited
- Orianaa Decorpack Pvt Ltd
- OMNI SYSTEMS
- GA International Inc
- UPM Raflatac
- DuPont de Nemours Inc
- Brook + Whittle Ltd
- 3M Company
- CCL Industries Inc
- Avery Dennison Corporation
- Asean Pack
- Computer Imprintable Label Systems Ltd (CISL Ltd)
- LabelTac com
- Brady Corporation
Key Developments in Security Labels Market Industry
- April 2024: ProMach acquired Etiflex, enhancing its labeling capabilities and entering the Mexican market.
- November 2023: All4Labels launched INTEGRITAG, consolidating its security and intelligent label solutions.
- April 2023: CCL Industries acquired eAgile Inc. and Alert Systems ApS, strengthening its intelligent label technology portfolio.
Strategic Outlook for Security Labels Market Market
The Security Labels Market is poised for continued growth, driven by technological innovation, increasing demand for product authenticity and traceability, and expansion into new markets. The integration of smart technologies and sustainable materials presents significant opportunities. Strategic partnerships and acquisitions will remain key strategies for maintaining competitiveness. Companies focusing on innovation, meeting regulatory requirements, and providing customized solutions are expected to thrive in this dynamic market.
Security Labels Market Segmentation
-
1. Raw Material
- 1.1. Metal Labels
- 1.2. Plastic/Polymer Labels
-
2. Mechanism
- 2.1. Pressure Sensitive Labelling
- 2.2. Shrink Sleeve Labelling
- 2.3. Other Mechanism
-
3. Product Type
- 3.1. Warning/Security Labels
- 3.2. Branding Labels
- 3.3. Weatherproof Labels
- 3.4. Equipment Asset Tags
- 3.5. Other Product Types
-
4. Printing Technology
- 4.1. Analog Printing
- 4.2. Digital Printing
-
5. End-user Industry
- 5.1. Electronics Industry
- 5.2. Food & Beverage
- 5.3. Automotive
- 5.4. Healthcare
- 5.5. Other End-user Industry
Security Labels Market Segmentation By Geography
-
1. North America
- 1.1. United States
- 1.2. Canada
-
2. Europe
- 2.1. Germany
- 2.2. United Kingdom
- 2.3. France
- 2.4. Spain
-
3. Asia
- 3.1. China
- 3.2. Japan
- 3.3. India
- 3.4. South Korea
- 4. Australia and New Zealand
-
5. Latin America
- 5.1. Brazil
- 5.2. Mexico
- 5.3. Argentina
-
6. Middle East and Africa
- 6.1. United Arab Emirates
- 6.2. Saudi Arabia
- 6.3. South Africa
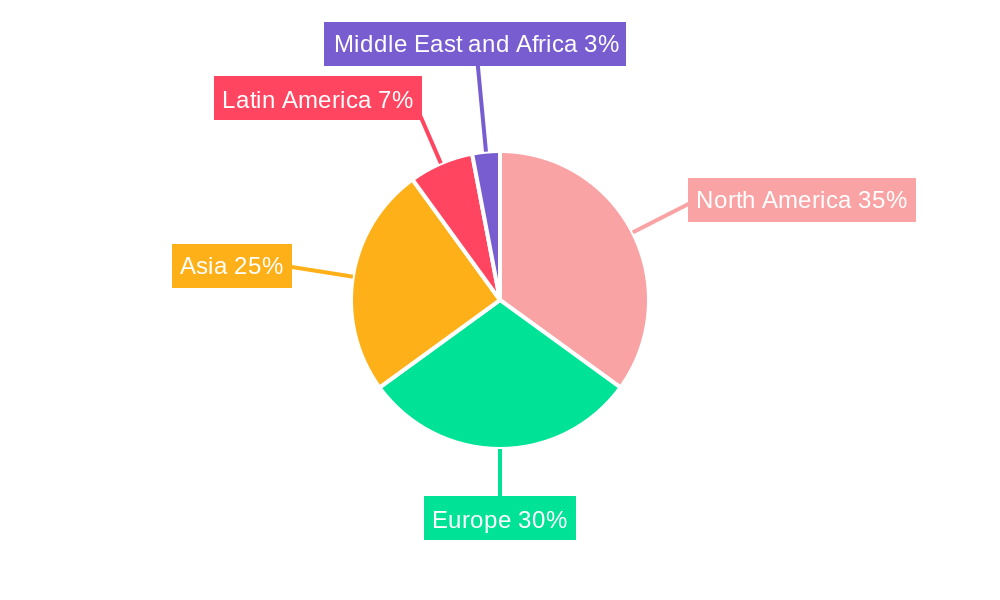
Security Labels Market Regional Market Share
Geographic Coverage of Security Labels Market
Security Labels Market REPORT HIGHLIGHTS
| Aspects | Details |
|---|---|
| Study Period | 2020-2034 |
| Base Year | 2025 |
| Estimated Year | 2026 |
| Forecast Period | 2026-2034 |
| Historical Period | 2020-2025 |
| Growth Rate | CAGR of 5.19% from 2020-2034 |
| Segmentation |
|
Table of Contents
- 1. Introduction
- 1.1. Research Scope
- 1.2. Market Segmentation
- 1.3. Research Objective
- 1.4. Definitions and Assumptions
- 2. Executive Summary
- 2.1. Market Snapshot
- 3. Market Dynamics
- 3.1. Market Drivers
- 3.2. Market Restrains
- 3.3. Market Trends
- 3.4. Market Opportunities
- 4. Market Factor Analysis
- 4.1. Porters Five Forces
- 4.1.1. Bargaining Power of Suppliers
- 4.1.2. Bargaining Power of Buyers
- 4.1.3. Threat of New Entrants
- 4.1.4. Threat of Substitutes
- 4.1.5. Competitive Rivalry
- 4.2. PESTEL analysis
- 4.3. BCG Analysis
- 4.3.1. Stars (High Growth, High Market Share)
- 4.3.2. Cash Cows (Low Growth, High Market Share)
- 4.3.3. Question Mark (High Growth, Low Market Share)
- 4.3.4. Dogs (Low Growth, Low Market Share)
- 4.4. Ansoff Matrix Analysis
- 4.5. Supply Chain Analysis
- 4.6. Regulatory Landscape
- 4.7. Current Market Potential and Opportunity Assessment (TAM–SAM–SOM Framework)
- 4.8. RAX Analyst Note
- 4.1. Porters Five Forces
- 5. Market Analysis, Insights and Forecast 2021-2033
- 5.1. Market Analysis, Insights and Forecast - by Raw Material
- 5.1.1. Metal Labels
- 5.1.2. Plastic/Polymer Labels
- 5.2. Market Analysis, Insights and Forecast - by Mechanism
- 5.2.1. Pressure Sensitive Labelling
- 5.2.2. Shrink Sleeve Labelling
- 5.2.3. Other Mechanism
- 5.3. Market Analysis, Insights and Forecast - by Product Type
- 5.3.1. Warning/Security Labels
- 5.3.2. Branding Labels
- 5.3.3. Weatherproof Labels
- 5.3.4. Equipment Asset Tags
- 5.3.5. Other Product Types
- 5.4. Market Analysis, Insights and Forecast - by Printing Technology
- 5.4.1. Analog Printing
- 5.4.2. Digital Printing
- 5.5. Market Analysis, Insights and Forecast - by End-user Industry
- 5.5.1. Electronics Industry
- 5.5.2. Food & Beverage
- 5.5.3. Automotive
- 5.5.4. Healthcare
- 5.5.5. Other End-user Industry
- 5.6. Market Analysis, Insights and Forecast - by Region
- 5.6.1. North America
- 5.6.2. Europe
- 5.6.3. Asia
- 5.6.4. Australia and New Zealand
- 5.6.5. Latin America
- 5.6.6. Middle East and Africa
- 5.1. Market Analysis, Insights and Forecast - by Raw Material
- 6. Global Security Labels Market Analysis, Insights and Forecast, 2021-2033
- 6.1. Market Analysis, Insights and Forecast - by Raw Material
- 6.1.1. Metal Labels
- 6.1.2. Plastic/Polymer Labels
- 6.2. Market Analysis, Insights and Forecast - by Mechanism
- 6.2.1. Pressure Sensitive Labelling
- 6.2.2. Shrink Sleeve Labelling
- 6.2.3. Other Mechanism
- 6.3. Market Analysis, Insights and Forecast - by Product Type
- 6.3.1. Warning/Security Labels
- 6.3.2. Branding Labels
- 6.3.3. Weatherproof Labels
- 6.3.4. Equipment Asset Tags
- 6.3.5. Other Product Types
- 6.4. Market Analysis, Insights and Forecast - by Printing Technology
- 6.4.1. Analog Printing
- 6.4.2. Digital Printing
- 6.5. Market Analysis, Insights and Forecast - by End-user Industry
- 6.5.1. Electronics Industry
- 6.5.2. Food & Beverage
- 6.5.3. Automotive
- 6.5.4. Healthcare
- 6.5.5. Other End-user Industry
- 6.1. Market Analysis, Insights and Forecast - by Raw Material
- 7. North America Security Labels Market Analysis, Insights and Forecast, 2020-2032
- 7.1. Market Analysis, Insights and Forecast - by Raw Material
- 7.1.1. Metal Labels
- 7.1.2. Plastic/Polymer Labels
- 7.2. Market Analysis, Insights and Forecast - by Mechanism
- 7.2.1. Pressure Sensitive Labelling
- 7.2.2. Shrink Sleeve Labelling
- 7.2.3. Other Mechanism
- 7.3. Market Analysis, Insights and Forecast - by Product Type
- 7.3.1. Warning/Security Labels
- 7.3.2. Branding Labels
- 7.3.3. Weatherproof Labels
- 7.3.4. Equipment Asset Tags
- 7.3.5. Other Product Types
- 7.4. Market Analysis, Insights and Forecast - by Printing Technology
- 7.4.1. Analog Printing
- 7.4.2. Digital Printing
- 7.5. Market Analysis, Insights and Forecast - by End-user Industry
- 7.5.1. Electronics Industry
- 7.5.2. Food & Beverage
- 7.5.3. Automotive
- 7.5.4. Healthcare
- 7.5.5. Other End-user Industry
- 7.1. Market Analysis, Insights and Forecast - by Raw Material
- 8. Europe Security Labels Market Analysis, Insights and Forecast, 2020-2032
- 8.1. Market Analysis, Insights and Forecast - by Raw Material
- 8.1.1. Metal Labels
- 8.1.2. Plastic/Polymer Labels
- 8.2. Market Analysis, Insights and Forecast - by Mechanism
- 8.2.1. Pressure Sensitive Labelling
- 8.2.2. Shrink Sleeve Labelling
- 8.2.3. Other Mechanism
- 8.3. Market Analysis, Insights and Forecast - by Product Type
- 8.3.1. Warning/Security Labels
- 8.3.2. Branding Labels
- 8.3.3. Weatherproof Labels
- 8.3.4. Equipment Asset Tags
- 8.3.5. Other Product Types
- 8.4. Market Analysis, Insights and Forecast - by Printing Technology
- 8.4.1. Analog Printing
- 8.4.2. Digital Printing
- 8.5. Market Analysis, Insights and Forecast - by End-user Industry
- 8.5.1. Electronics Industry
- 8.5.2. Food & Beverage
- 8.5.3. Automotive
- 8.5.4. Healthcare
- 8.5.5. Other End-user Industry
- 8.1. Market Analysis, Insights and Forecast - by Raw Material
- 9. Asia Security Labels Market Analysis, Insights and Forecast, 2020-2032
- 9.1. Market Analysis, Insights and Forecast - by Raw Material
- 9.1.1. Metal Labels
- 9.1.2. Plastic/Polymer Labels
- 9.2. Market Analysis, Insights and Forecast - by Mechanism
- 9.2.1. Pressure Sensitive Labelling
- 9.2.2. Shrink Sleeve Labelling
- 9.2.3. Other Mechanism
- 9.3. Market Analysis, Insights and Forecast - by Product Type
- 9.3.1. Warning/Security Labels
- 9.3.2. Branding Labels
- 9.3.3. Weatherproof Labels
- 9.3.4. Equipment Asset Tags
- 9.3.5. Other Product Types
- 9.4. Market Analysis, Insights and Forecast - by Printing Technology
- 9.4.1. Analog Printing
- 9.4.2. Digital Printing
- 9.5. Market Analysis, Insights and Forecast - by End-user Industry
- 9.5.1. Electronics Industry
- 9.5.2. Food & Beverage
- 9.5.3. Automotive
- 9.5.4. Healthcare
- 9.5.5. Other End-user Industry
- 9.1. Market Analysis, Insights and Forecast - by Raw Material
- 10. Australia and New Zealand Security Labels Market Analysis, Insights and Forecast, 2020-2032
- 10.1. Market Analysis, Insights and Forecast - by Raw Material
- 10.1.1. Metal Labels
- 10.1.2. Plastic/Polymer Labels
- 10.2. Market Analysis, Insights and Forecast - by Mechanism
- 10.2.1. Pressure Sensitive Labelling
- 10.2.2. Shrink Sleeve Labelling
- 10.2.3. Other Mechanism
- 10.3. Market Analysis, Insights and Forecast - by Product Type
- 10.3.1. Warning/Security Labels
- 10.3.2. Branding Labels
- 10.3.3. Weatherproof Labels
- 10.3.4. Equipment Asset Tags
- 10.3.5. Other Product Types
- 10.4. Market Analysis, Insights and Forecast - by Printing Technology
- 10.4.1. Analog Printing
- 10.4.2. Digital Printing
- 10.5. Market Analysis, Insights and Forecast - by End-user Industry
- 10.5.1. Electronics Industry
- 10.5.2. Food & Beverage
- 10.5.3. Automotive
- 10.5.4. Healthcare
- 10.5.5. Other End-user Industry
- 10.1. Market Analysis, Insights and Forecast - by Raw Material
- 11. Latin America Security Labels Market Analysis, Insights and Forecast, 2020-2032
- 11.1. Market Analysis, Insights and Forecast - by Raw Material
- 11.1.1. Metal Labels
- 11.1.2. Plastic/Polymer Labels
- 11.2. Market Analysis, Insights and Forecast - by Mechanism
- 11.2.1. Pressure Sensitive Labelling
- 11.2.2. Shrink Sleeve Labelling
- 11.2.3. Other Mechanism
- 11.3. Market Analysis, Insights and Forecast - by Product Type
- 11.3.1. Warning/Security Labels
- 11.3.2. Branding Labels
- 11.3.3. Weatherproof Labels
- 11.3.4. Equipment Asset Tags
- 11.3.5. Other Product Types
- 11.4. Market Analysis, Insights and Forecast - by Printing Technology
- 11.4.1. Analog Printing
- 11.4.2. Digital Printing
- 11.5. Market Analysis, Insights and Forecast - by End-user Industry
- 11.5.1. Electronics Industry
- 11.5.2. Food & Beverage
- 11.5.3. Automotive
- 11.5.4. Healthcare
- 11.5.5. Other End-user Industry
- 11.1. Market Analysis, Insights and Forecast - by Raw Material
- 12. Middle East and Africa Security Labels Market Analysis, Insights and Forecast, 2020-2032
- 12.1. Market Analysis, Insights and Forecast - by Raw Material
- 12.1.1. Metal Labels
- 12.1.2. Plastic/Polymer Labels
- 12.2. Market Analysis, Insights and Forecast - by Mechanism
- 12.2.1. Pressure Sensitive Labelling
- 12.2.2. Shrink Sleeve Labelling
- 12.2.3. Other Mechanism
- 12.3. Market Analysis, Insights and Forecast - by Product Type
- 12.3.1. Warning/Security Labels
- 12.3.2. Branding Labels
- 12.3.3. Weatherproof Labels
- 12.3.4. Equipment Asset Tags
- 12.3.5. Other Product Types
- 12.4. Market Analysis, Insights and Forecast - by Printing Technology
- 12.4.1. Analog Printing
- 12.4.2. Digital Printing
- 12.5. Market Analysis, Insights and Forecast - by End-user Industry
- 12.5.1. Electronics Industry
- 12.5.2. Food & Beverage
- 12.5.3. Automotive
- 12.5.4. Healthcare
- 12.5.5. Other End-user Industry
- 12.1. Market Analysis, Insights and Forecast - by Raw Material
- 13. Competitive Analysis
- 13.1. Company Profiles
- 13.1.1 Dura-ID Solutions Limited
- 13.1.1.1. Company Overview
- 13.1.1.2. Products
- 13.1.1.3. Company Financials
- 13.1.1.4. SWOT Analysis
- 13.1.2 Orianaa Decorpack Pvt Ltd
- 13.1.2.1. Company Overview
- 13.1.2.2. Products
- 13.1.2.3. Company Financials
- 13.1.2.4. SWOT Analysis
- 13.1.3 OMNI SYSTEMS
- 13.1.3.1. Company Overview
- 13.1.3.2. Products
- 13.1.3.3. Company Financials
- 13.1.3.4. SWOT Analysis
- 13.1.4 GA International Inc
- 13.1.4.1. Company Overview
- 13.1.4.2. Products
- 13.1.4.3. Company Financials
- 13.1.4.4. SWOT Analysis
- 13.1.5 UPM Raflatac
- 13.1.5.1. Company Overview
- 13.1.5.2. Products
- 13.1.5.3. Company Financials
- 13.1.5.4. SWOT Analysis
- 13.1.6 DuPont de Nemours Inc
- 13.1.6.1. Company Overview
- 13.1.6.2. Products
- 13.1.6.3. Company Financials
- 13.1.6.4. SWOT Analysis
- 13.1.7 Brook + Whittle Ltd
- 13.1.7.1. Company Overview
- 13.1.7.2. Products
- 13.1.7.3. Company Financials
- 13.1.7.4. SWOT Analysis
- 13.1.8 3M Company
- 13.1.8.1. Company Overview
- 13.1.8.2. Products
- 13.1.8.3. Company Financials
- 13.1.8.4. SWOT Analysis
- 13.1.9 CCL Industries Inc
- 13.1.9.1. Company Overview
- 13.1.9.2. Products
- 13.1.9.3. Company Financials
- 13.1.9.4. SWOT Analysis
- 13.1.10 Avery Dennison Corporation
- 13.1.10.1. Company Overview
- 13.1.10.2. Products
- 13.1.10.3. Company Financials
- 13.1.10.4. SWOT Analysis
- 13.1.11 Asean Pack
- 13.1.11.1. Company Overview
- 13.1.11.2. Products
- 13.1.11.3. Company Financials
- 13.1.11.4. SWOT Analysis
- 13.1.12 Computer Imprintable Label Systems Ltd (CISL Ltd)
- 13.1.12.1. Company Overview
- 13.1.12.2. Products
- 13.1.12.3. Company Financials
- 13.1.12.4. SWOT Analysis
- 13.1.13 LabelTac com
- 13.1.13.1. Company Overview
- 13.1.13.2. Products
- 13.1.13.3. Company Financials
- 13.1.13.4. SWOT Analysis
- 13.1.14 Brady Corporation
- 13.1.14.1. Company Overview
- 13.1.14.2. Products
- 13.1.14.3. Company Financials
- 13.1.14.4. SWOT Analysis
- 13.1.1 Dura-ID Solutions Limited
- 13.2. Market Entropy
- 13.2.1 Company's Key Areas Served
- 13.2.2 Recent Developments
- 13.3. Company Market Share Analysis 2025
- 13.3.1 Top 5 Companies Market Share Analysis
- 13.3.2 Top 3 Companies Market Share Analysis
- 13.4. List of Potential Customers
- 14. Research Methodology
List of Figures
- Figure 1: Global Security Labels Market Revenue Breakdown (Million, %) by Region 2025 & 2033
- Figure 2: North America Security Labels Market Revenue (Million), by Raw Material 2025 & 2033
- Figure 3: North America Security Labels Market Revenue Share (%), by Raw Material 2025 & 2033
- Figure 4: North America Security Labels Market Revenue (Million), by Mechanism 2025 & 2033
- Figure 5: North America Security Labels Market Revenue Share (%), by Mechanism 2025 & 2033
- Figure 6: North America Security Labels Market Revenue (Million), by Product Type 2025 & 2033
- Figure 7: North America Security Labels Market Revenue Share (%), by Product Type 2025 & 2033
- Figure 8: North America Security Labels Market Revenue (Million), by Printing Technology 2025 & 2033
- Figure 9: North America Security Labels Market Revenue Share (%), by Printing Technology 2025 & 2033
- Figure 10: North America Security Labels Market Revenue (Million), by End-user Industry 2025 & 2033
- Figure 11: North America Security Labels Market Revenue Share (%), by End-user Industry 2025 & 2033
- Figure 12: North America Security Labels Market Revenue (Million), by Country 2025 & 2033
- Figure 13: North America Security Labels Market Revenue Share (%), by Country 2025 & 2033
- Figure 14: Europe Security Labels Market Revenue (Million), by Raw Material 2025 & 2033
- Figure 15: Europe Security Labels Market Revenue Share (%), by Raw Material 2025 & 2033
- Figure 16: Europe Security Labels Market Revenue (Million), by Mechanism 2025 & 2033
- Figure 17: Europe Security Labels Market Revenue Share (%), by Mechanism 2025 & 2033
- Figure 18: Europe Security Labels Market Revenue (Million), by Product Type 2025 & 2033
- Figure 19: Europe Security Labels Market Revenue Share (%), by Product Type 2025 & 2033
- Figure 20: Europe Security Labels Market Revenue (Million), by Printing Technology 2025 & 2033
- Figure 21: Europe Security Labels Market Revenue Share (%), by Printing Technology 2025 & 2033
- Figure 22: Europe Security Labels Market Revenue (Million), by End-user Industry 2025 & 2033
- Figure 23: Europe Security Labels Market Revenue Share (%), by End-user Industry 2025 & 2033
- Figure 24: Europe Security Labels Market Revenue (Million), by Country 2025 & 2033
- Figure 25: Europe Security Labels Market Revenue Share (%), by Country 2025 & 2033
- Figure 26: Asia Security Labels Market Revenue (Million), by Raw Material 2025 & 2033
- Figure 27: Asia Security Labels Market Revenue Share (%), by Raw Material 2025 & 2033
- Figure 28: Asia Security Labels Market Revenue (Million), by Mechanism 2025 & 2033
- Figure 29: Asia Security Labels Market Revenue Share (%), by Mechanism 2025 & 2033
- Figure 30: Asia Security Labels Market Revenue (Million), by Product Type 2025 & 2033
- Figure 31: Asia Security Labels Market Revenue Share (%), by Product Type 2025 & 2033
- Figure 32: Asia Security Labels Market Revenue (Million), by Printing Technology 2025 & 2033
- Figure 33: Asia Security Labels Market Revenue Share (%), by Printing Technology 2025 & 2033
- Figure 34: Asia Security Labels Market Revenue (Million), by End-user Industry 2025 & 2033
- Figure 35: Asia Security Labels Market Revenue Share (%), by End-user Industry 2025 & 2033
- Figure 36: Asia Security Labels Market Revenue (Million), by Country 2025 & 2033
- Figure 37: Asia Security Labels Market Revenue Share (%), by Country 2025 & 2033
- Figure 38: Australia and New Zealand Security Labels Market Revenue (Million), by Raw Material 2025 & 2033
- Figure 39: Australia and New Zealand Security Labels Market Revenue Share (%), by Raw Material 2025 & 2033
- Figure 40: Australia and New Zealand Security Labels Market Revenue (Million), by Mechanism 2025 & 2033
- Figure 41: Australia and New Zealand Security Labels Market Revenue Share (%), by Mechanism 2025 & 2033
- Figure 42: Australia and New Zealand Security Labels Market Revenue (Million), by Product Type 2025 & 2033
- Figure 43: Australia and New Zealand Security Labels Market Revenue Share (%), by Product Type 2025 & 2033
- Figure 44: Australia and New Zealand Security Labels Market Revenue (Million), by Printing Technology 2025 & 2033
- Figure 45: Australia and New Zealand Security Labels Market Revenue Share (%), by Printing Technology 2025 & 2033
- Figure 46: Australia and New Zealand Security Labels Market Revenue (Million), by End-user Industry 2025 & 2033
- Figure 47: Australia and New Zealand Security Labels Market Revenue Share (%), by End-user Industry 2025 & 2033
- Figure 48: Australia and New Zealand Security Labels Market Revenue (Million), by Country 2025 & 2033
- Figure 49: Australia and New Zealand Security Labels Market Revenue Share (%), by Country 2025 & 2033
- Figure 50: Latin America Security Labels Market Revenue (Million), by Raw Material 2025 & 2033
- Figure 51: Latin America Security Labels Market Revenue Share (%), by Raw Material 2025 & 2033
- Figure 52: Latin America Security Labels Market Revenue (Million), by Mechanism 2025 & 2033
- Figure 53: Latin America Security Labels Market Revenue Share (%), by Mechanism 2025 & 2033
- Figure 54: Latin America Security Labels Market Revenue (Million), by Product Type 2025 & 2033
- Figure 55: Latin America Security Labels Market Revenue Share (%), by Product Type 2025 & 2033
- Figure 56: Latin America Security Labels Market Revenue (Million), by Printing Technology 2025 & 2033
- Figure 57: Latin America Security Labels Market Revenue Share (%), by Printing Technology 2025 & 2033
- Figure 58: Latin America Security Labels Market Revenue (Million), by End-user Industry 2025 & 2033
- Figure 59: Latin America Security Labels Market Revenue Share (%), by End-user Industry 2025 & 2033
- Figure 60: Latin America Security Labels Market Revenue (Million), by Country 2025 & 2033
- Figure 61: Latin America Security Labels Market Revenue Share (%), by Country 2025 & 2033
- Figure 62: Middle East and Africa Security Labels Market Revenue (Million), by Raw Material 2025 & 2033
- Figure 63: Middle East and Africa Security Labels Market Revenue Share (%), by Raw Material 2025 & 2033
- Figure 64: Middle East and Africa Security Labels Market Revenue (Million), by Mechanism 2025 & 2033
- Figure 65: Middle East and Africa Security Labels Market Revenue Share (%), by Mechanism 2025 & 2033
- Figure 66: Middle East and Africa Security Labels Market Revenue (Million), by Product Type 2025 & 2033
- Figure 67: Middle East and Africa Security Labels Market Revenue Share (%), by Product Type 2025 & 2033
- Figure 68: Middle East and Africa Security Labels Market Revenue (Million), by Printing Technology 2025 & 2033
- Figure 69: Middle East and Africa Security Labels Market Revenue Share (%), by Printing Technology 2025 & 2033
- Figure 70: Middle East and Africa Security Labels Market Revenue (Million), by End-user Industry 2025 & 2033
- Figure 71: Middle East and Africa Security Labels Market Revenue Share (%), by End-user Industry 2025 & 2033
- Figure 72: Middle East and Africa Security Labels Market Revenue (Million), by Country 2025 & 2033
- Figure 73: Middle East and Africa Security Labels Market Revenue Share (%), by Country 2025 & 2033
List of Tables
- Table 1: Global Security Labels Market Revenue Million Forecast, by Raw Material 2020 & 2033
- Table 2: Global Security Labels Market Revenue Million Forecast, by Mechanism 2020 & 2033
- Table 3: Global Security Labels Market Revenue Million Forecast, by Product Type 2020 & 2033
- Table 4: Global Security Labels Market Revenue Million Forecast, by Printing Technology 2020 & 2033
- Table 5: Global Security Labels Market Revenue Million Forecast, by End-user Industry 2020 & 2033
- Table 6: Global Security Labels Market Revenue Million Forecast, by Region 2020 & 2033
- Table 7: Global Security Labels Market Revenue Million Forecast, by Raw Material 2020 & 2033
- Table 8: Global Security Labels Market Revenue Million Forecast, by Mechanism 2020 & 2033
- Table 9: Global Security Labels Market Revenue Million Forecast, by Product Type 2020 & 2033
- Table 10: Global Security Labels Market Revenue Million Forecast, by Printing Technology 2020 & 2033
- Table 11: Global Security Labels Market Revenue Million Forecast, by End-user Industry 2020 & 2033
- Table 12: Global Security Labels Market Revenue Million Forecast, by Country 2020 & 2033
- Table 13: United States Security Labels Market Revenue (Million) Forecast, by Application 2020 & 2033
- Table 14: Canada Security Labels Market Revenue (Million) Forecast, by Application 2020 & 2033
- Table 15: Global Security Labels Market Revenue Million Forecast, by Raw Material 2020 & 2033
- Table 16: Global Security Labels Market Revenue Million Forecast, by Mechanism 2020 & 2033
- Table 17: Global Security Labels Market Revenue Million Forecast, by Product Type 2020 & 2033
- Table 18: Global Security Labels Market Revenue Million Forecast, by Printing Technology 2020 & 2033
- Table 19: Global Security Labels Market Revenue Million Forecast, by End-user Industry 2020 & 2033
- Table 20: Global Security Labels Market Revenue Million Forecast, by Country 2020 & 2033
- Table 21: Germany Security Labels Market Revenue (Million) Forecast, by Application 2020 & 2033
- Table 22: United Kingdom Security Labels Market Revenue (Million) Forecast, by Application 2020 & 2033
- Table 23: France Security Labels Market Revenue (Million) Forecast, by Application 2020 & 2033
- Table 24: Spain Security Labels Market Revenue (Million) Forecast, by Application 2020 & 2033
- Table 25: Global Security Labels Market Revenue Million Forecast, by Raw Material 2020 & 2033
- Table 26: Global Security Labels Market Revenue Million Forecast, by Mechanism 2020 & 2033
- Table 27: Global Security Labels Market Revenue Million Forecast, by Product Type 2020 & 2033
- Table 28: Global Security Labels Market Revenue Million Forecast, by Printing Technology 2020 & 2033
- Table 29: Global Security Labels Market Revenue Million Forecast, by End-user Industry 2020 & 2033
- Table 30: Global Security Labels Market Revenue Million Forecast, by Country 2020 & 2033
- Table 31: China Security Labels Market Revenue (Million) Forecast, by Application 2020 & 2033
- Table 32: Japan Security Labels Market Revenue (Million) Forecast, by Application 2020 & 2033
- Table 33: India Security Labels Market Revenue (Million) Forecast, by Application 2020 & 2033
- Table 34: South Korea Security Labels Market Revenue (Million) Forecast, by Application 2020 & 2033
- Table 35: Global Security Labels Market Revenue Million Forecast, by Raw Material 2020 & 2033
- Table 36: Global Security Labels Market Revenue Million Forecast, by Mechanism 2020 & 2033
- Table 37: Global Security Labels Market Revenue Million Forecast, by Product Type 2020 & 2033
- Table 38: Global Security Labels Market Revenue Million Forecast, by Printing Technology 2020 & 2033
- Table 39: Global Security Labels Market Revenue Million Forecast, by End-user Industry 2020 & 2033
- Table 40: Global Security Labels Market Revenue Million Forecast, by Country 2020 & 2033
- Table 41: Global Security Labels Market Revenue Million Forecast, by Raw Material 2020 & 2033
- Table 42: Global Security Labels Market Revenue Million Forecast, by Mechanism 2020 & 2033
- Table 43: Global Security Labels Market Revenue Million Forecast, by Product Type 2020 & 2033
- Table 44: Global Security Labels Market Revenue Million Forecast, by Printing Technology 2020 & 2033
- Table 45: Global Security Labels Market Revenue Million Forecast, by End-user Industry 2020 & 2033
- Table 46: Global Security Labels Market Revenue Million Forecast, by Country 2020 & 2033
- Table 47: Brazil Security Labels Market Revenue (Million) Forecast, by Application 2020 & 2033
- Table 48: Mexico Security Labels Market Revenue (Million) Forecast, by Application 2020 & 2033
- Table 49: Argentina Security Labels Market Revenue (Million) Forecast, by Application 2020 & 2033
- Table 50: Global Security Labels Market Revenue Million Forecast, by Raw Material 2020 & 2033
- Table 51: Global Security Labels Market Revenue Million Forecast, by Mechanism 2020 & 2033
- Table 52: Global Security Labels Market Revenue Million Forecast, by Product Type 2020 & 2033
- Table 53: Global Security Labels Market Revenue Million Forecast, by Printing Technology 2020 & 2033
- Table 54: Global Security Labels Market Revenue Million Forecast, by End-user Industry 2020 & 2033
- Table 55: Global Security Labels Market Revenue Million Forecast, by Country 2020 & 2033
- Table 56: United Arab Emirates Security Labels Market Revenue (Million) Forecast, by Application 2020 & 2033
- Table 57: Saudi Arabia Security Labels Market Revenue (Million) Forecast, by Application 2020 & 2033
- Table 58: South Africa Security Labels Market Revenue (Million) Forecast, by Application 2020 & 2033
Frequently Asked Questions
1. What is the projected Compound Annual Growth Rate (CAGR) of the Security Labels Market?
The projected CAGR is approximately 5.19%.
2. Which companies are prominent players in the Security Labels Market?
Key companies in the market include Dura-ID Solutions Limited, Orianaa Decorpack Pvt Ltd, OMNI SYSTEMS, GA International Inc, UPM Raflatac, DuPont de Nemours Inc, Brook + Whittle Ltd, 3M Company, CCL Industries Inc, Avery Dennison Corporation, Asean Pack, Computer Imprintable Label Systems Ltd (CISL Ltd), LabelTac com, Brady Corporation.
3. What are the main segments of the Security Labels Market?
The market segments include Raw Material, Mechanism, Product Type, Printing Technology, End-user Industry.
4. Can you provide details about the market size?
The market size is estimated to be USD 24.93 Million as of 2022.
5. What are some drivers contributing to market growth?
Food and Beverage is Expected to Register Significant Growth; APAC to Witness Significant Growth.
6. What are the notable trends driving market growth?
Warning/Security Labels is Expected to Register a Significant Growth.
7. Are there any restraints impacting market growth?
Increasing Cost of Raw Materials.
8. Can you provide examples of recent developments in the market?
April 2024: ProMach, a prominent global player in the manufacturing and distribution of processing and packaging equipment, announced the acquisition of Etiflex, a well-known producer of pressure-sensitive and RFID labels. This acquisition enhances ProMach's labeling and coding expertise across North America and marks the company's initial foray into the Mexican market.
9. What pricing options are available for accessing the report?
Pricing options include single-user, multi-user, and enterprise licenses priced at USD 4750, USD 5250, and USD 8750 respectively.
10. Is the market size provided in terms of value or volume?
The market size is provided in terms of value, measured in Million.
11. Are there any specific market keywords associated with the report?
Yes, the market keyword associated with the report is "Security Labels Market," which aids in identifying and referencing the specific market segment covered.
12. How do I determine which pricing option suits my needs best?
The pricing options vary based on user requirements and access needs. Individual users may opt for single-user licenses, while businesses requiring broader access may choose multi-user or enterprise licenses for cost-effective access to the report.
13. Are there any additional resources or data provided in the Security Labels Market report?
While the report offers comprehensive insights, it's advisable to review the specific contents or supplementary materials provided to ascertain if additional resources or data are available.
14. How can I stay updated on further developments or reports in the Security Labels Market?
To stay informed about further developments, trends, and reports in the Security Labels Market, consider subscribing to industry newsletters, following relevant companies and organizations, or regularly checking reputable industry news sources and publications.
Methodology
Step 1 - Identification of Relevant Samples Size from Population Database


Step 2 - Approaches for Defining Global Market Size (Value, Volume* & Price*)

Note*: In applicable scenarios
Step 3 - Data Sources
Primary Research
- Web Analytics
- Survey Reports
- Research Institute
- Latest Research Reports
- Opinion Leaders
Secondary Research
- Annual Reports
- White Paper
- Latest Press Release
- Industry Association
- Paid Database
- Investor Presentations

Step 4 - Data Triangulation
Involves using different sources of information in order to increase the validity of a study
These sources are likely to be stakeholders in a program - participants, other researchers, program staff, other community members, and so on.
Then we put all data in single framework & apply various statistical tools to find out the dynamic on the market.
During the analysis stage, feedback from the stakeholder groups would be compared to determine areas of agreement as well as areas of divergence

