Key Insights
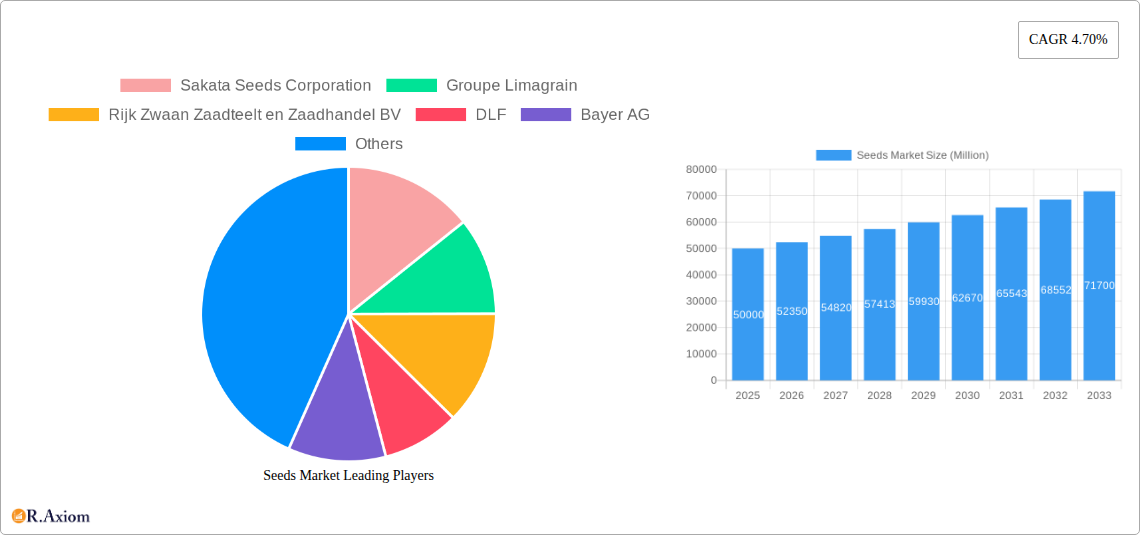
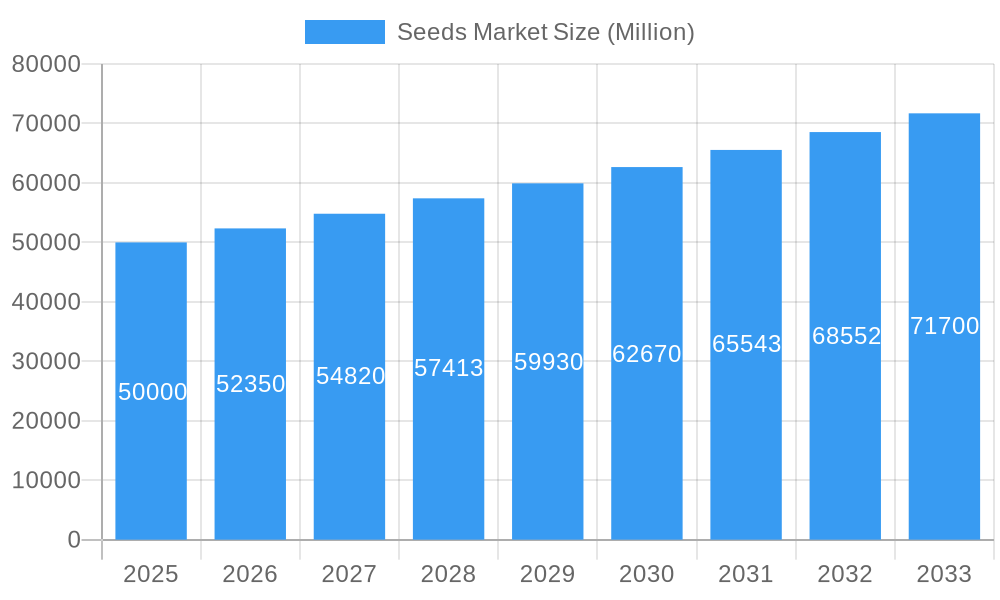
The global seeds market, valued at approximately $XX million in 2025, is projected to experience robust growth, exhibiting a compound annual growth rate (CAGR) of 4.70% from 2025 to 2033. This expansion is driven by several key factors. Increasing global population necessitates higher agricultural output, fueling demand for high-yielding and disease-resistant seed varieties. Simultaneously, the burgeoning adoption of advanced breeding technologies, such as hybrids, is enhancing crop productivity and profitability for farmers. Furthermore, the shift towards protected cultivation methods, offering better crop control and increased yields, is contributing significantly to market growth. Regional variations exist, with North America and Europe currently holding substantial market shares due to established agricultural practices and technological advancements. However, rapidly developing economies in Asia-Pacific, particularly India and China, present significant growth opportunities driven by increasing agricultural investments and government initiatives promoting improved farming techniques. The market segmentation reveals a strong preference for hybrid breeding technologies and row crops, reflecting the focus on efficiency and optimized yields. However, challenges such as fluctuating commodity prices, climate change impacting crop yields, and stringent regulatory approvals for new seed varieties pose potential restraints to market growth.
Seeds Market Market Size (In Billion)
The competitive landscape is marked by the presence of both established multinational corporations and regional players. Companies like Sakata Seeds Corporation, Bayer AG, Syngenta Group, and Corteva Agriscience are leading the market through continuous innovation, strategic acquisitions, and extensive distribution networks. The future of the seeds market hinges on the continuous development of climate-resilient seeds, precision agriculture technologies, and sustainable farming practices. The integration of biotechnology and data analytics is expected to further enhance seed performance and contribute to overall market expansion. This signifies an exciting period of transformation for the agricultural sector, with seeds playing a pivotal role in ensuring global food security and sustainable agricultural practices.
Seeds Market Company Market Share
This comprehensive report provides a detailed analysis of the global Seeds Market, covering the period 2019-2033. With a focus on market concentration, innovation, industry trends, and key players, this report offers actionable insights for stakeholders across the seeds industry. The report utilizes a base year of 2025 and forecasts market trends until 2033, incorporating historical data from 2019-2024. The total market size is estimated to be xx Million in 2025.
Seeds Market Market Concentration & Innovation
The global seeds market is characterized by a dynamic and evolving landscape, with a significant presence of major multinational corporations. While specific market share percentages can fluctuate, industry leaders such as Bayer AG, Syngenta Group, Corteva Agriscience, and BASF SE consistently hold substantial influence. These key players, alongside a vibrant ecosystem of smaller and regional enterprises, contribute to the market's overall growth. The sector is propelled by relentless innovation, with substantial investments in research and development (R&D) focused on creating advanced seed varieties. These innovations aim to enhance critical traits like inherent disease resistance, optimize yield potential, and improve tolerance to various environmental stressors, addressing the growing challenges in global agriculture.
- Mergers & Acquisitions (M&A): The seeds market has been a hotbed of strategic consolidation. Significant M&A activities over the past several years have reshaped the competitive landscape, with combined deal values indicating a strong trend towards portfolio expansion, geographical market penetration, and the acquisition of cutting-edge technologies.
- Regulatory Frameworks: A complex web of regulatory frameworks, particularly concerning genetically modified organisms (GMOs), intellectual property rights for seed varieties, and stringent biosafety protocols, profoundly influences market operations. Navigating these diverse and often evolving regulations across different countries presents both strategic hurdles and unique market opportunities for seed companies.
- Product Substitutes: While direct substitutes are limited, practices such as extensive organic farming and traditional seed saving by local communities represent alternative approaches to crop cultivation that can influence market dynamics and demand for commercial seed products.
- End-User Trends: A confluence of factors, including heightened global awareness of food security imperatives, the tangible impacts of climate change on agricultural productivity, and a discernible shift in consumer preferences towards sustainably produced food items, are actively shaping seed selection processes and driving market demand towards more resilient and environmentally conscious options.
Seeds Market Industry Trends & Insights
The global seeds market demonstrates consistent growth, driven by several factors. The Compound Annual Growth Rate (CAGR) is projected at xx% during the forecast period (2025-2033). This growth is attributed to factors like rising global population, increasing demand for food, the expansion of agricultural land, and technological advancements in seed breeding and genetic modification. Market penetration of hybrid seeds continues to rise, especially in developing countries where improved yields are crucial. However, challenges persist, including climate change, pest infestations, and fluctuating commodity prices. The adoption of precision agriculture technologies and data-driven farming practices is transforming the industry, impacting seed selection and application. Increased awareness of sustainable agriculture practices is shifting consumer preferences towards seeds that require less water and fertilizer. Competitive dynamics are intense, with companies focusing on product differentiation, market expansion, and strategic partnerships.
Dominant Markets & Segments in Seeds Market
The seeds market shows varied growth across different regions and segments. While precise figures are proprietary, data suggests:
Leading Region: North America and Asia-Pacific represent significant markets due to large agricultural sectors and high seed demand.
Dominant Segment: Hybrid seeds in the Breeding Technology segment is the fastest-growing segment, driven by higher yields and improved performance.
Key Drivers:
- Open Field Cultivation: This remains the dominant cultivation method globally, particularly for row crops. Cost-effectiveness and scalability are key factors.
- Protected Cultivation: This segment experiences moderate growth, driven by its ability to control environmental factors, thereby increasing yields and quality.
- Row Crops: These represent the largest segment by crop type, with significant demand for corn, soybeans, wheat, and rice seeds.
- Pulses (Vegetables): Growth is fuelled by rising consumer demand for healthy, protein-rich diets.
Seeds Market Product Developments
Recent years have seen significant advancements in seed technology, including improved hybrid varieties, genetically modified (GM) seeds, and the development of seeds with enhanced stress tolerance. Companies are focusing on developing seeds with improved nutritional value and disease resistance to cater to growing consumer preferences and address climate change challenges. This focus on tailored solutions reflects the market’s drive for more efficient and sustainable farming practices. The integration of digital technologies in seed production and distribution is also accelerating.
Report Scope & Segmentation Analysis
This comprehensive report meticulously segments the seeds market to provide deep insights into its various facets:
- Breeding Technology: The market is analyzed through the lens of breeding technologies, primarily distinguishing between Hybrids and Open-pollinated varieties. The demand for hybrids is fueled by their proven high yields and predictable performance characteristics, while open-pollinated varieties continue to cater to a specialized niche, particularly within the organic farming sector.
- Pulses: This segment encompasses a range of crops, including both Vegetables and Grains. The sub-segment of vegetable pulses is exhibiting particularly robust growth, largely attributed to increasing consumer interest in nutritious and health-conscious food choices.
- Cultivation Mechanism: The analysis differentiates between Open Field cultivation and Protected Cultivation. While Open Field remains the dominant method globally, Protected Cultivation is gaining traction, offering greater control over environmental variables and thereby enhancing crop yield and quality.
- Crop Type: The market is broadly categorized into Row Crops (such as corn, soybeans, and wheat) and Other Unclassified Vegetables. Row crops constitute the largest and most significant segment within the overall seeds market.
Key Drivers of Seeds Market Growth
Several key factors drive seeds market growth:
- Rising Global Population: Increasing demand for food necessitates higher agricultural output, driving seed demand.
- Technological Advancements: Innovations in seed breeding and genetic modification deliver higher yields and improved crop quality.
- Favorable Government Policies: Subsidies and supportive regulations promote agricultural growth, encouraging seed adoption.
Challenges in the Seeds Market Sector
The seeds market faces several challenges:
- Climate Change: Extreme weather events and changing climatic patterns negatively impact crop yields and seed production.
- Pests and Diseases: Increasing pest resistance to insecticides and the emergence of new diseases threaten yields, requiring new seed varieties.
- Supply Chain Disruptions: Global events can disrupt seed supply chains, leading to shortages and price volatility.
Emerging Opportunities in Seeds Market
- Biotechnology: Breakthroughs in gene editing and other advanced biotechnological tools are unlocking unprecedented opportunities to develop climate-resilient seed varieties that possess superior yield capabilities and enhanced nutritional profiles.
- Precision Agriculture: The widespread adoption of data-driven farming techniques, collectively known as precision agriculture, enables more targeted and efficient seed utilization, leading to optimized crop yields and a significant reduction in resource consumption, such as water and fertilizers.
- Organic and Sustainable Seeds: A burgeoning global demand for environmentally responsible agricultural practices is creating substantial market opportunities for organic and sustainably sourced seed varieties, catering to both consumers and farmers seeking eco-friendly solutions.
Leading Players in the Seeds Market Market
Key Developments in Seeds Market Industry
- July 2023: Syngenta launched a new hybrid winter barley with tolerance to barley yellowing virus (BYDV) and higher yield. This strengthens Syngenta's position in the barley market and addresses a significant crop disease challenge.
- July 2023: BASF expanded its Xitavo soybean seed portfolio with 11 new high-yielding varieties for the 2024 growing season, featuring Enlist E3 technology. This enhances BASF's competitiveness in the soybean market and addresses the need for weed control solutions.
- August 2023: Bayer AG launched the herbicide-tolerant biotech corn Dekalb DK95R in Indonesia. This expansion into new markets showcases Bayer's commitment to global food security and demonstrates the growing acceptance of biotech crops in certain regions.
Strategic Outlook for Seeds Market Market
The seeds market is on a trajectory of sustained and robust growth, propelled by the escalating global demand for food, continuous advancements in agricultural technologies, and supportive governmental policies aimed at bolstering food security and agricultural innovation. Promising avenues for future growth lie in the development of seeds engineered for climate resilience, the strategic integration of precision agriculture technologies to optimize farming practices, and the increasing demand for organic and sustainable seed options. Companies that proactively invest in cutting-edge R&D, champion sustainable operational practices, and remain agile in adapting to the ever-evolving market dynamics are best positioned to seize these future opportunities and lead the industry. The future of the seeds market will undoubtedly be shaped by an increased emphasis on data-driven decision-making and the creation of seed varieties meticulously tailored to specific environmental conditions and regional agricultural needs.
Seeds Market Segmentation
-
1. Breeding Technology
-
1.1. Hybrids
- 1.1.1. Non-Transgenic Hybrids
- 1.1.2. Herbicide Tolerant Hybrids
- 1.1.3. Insect Resistant Hybrids
- 1.1.4. Other Traits
- 1.2. Open Pollinated Varieties & Hybrid Derivatives
-
1.1. Hybrids
-
2. Cultivation Mechanism
- 2.1. Open Field
- 2.2. Protected Cultivation
-
3. Crop Type
-
3.1. Row Crops
-
3.1.1. Fiber Crops
- 3.1.1.1. Cotton
- 3.1.1.2. Other Fiber Crops
-
3.1.2. Forage Crops
- 3.1.2.1. Alfalfa
- 3.1.2.2. Forage Corn
- 3.1.2.3. Forage Sorghum
- 3.1.2.4. Other Forage Crops
-
3.1.3. Grains & Cereals
- 3.1.3.1. Rice
- 3.1.3.2. Wheat
- 3.1.3.3. Other Grains & Cereals
-
3.1.4. Oilseeds
- 3.1.4.1. Canola, Rapeseed & Mustard
- 3.1.4.2. Soybean
- 3.1.4.3. Sunflower
- 3.1.4.4. Other Oilseeds
- 3.1.5. Pulses
-
3.1.1. Fiber Crops
-
3.2. Vegetables
-
3.2.1. Brassicas
- 3.2.1.1. Cabbage
- 3.2.1.2. Carrot
- 3.2.1.3. Cauliflower & Broccoli
- 3.2.1.4. Other Brassicas
-
3.2.2. Cucurbits
- 3.2.2.1. Cucumber & Gherkin
- 3.2.2.2. Pumpkin & Squash
- 3.2.2.3. Other Cucurbits
-
3.2.3. Roots & Bulbs
- 3.2.3.1. Garlic
- 3.2.3.2. Onion
- 3.2.3.3. Potato
- 3.2.3.4. Other Roots & Bulbs
-
3.2.4. Solanaceae
- 3.2.4.1. Chilli
- 3.2.4.2. Eggplant
- 3.2.4.3. Tomato
- 3.2.4.4. Other Solanaceae
-
3.2.5. Unclassified Vegetables
- 3.2.5.1. Asparagus
- 3.2.5.2. Lettuce
- 3.2.5.3. Okra
- 3.2.5.4. Peas
- 3.2.5.5. Spinach
- 3.2.5.6. Other Unclassified Vegetables
-
3.2.1. Brassicas
-
3.1. Row Crops
-
4. Breeding Technology
-
4.1. Hybrids
- 4.1.1. Non-Transgenic Hybrids
- 4.1.2. Herbicide Tolerant Hybrids
- 4.1.3. Insect Resistant Hybrids
- 4.1.4. Other Traits
- 4.2. Open Pollinated Varieties & Hybrid Derivatives
-
4.1. Hybrids
-
5. Cultivation Mechanism
- 5.1. Open Field
- 5.2. Protected Cultivation
-
6. Crop Type
-
6.1. Row Crops
-
6.1.1. Fiber Crops
- 6.1.1.1. Cotton
- 6.1.1.2. Other Fiber Crops
-
6.1.2. Forage Crops
- 6.1.2.1. Alfalfa
- 6.1.2.2. Forage Corn
- 6.1.2.3. Forage Sorghum
- 6.1.2.4. Other Forage Crops
-
6.1.3. Grains & Cereals
- 6.1.3.1. Rice
- 6.1.3.2. Wheat
- 6.1.3.3. Other Grains & Cereals
-
6.1.4. Oilseeds
- 6.1.4.1. Canola, Rapeseed & Mustard
- 6.1.4.2. Soybean
- 6.1.4.3. Sunflower
- 6.1.4.4. Other Oilseeds
- 6.1.5. Pulses
-
6.1.1. Fiber Crops
-
6.2. Vegetables
-
6.2.1. Brassicas
- 6.2.1.1. Cabbage
- 6.2.1.2. Carrot
- 6.2.1.3. Cauliflower & Broccoli
- 6.2.1.4. Other Brassicas
-
6.2.2. Cucurbits
- 6.2.2.1. Cucumber & Gherkin
- 6.2.2.2. Pumpkin & Squash
- 6.2.2.3. Other Cucurbits
-
6.2.3. Roots & Bulbs
- 6.2.3.1. Garlic
- 6.2.3.2. Onion
- 6.2.3.3. Potato
- 6.2.3.4. Other Roots & Bulbs
-
6.2.4. Solanaceae
- 6.2.4.1. Chilli
- 6.2.4.2. Eggplant
- 6.2.4.3. Tomato
- 6.2.4.4. Other Solanaceae
-
6.2.5. Unclassified Vegetables
- 6.2.5.1. Asparagus
- 6.2.5.2. Lettuce
- 6.2.5.3. Okra
- 6.2.5.4. Peas
- 6.2.5.5. Spinach
- 6.2.5.6. Other Unclassified Vegetables
-
6.2.1. Brassicas
-
6.1. Row Crops
Seeds Market Segmentation By Geography
-
1. North America
- 1.1. United States
- 1.2. Canada
- 1.3. Mexico
-
2. South America
- 2.1. Brazil
- 2.2. Argentina
- 2.3. Rest of South America
-
3. Europe
- 3.1. United Kingdom
- 3.2. Germany
- 3.3. France
- 3.4. Italy
- 3.5. Spain
- 3.6. Russia
- 3.7. Benelux
- 3.8. Nordics
- 3.9. Rest of Europe
-
4. Middle East & Africa
- 4.1. Turkey
- 4.2. Israel
- 4.3. GCC
- 4.4. North Africa
- 4.5. South Africa
- 4.6. Rest of Middle East & Africa
-
5. Asia Pacific
- 5.1. China
- 5.2. India
- 5.3. Japan
- 5.4. South Korea
- 5.5. ASEAN
- 5.6. Oceania
- 5.7. Rest of Asia Pacific
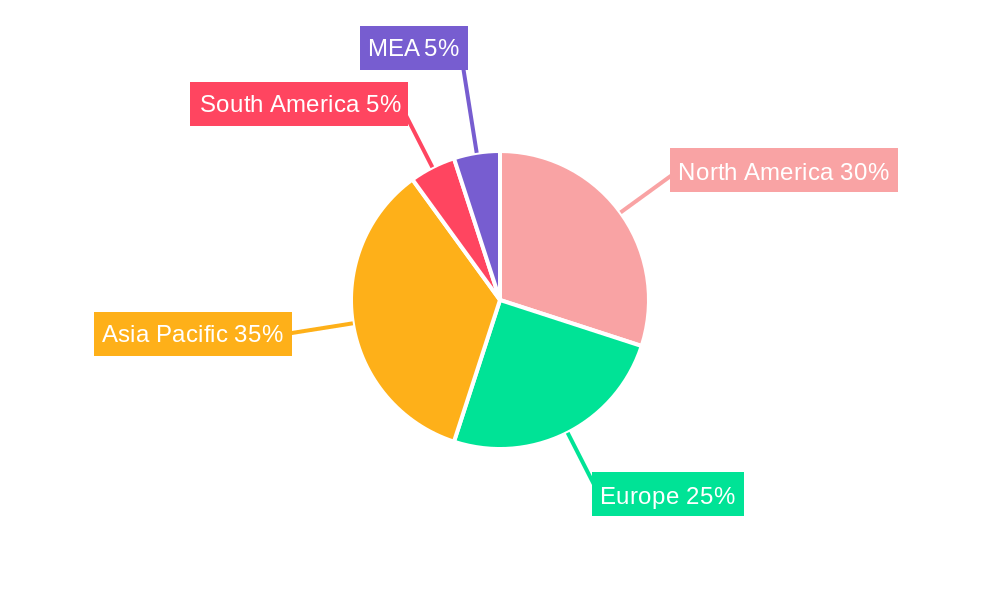
Seeds Market Regional Market Share
Geographic Coverage of Seeds Market
Seeds Market REPORT HIGHLIGHTS
| Aspects | Details |
|---|---|
| Study Period | 2020-2034 |
| Base Year | 2025 |
| Estimated Year | 2026 |
| Forecast Period | 2026-2034 |
| Historical Period | 2020-2025 |
| Growth Rate | CAGR of 4.70% from 2020-2034 |
| Segmentation |
|
Table of Contents
- 1. Introduction
- 1.1. Research Scope
- 1.2. Market Segmentation
- 1.3. Research Objective
- 1.4. Definitions and Assumptions
- 2. Executive Summary
- 2.1. Market Snapshot
- 3. Market Dynamics
- 3.1. Market Drivers
- 3.2. Market Restrains
- 3.3. Market Trends
- 3.4. Market Opportunities
- 4. Market Factor Analysis
- 4.1. Porters Five Forces
- 4.1.1. Bargaining Power of Suppliers
- 4.1.2. Bargaining Power of Buyers
- 4.1.3. Threat of New Entrants
- 4.1.4. Threat of Substitutes
- 4.1.5. Competitive Rivalry
- 4.2. PESTEL analysis
- 4.3. BCG Analysis
- 4.3.1. Stars (High Growth, High Market Share)
- 4.3.2. Cash Cows (Low Growth, High Market Share)
- 4.3.3. Question Mark (High Growth, Low Market Share)
- 4.3.4. Dogs (Low Growth, Low Market Share)
- 4.4. Ansoff Matrix Analysis
- 4.5. Supply Chain Analysis
- 4.6. Regulatory Landscape
- 4.7. Current Market Potential and Opportunity Assessment (TAM–SAM–SOM Framework)
- 4.8. RAX Analyst Note
- 4.1. Porters Five Forces
- 5. Market Analysis, Insights and Forecast 2021-2033
- 5.1. Market Analysis, Insights and Forecast - by Breeding Technology
- 5.1.1. Hybrids
- 5.1.1.1. Non-Transgenic Hybrids
- 5.1.1.2. Herbicide Tolerant Hybrids
- 5.1.1.3. Insect Resistant Hybrids
- 5.1.1.4. Other Traits
- 5.1.2. Open Pollinated Varieties & Hybrid Derivatives
- 5.1.1. Hybrids
- 5.2. Market Analysis, Insights and Forecast - by Cultivation Mechanism
- 5.2.1. Open Field
- 5.2.2. Protected Cultivation
- 5.3. Market Analysis, Insights and Forecast - by Crop Type
- 5.3.1. Row Crops
- 5.3.1.1. Fiber Crops
- 5.3.1.1.1. Cotton
- 5.3.1.1.2. Other Fiber Crops
- 5.3.1.2. Forage Crops
- 5.3.1.2.1. Alfalfa
- 5.3.1.2.2. Forage Corn
- 5.3.1.2.3. Forage Sorghum
- 5.3.1.2.4. Other Forage Crops
- 5.3.1.3. Grains & Cereals
- 5.3.1.3.1. Rice
- 5.3.1.3.2. Wheat
- 5.3.1.3.3. Other Grains & Cereals
- 5.3.1.4. Oilseeds
- 5.3.1.4.1. Canola, Rapeseed & Mustard
- 5.3.1.4.2. Soybean
- 5.3.1.4.3. Sunflower
- 5.3.1.4.4. Other Oilseeds
- 5.3.1.5. Pulses
- 5.3.1.1. Fiber Crops
- 5.3.2. Vegetables
- 5.3.2.1. Brassicas
- 5.3.2.1.1. Cabbage
- 5.3.2.1.2. Carrot
- 5.3.2.1.3. Cauliflower & Broccoli
- 5.3.2.1.4. Other Brassicas
- 5.3.2.2. Cucurbits
- 5.3.2.2.1. Cucumber & Gherkin
- 5.3.2.2.2. Pumpkin & Squash
- 5.3.2.2.3. Other Cucurbits
- 5.3.2.3. Roots & Bulbs
- 5.3.2.3.1. Garlic
- 5.3.2.3.2. Onion
- 5.3.2.3.3. Potato
- 5.3.2.3.4. Other Roots & Bulbs
- 5.3.2.4. Solanaceae
- 5.3.2.4.1. Chilli
- 5.3.2.4.2. Eggplant
- 5.3.2.4.3. Tomato
- 5.3.2.4.4. Other Solanaceae
- 5.3.2.5. Unclassified Vegetables
- 5.3.2.5.1. Asparagus
- 5.3.2.5.2. Lettuce
- 5.3.2.5.3. Okra
- 5.3.2.5.4. Peas
- 5.3.2.5.5. Spinach
- 5.3.2.5.6. Other Unclassified Vegetables
- 5.3.2.1. Brassicas
- 5.3.1. Row Crops
- 5.4. Market Analysis, Insights and Forecast - by Breeding Technology
- 5.4.1. Hybrids
- 5.4.1.1. Non-Transgenic Hybrids
- 5.4.1.2. Herbicide Tolerant Hybrids
- 5.4.1.3. Insect Resistant Hybrids
- 5.4.1.4. Other Traits
- 5.4.2. Open Pollinated Varieties & Hybrid Derivatives
- 5.4.1. Hybrids
- 5.5. Market Analysis, Insights and Forecast - by Cultivation Mechanism
- 5.5.1. Open Field
- 5.5.2. Protected Cultivation
- 5.6. Market Analysis, Insights and Forecast - by Crop Type
- 5.6.1. Row Crops
- 5.6.1.1. Fiber Crops
- 5.6.1.1.1. Cotton
- 5.6.1.1.2. Other Fiber Crops
- 5.6.1.2. Forage Crops
- 5.6.1.2.1. Alfalfa
- 5.6.1.2.2. Forage Corn
- 5.6.1.2.3. Forage Sorghum
- 5.6.1.2.4. Other Forage Crops
- 5.6.1.3. Grains & Cereals
- 5.6.1.3.1. Rice
- 5.6.1.3.2. Wheat
- 5.6.1.3.3. Other Grains & Cereals
- 5.6.1.4. Oilseeds
- 5.6.1.4.1. Canola, Rapeseed & Mustard
- 5.6.1.4.2. Soybean
- 5.6.1.4.3. Sunflower
- 5.6.1.4.4. Other Oilseeds
- 5.6.1.5. Pulses
- 5.6.1.1. Fiber Crops
- 5.6.2. Vegetables
- 5.6.2.1. Brassicas
- 5.6.2.1.1. Cabbage
- 5.6.2.1.2. Carrot
- 5.6.2.1.3. Cauliflower & Broccoli
- 5.6.2.1.4. Other Brassicas
- 5.6.2.2. Cucurbits
- 5.6.2.2.1. Cucumber & Gherkin
- 5.6.2.2.2. Pumpkin & Squash
- 5.6.2.2.3. Other Cucurbits
- 5.6.2.3. Roots & Bulbs
- 5.6.2.3.1. Garlic
- 5.6.2.3.2. Onion
- 5.6.2.3.3. Potato
- 5.6.2.3.4. Other Roots & Bulbs
- 5.6.2.4. Solanaceae
- 5.6.2.4.1. Chilli
- 5.6.2.4.2. Eggplant
- 5.6.2.4.3. Tomato
- 5.6.2.4.4. Other Solanaceae
- 5.6.2.5. Unclassified Vegetables
- 5.6.2.5.1. Asparagus
- 5.6.2.5.2. Lettuce
- 5.6.2.5.3. Okra
- 5.6.2.5.4. Peas
- 5.6.2.5.5. Spinach
- 5.6.2.5.6. Other Unclassified Vegetables
- 5.6.2.1. Brassicas
- 5.6.1. Row Crops
- 5.7. Market Analysis, Insights and Forecast - by Region
- 5.7.1. North America
- 5.7.2. South America
- 5.7.3. Europe
- 5.7.4. Middle East & Africa
- 5.7.5. Asia Pacific
- 5.1. Market Analysis, Insights and Forecast - by Breeding Technology
- 6. Global Seeds Market Analysis, Insights and Forecast, 2021-2033
- 6.1. Market Analysis, Insights and Forecast - by Breeding Technology
- 6.1.1. Hybrids
- 6.1.1.1. Non-Transgenic Hybrids
- 6.1.1.2. Herbicide Tolerant Hybrids
- 6.1.1.3. Insect Resistant Hybrids
- 6.1.1.4. Other Traits
- 6.1.2. Open Pollinated Varieties & Hybrid Derivatives
- 6.1.1. Hybrids
- 6.2. Market Analysis, Insights and Forecast - by Cultivation Mechanism
- 6.2.1. Open Field
- 6.2.2. Protected Cultivation
- 6.3. Market Analysis, Insights and Forecast - by Crop Type
- 6.3.1. Row Crops
- 6.3.1.1. Fiber Crops
- 6.3.1.1.1. Cotton
- 6.3.1.1.2. Other Fiber Crops
- 6.3.1.2. Forage Crops
- 6.3.1.2.1. Alfalfa
- 6.3.1.2.2. Forage Corn
- 6.3.1.2.3. Forage Sorghum
- 6.3.1.2.4. Other Forage Crops
- 6.3.1.3. Grains & Cereals
- 6.3.1.3.1. Rice
- 6.3.1.3.2. Wheat
- 6.3.1.3.3. Other Grains & Cereals
- 6.3.1.4. Oilseeds
- 6.3.1.4.1. Canola, Rapeseed & Mustard
- 6.3.1.4.2. Soybean
- 6.3.1.4.3. Sunflower
- 6.3.1.4.4. Other Oilseeds
- 6.3.1.5. Pulses
- 6.3.1.1. Fiber Crops
- 6.3.2. Vegetables
- 6.3.2.1. Brassicas
- 6.3.2.1.1. Cabbage
- 6.3.2.1.2. Carrot
- 6.3.2.1.3. Cauliflower & Broccoli
- 6.3.2.1.4. Other Brassicas
- 6.3.2.2. Cucurbits
- 6.3.2.2.1. Cucumber & Gherkin
- 6.3.2.2.2. Pumpkin & Squash
- 6.3.2.2.3. Other Cucurbits
- 6.3.2.3. Roots & Bulbs
- 6.3.2.3.1. Garlic
- 6.3.2.3.2. Onion
- 6.3.2.3.3. Potato
- 6.3.2.3.4. Other Roots & Bulbs
- 6.3.2.4. Solanaceae
- 6.3.2.4.1. Chilli
- 6.3.2.4.2. Eggplant
- 6.3.2.4.3. Tomato
- 6.3.2.4.4. Other Solanaceae
- 6.3.2.5. Unclassified Vegetables
- 6.3.2.5.1. Asparagus
- 6.3.2.5.2. Lettuce
- 6.3.2.5.3. Okra
- 6.3.2.5.4. Peas
- 6.3.2.5.5. Spinach
- 6.3.2.5.6. Other Unclassified Vegetables
- 6.3.2.1. Brassicas
- 6.3.1. Row Crops
- 6.4. Market Analysis, Insights and Forecast - by Breeding Technology
- 6.4.1. Hybrids
- 6.4.1.1. Non-Transgenic Hybrids
- 6.4.1.2. Herbicide Tolerant Hybrids
- 6.4.1.3. Insect Resistant Hybrids
- 6.4.1.4. Other Traits
- 6.4.2. Open Pollinated Varieties & Hybrid Derivatives
- 6.4.1. Hybrids
- 6.5. Market Analysis, Insights and Forecast - by Cultivation Mechanism
- 6.5.1. Open Field
- 6.5.2. Protected Cultivation
- 6.6. Market Analysis, Insights and Forecast - by Crop Type
- 6.6.1. Row Crops
- 6.6.1.1. Fiber Crops
- 6.6.1.1.1. Cotton
- 6.6.1.1.2. Other Fiber Crops
- 6.6.1.2. Forage Crops
- 6.6.1.2.1. Alfalfa
- 6.6.1.2.2. Forage Corn
- 6.6.1.2.3. Forage Sorghum
- 6.6.1.2.4. Other Forage Crops
- 6.6.1.3. Grains & Cereals
- 6.6.1.3.1. Rice
- 6.6.1.3.2. Wheat
- 6.6.1.3.3. Other Grains & Cereals
- 6.6.1.4. Oilseeds
- 6.6.1.4.1. Canola, Rapeseed & Mustard
- 6.6.1.4.2. Soybean
- 6.6.1.4.3. Sunflower
- 6.6.1.4.4. Other Oilseeds
- 6.6.1.5. Pulses
- 6.6.1.1. Fiber Crops
- 6.6.2. Vegetables
- 6.6.2.1. Brassicas
- 6.6.2.1.1. Cabbage
- 6.6.2.1.2. Carrot
- 6.6.2.1.3. Cauliflower & Broccoli
- 6.6.2.1.4. Other Brassicas
- 6.6.2.2. Cucurbits
- 6.6.2.2.1. Cucumber & Gherkin
- 6.6.2.2.2. Pumpkin & Squash
- 6.6.2.2.3. Other Cucurbits
- 6.6.2.3. Roots & Bulbs
- 6.6.2.3.1. Garlic
- 6.6.2.3.2. Onion
- 6.6.2.3.3. Potato
- 6.6.2.3.4. Other Roots & Bulbs
- 6.6.2.4. Solanaceae
- 6.6.2.4.1. Chilli
- 6.6.2.4.2. Eggplant
- 6.6.2.4.3. Tomato
- 6.6.2.4.4. Other Solanaceae
- 6.6.2.5. Unclassified Vegetables
- 6.6.2.5.1. Asparagus
- 6.6.2.5.2. Lettuce
- 6.6.2.5.3. Okra
- 6.6.2.5.4. Peas
- 6.6.2.5.5. Spinach
- 6.6.2.5.6. Other Unclassified Vegetables
- 6.6.2.1. Brassicas
- 6.6.1. Row Crops
- 6.1. Market Analysis, Insights and Forecast - by Breeding Technology
- 7. North America Seeds Market Analysis, Insights and Forecast, 2020-2032
- 7.1. Market Analysis, Insights and Forecast - by Breeding Technology
- 7.1.1. Hybrids
- 7.1.1.1. Non-Transgenic Hybrids
- 7.1.1.2. Herbicide Tolerant Hybrids
- 7.1.1.3. Insect Resistant Hybrids
- 7.1.1.4. Other Traits
- 7.1.2. Open Pollinated Varieties & Hybrid Derivatives
- 7.1.1. Hybrids
- 7.2. Market Analysis, Insights and Forecast - by Cultivation Mechanism
- 7.2.1. Open Field
- 7.2.2. Protected Cultivation
- 7.3. Market Analysis, Insights and Forecast - by Crop Type
- 7.3.1. Row Crops
- 7.3.1.1. Fiber Crops
- 7.3.1.1.1. Cotton
- 7.3.1.1.2. Other Fiber Crops
- 7.3.1.2. Forage Crops
- 7.3.1.2.1. Alfalfa
- 7.3.1.2.2. Forage Corn
- 7.3.1.2.3. Forage Sorghum
- 7.3.1.2.4. Other Forage Crops
- 7.3.1.3. Grains & Cereals
- 7.3.1.3.1. Rice
- 7.3.1.3.2. Wheat
- 7.3.1.3.3. Other Grains & Cereals
- 7.3.1.4. Oilseeds
- 7.3.1.4.1. Canola, Rapeseed & Mustard
- 7.3.1.4.2. Soybean
- 7.3.1.4.3. Sunflower
- 7.3.1.4.4. Other Oilseeds
- 7.3.1.5. Pulses
- 7.3.1.1. Fiber Crops
- 7.3.2. Vegetables
- 7.3.2.1. Brassicas
- 7.3.2.1.1. Cabbage
- 7.3.2.1.2. Carrot
- 7.3.2.1.3. Cauliflower & Broccoli
- 7.3.2.1.4. Other Brassicas
- 7.3.2.2. Cucurbits
- 7.3.2.2.1. Cucumber & Gherkin
- 7.3.2.2.2. Pumpkin & Squash
- 7.3.2.2.3. Other Cucurbits
- 7.3.2.3. Roots & Bulbs
- 7.3.2.3.1. Garlic
- 7.3.2.3.2. Onion
- 7.3.2.3.3. Potato
- 7.3.2.3.4. Other Roots & Bulbs
- 7.3.2.4. Solanaceae
- 7.3.2.4.1. Chilli
- 7.3.2.4.2. Eggplant
- 7.3.2.4.3. Tomato
- 7.3.2.4.4. Other Solanaceae
- 7.3.2.5. Unclassified Vegetables
- 7.3.2.5.1. Asparagus
- 7.3.2.5.2. Lettuce
- 7.3.2.5.3. Okra
- 7.3.2.5.4. Peas
- 7.3.2.5.5. Spinach
- 7.3.2.5.6. Other Unclassified Vegetables
- 7.3.2.1. Brassicas
- 7.3.1. Row Crops
- 7.4. Market Analysis, Insights and Forecast - by Breeding Technology
- 7.4.1. Hybrids
- 7.4.1.1. Non-Transgenic Hybrids
- 7.4.1.2. Herbicide Tolerant Hybrids
- 7.4.1.3. Insect Resistant Hybrids
- 7.4.1.4. Other Traits
- 7.4.2. Open Pollinated Varieties & Hybrid Derivatives
- 7.4.1. Hybrids
- 7.5. Market Analysis, Insights and Forecast - by Cultivation Mechanism
- 7.5.1. Open Field
- 7.5.2. Protected Cultivation
- 7.6. Market Analysis, Insights and Forecast - by Crop Type
- 7.6.1. Row Crops
- 7.6.1.1. Fiber Crops
- 7.6.1.1.1. Cotton
- 7.6.1.1.2. Other Fiber Crops
- 7.6.1.2. Forage Crops
- 7.6.1.2.1. Alfalfa
- 7.6.1.2.2. Forage Corn
- 7.6.1.2.3. Forage Sorghum
- 7.6.1.2.4. Other Forage Crops
- 7.6.1.3. Grains & Cereals
- 7.6.1.3.1. Rice
- 7.6.1.3.2. Wheat
- 7.6.1.3.3. Other Grains & Cereals
- 7.6.1.4. Oilseeds
- 7.6.1.4.1. Canola, Rapeseed & Mustard
- 7.6.1.4.2. Soybean
- 7.6.1.4.3. Sunflower
- 7.6.1.4.4. Other Oilseeds
- 7.6.1.5. Pulses
- 7.6.1.1. Fiber Crops
- 7.6.2. Vegetables
- 7.6.2.1. Brassicas
- 7.6.2.1.1. Cabbage
- 7.6.2.1.2. Carrot
- 7.6.2.1.3. Cauliflower & Broccoli
- 7.6.2.1.4. Other Brassicas
- 7.6.2.2. Cucurbits
- 7.6.2.2.1. Cucumber & Gherkin
- 7.6.2.2.2. Pumpkin & Squash
- 7.6.2.2.3. Other Cucurbits
- 7.6.2.3. Roots & Bulbs
- 7.6.2.3.1. Garlic
- 7.6.2.3.2. Onion
- 7.6.2.3.3. Potato
- 7.6.2.3.4. Other Roots & Bulbs
- 7.6.2.4. Solanaceae
- 7.6.2.4.1. Chilli
- 7.6.2.4.2. Eggplant
- 7.6.2.4.3. Tomato
- 7.6.2.4.4. Other Solanaceae
- 7.6.2.5. Unclassified Vegetables
- 7.6.2.5.1. Asparagus
- 7.6.2.5.2. Lettuce
- 7.6.2.5.3. Okra
- 7.6.2.5.4. Peas
- 7.6.2.5.5. Spinach
- 7.6.2.5.6. Other Unclassified Vegetables
- 7.6.2.1. Brassicas
- 7.6.1. Row Crops
- 7.1. Market Analysis, Insights and Forecast - by Breeding Technology
- 8. South America Seeds Market Analysis, Insights and Forecast, 2020-2032
- 8.1. Market Analysis, Insights and Forecast - by Breeding Technology
- 8.1.1. Hybrids
- 8.1.1.1. Non-Transgenic Hybrids
- 8.1.1.2. Herbicide Tolerant Hybrids
- 8.1.1.3. Insect Resistant Hybrids
- 8.1.1.4. Other Traits
- 8.1.2. Open Pollinated Varieties & Hybrid Derivatives
- 8.1.1. Hybrids
- 8.2. Market Analysis, Insights and Forecast - by Cultivation Mechanism
- 8.2.1. Open Field
- 8.2.2. Protected Cultivation
- 8.3. Market Analysis, Insights and Forecast - by Crop Type
- 8.3.1. Row Crops
- 8.3.1.1. Fiber Crops
- 8.3.1.1.1. Cotton
- 8.3.1.1.2. Other Fiber Crops
- 8.3.1.2. Forage Crops
- 8.3.1.2.1. Alfalfa
- 8.3.1.2.2. Forage Corn
- 8.3.1.2.3. Forage Sorghum
- 8.3.1.2.4. Other Forage Crops
- 8.3.1.3. Grains & Cereals
- 8.3.1.3.1. Rice
- 8.3.1.3.2. Wheat
- 8.3.1.3.3. Other Grains & Cereals
- 8.3.1.4. Oilseeds
- 8.3.1.4.1. Canola, Rapeseed & Mustard
- 8.3.1.4.2. Soybean
- 8.3.1.4.3. Sunflower
- 8.3.1.4.4. Other Oilseeds
- 8.3.1.5. Pulses
- 8.3.1.1. Fiber Crops
- 8.3.2. Vegetables
- 8.3.2.1. Brassicas
- 8.3.2.1.1. Cabbage
- 8.3.2.1.2. Carrot
- 8.3.2.1.3. Cauliflower & Broccoli
- 8.3.2.1.4. Other Brassicas
- 8.3.2.2. Cucurbits
- 8.3.2.2.1. Cucumber & Gherkin
- 8.3.2.2.2. Pumpkin & Squash
- 8.3.2.2.3. Other Cucurbits
- 8.3.2.3. Roots & Bulbs
- 8.3.2.3.1. Garlic
- 8.3.2.3.2. Onion
- 8.3.2.3.3. Potato
- 8.3.2.3.4. Other Roots & Bulbs
- 8.3.2.4. Solanaceae
- 8.3.2.4.1. Chilli
- 8.3.2.4.2. Eggplant
- 8.3.2.4.3. Tomato
- 8.3.2.4.4. Other Solanaceae
- 8.3.2.5. Unclassified Vegetables
- 8.3.2.5.1. Asparagus
- 8.3.2.5.2. Lettuce
- 8.3.2.5.3. Okra
- 8.3.2.5.4. Peas
- 8.3.2.5.5. Spinach
- 8.3.2.5.6. Other Unclassified Vegetables
- 8.3.2.1. Brassicas
- 8.3.1. Row Crops
- 8.4. Market Analysis, Insights and Forecast - by Breeding Technology
- 8.4.1. Hybrids
- 8.4.1.1. Non-Transgenic Hybrids
- 8.4.1.2. Herbicide Tolerant Hybrids
- 8.4.1.3. Insect Resistant Hybrids
- 8.4.1.4. Other Traits
- 8.4.2. Open Pollinated Varieties & Hybrid Derivatives
- 8.4.1. Hybrids
- 8.5. Market Analysis, Insights and Forecast - by Cultivation Mechanism
- 8.5.1. Open Field
- 8.5.2. Protected Cultivation
- 8.6. Market Analysis, Insights and Forecast - by Crop Type
- 8.6.1. Row Crops
- 8.6.1.1. Fiber Crops
- 8.6.1.1.1. Cotton
- 8.6.1.1.2. Other Fiber Crops
- 8.6.1.2. Forage Crops
- 8.6.1.2.1. Alfalfa
- 8.6.1.2.2. Forage Corn
- 8.6.1.2.3. Forage Sorghum
- 8.6.1.2.4. Other Forage Crops
- 8.6.1.3. Grains & Cereals
- 8.6.1.3.1. Rice
- 8.6.1.3.2. Wheat
- 8.6.1.3.3. Other Grains & Cereals
- 8.6.1.4. Oilseeds
- 8.6.1.4.1. Canola, Rapeseed & Mustard
- 8.6.1.4.2. Soybean
- 8.6.1.4.3. Sunflower
- 8.6.1.4.4. Other Oilseeds
- 8.6.1.5. Pulses
- 8.6.1.1. Fiber Crops
- 8.6.2. Vegetables
- 8.6.2.1. Brassicas
- 8.6.2.1.1. Cabbage
- 8.6.2.1.2. Carrot
- 8.6.2.1.3. Cauliflower & Broccoli
- 8.6.2.1.4. Other Brassicas
- 8.6.2.2. Cucurbits
- 8.6.2.2.1. Cucumber & Gherkin
- 8.6.2.2.2. Pumpkin & Squash
- 8.6.2.2.3. Other Cucurbits
- 8.6.2.3. Roots & Bulbs
- 8.6.2.3.1. Garlic
- 8.6.2.3.2. Onion
- 8.6.2.3.3. Potato
- 8.6.2.3.4. Other Roots & Bulbs
- 8.6.2.4. Solanaceae
- 8.6.2.4.1. Chilli
- 8.6.2.4.2. Eggplant
- 8.6.2.4.3. Tomato
- 8.6.2.4.4. Other Solanaceae
- 8.6.2.5. Unclassified Vegetables
- 8.6.2.5.1. Asparagus
- 8.6.2.5.2. Lettuce
- 8.6.2.5.3. Okra
- 8.6.2.5.4. Peas
- 8.6.2.5.5. Spinach
- 8.6.2.5.6. Other Unclassified Vegetables
- 8.6.2.1. Brassicas
- 8.6.1. Row Crops
- 8.1. Market Analysis, Insights and Forecast - by Breeding Technology
- 9. Europe Seeds Market Analysis, Insights and Forecast, 2020-2032
- 9.1. Market Analysis, Insights and Forecast - by Breeding Technology
- 9.1.1. Hybrids
- 9.1.1.1. Non-Transgenic Hybrids
- 9.1.1.2. Herbicide Tolerant Hybrids
- 9.1.1.3. Insect Resistant Hybrids
- 9.1.1.4. Other Traits
- 9.1.2. Open Pollinated Varieties & Hybrid Derivatives
- 9.1.1. Hybrids
- 9.2. Market Analysis, Insights and Forecast - by Cultivation Mechanism
- 9.2.1. Open Field
- 9.2.2. Protected Cultivation
- 9.3. Market Analysis, Insights and Forecast - by Crop Type
- 9.3.1. Row Crops
- 9.3.1.1. Fiber Crops
- 9.3.1.1.1. Cotton
- 9.3.1.1.2. Other Fiber Crops
- 9.3.1.2. Forage Crops
- 9.3.1.2.1. Alfalfa
- 9.3.1.2.2. Forage Corn
- 9.3.1.2.3. Forage Sorghum
- 9.3.1.2.4. Other Forage Crops
- 9.3.1.3. Grains & Cereals
- 9.3.1.3.1. Rice
- 9.3.1.3.2. Wheat
- 9.3.1.3.3. Other Grains & Cereals
- 9.3.1.4. Oilseeds
- 9.3.1.4.1. Canola, Rapeseed & Mustard
- 9.3.1.4.2. Soybean
- 9.3.1.4.3. Sunflower
- 9.3.1.4.4. Other Oilseeds
- 9.3.1.5. Pulses
- 9.3.1.1. Fiber Crops
- 9.3.2. Vegetables
- 9.3.2.1. Brassicas
- 9.3.2.1.1. Cabbage
- 9.3.2.1.2. Carrot
- 9.3.2.1.3. Cauliflower & Broccoli
- 9.3.2.1.4. Other Brassicas
- 9.3.2.2. Cucurbits
- 9.3.2.2.1. Cucumber & Gherkin
- 9.3.2.2.2. Pumpkin & Squash
- 9.3.2.2.3. Other Cucurbits
- 9.3.2.3. Roots & Bulbs
- 9.3.2.3.1. Garlic
- 9.3.2.3.2. Onion
- 9.3.2.3.3. Potato
- 9.3.2.3.4. Other Roots & Bulbs
- 9.3.2.4. Solanaceae
- 9.3.2.4.1. Chilli
- 9.3.2.4.2. Eggplant
- 9.3.2.4.3. Tomato
- 9.3.2.4.4. Other Solanaceae
- 9.3.2.5. Unclassified Vegetables
- 9.3.2.5.1. Asparagus
- 9.3.2.5.2. Lettuce
- 9.3.2.5.3. Okra
- 9.3.2.5.4. Peas
- 9.3.2.5.5. Spinach
- 9.3.2.5.6. Other Unclassified Vegetables
- 9.3.2.1. Brassicas
- 9.3.1. Row Crops
- 9.4. Market Analysis, Insights and Forecast - by Breeding Technology
- 9.4.1. Hybrids
- 9.4.1.1. Non-Transgenic Hybrids
- 9.4.1.2. Herbicide Tolerant Hybrids
- 9.4.1.3. Insect Resistant Hybrids
- 9.4.1.4. Other Traits
- 9.4.2. Open Pollinated Varieties & Hybrid Derivatives
- 9.4.1. Hybrids
- 9.5. Market Analysis, Insights and Forecast - by Cultivation Mechanism
- 9.5.1. Open Field
- 9.5.2. Protected Cultivation
- 9.6. Market Analysis, Insights and Forecast - by Crop Type
- 9.6.1. Row Crops
- 9.6.1.1. Fiber Crops
- 9.6.1.1.1. Cotton
- 9.6.1.1.2. Other Fiber Crops
- 9.6.1.2. Forage Crops
- 9.6.1.2.1. Alfalfa
- 9.6.1.2.2. Forage Corn
- 9.6.1.2.3. Forage Sorghum
- 9.6.1.2.4. Other Forage Crops
- 9.6.1.3. Grains & Cereals
- 9.6.1.3.1. Rice
- 9.6.1.3.2. Wheat
- 9.6.1.3.3. Other Grains & Cereals
- 9.6.1.4. Oilseeds
- 9.6.1.4.1. Canola, Rapeseed & Mustard
- 9.6.1.4.2. Soybean
- 9.6.1.4.3. Sunflower
- 9.6.1.4.4. Other Oilseeds
- 9.6.1.5. Pulses
- 9.6.1.1. Fiber Crops
- 9.6.2. Vegetables
- 9.6.2.1. Brassicas
- 9.6.2.1.1. Cabbage
- 9.6.2.1.2. Carrot
- 9.6.2.1.3. Cauliflower & Broccoli
- 9.6.2.1.4. Other Brassicas
- 9.6.2.2. Cucurbits
- 9.6.2.2.1. Cucumber & Gherkin
- 9.6.2.2.2. Pumpkin & Squash
- 9.6.2.2.3. Other Cucurbits
- 9.6.2.3. Roots & Bulbs
- 9.6.2.3.1. Garlic
- 9.6.2.3.2. Onion
- 9.6.2.3.3. Potato
- 9.6.2.3.4. Other Roots & Bulbs
- 9.6.2.4. Solanaceae
- 9.6.2.4.1. Chilli
- 9.6.2.4.2. Eggplant
- 9.6.2.4.3. Tomato
- 9.6.2.4.4. Other Solanaceae
- 9.6.2.5. Unclassified Vegetables
- 9.6.2.5.1. Asparagus
- 9.6.2.5.2. Lettuce
- 9.6.2.5.3. Okra
- 9.6.2.5.4. Peas
- 9.6.2.5.5. Spinach
- 9.6.2.5.6. Other Unclassified Vegetables
- 9.6.2.1. Brassicas
- 9.6.1. Row Crops
- 9.1. Market Analysis, Insights and Forecast - by Breeding Technology
- 10. Middle East & Africa Seeds Market Analysis, Insights and Forecast, 2020-2032
- 10.1. Market Analysis, Insights and Forecast - by Breeding Technology
- 10.1.1. Hybrids
- 10.1.1.1. Non-Transgenic Hybrids
- 10.1.1.2. Herbicide Tolerant Hybrids
- 10.1.1.3. Insect Resistant Hybrids
- 10.1.1.4. Other Traits
- 10.1.2. Open Pollinated Varieties & Hybrid Derivatives
- 10.1.1. Hybrids
- 10.2. Market Analysis, Insights and Forecast - by Cultivation Mechanism
- 10.2.1. Open Field
- 10.2.2. Protected Cultivation
- 10.3. Market Analysis, Insights and Forecast - by Crop Type
- 10.3.1. Row Crops
- 10.3.1.1. Fiber Crops
- 10.3.1.1.1. Cotton
- 10.3.1.1.2. Other Fiber Crops
- 10.3.1.2. Forage Crops
- 10.3.1.2.1. Alfalfa
- 10.3.1.2.2. Forage Corn
- 10.3.1.2.3. Forage Sorghum
- 10.3.1.2.4. Other Forage Crops
- 10.3.1.3. Grains & Cereals
- 10.3.1.3.1. Rice
- 10.3.1.3.2. Wheat
- 10.3.1.3.3. Other Grains & Cereals
- 10.3.1.4. Oilseeds
- 10.3.1.4.1. Canola, Rapeseed & Mustard
- 10.3.1.4.2. Soybean
- 10.3.1.4.3. Sunflower
- 10.3.1.4.4. Other Oilseeds
- 10.3.1.5. Pulses
- 10.3.1.1. Fiber Crops
- 10.3.2. Vegetables
- 10.3.2.1. Brassicas
- 10.3.2.1.1. Cabbage
- 10.3.2.1.2. Carrot
- 10.3.2.1.3. Cauliflower & Broccoli
- 10.3.2.1.4. Other Brassicas
- 10.3.2.2. Cucurbits
- 10.3.2.2.1. Cucumber & Gherkin
- 10.3.2.2.2. Pumpkin & Squash
- 10.3.2.2.3. Other Cucurbits
- 10.3.2.3. Roots & Bulbs
- 10.3.2.3.1. Garlic
- 10.3.2.3.2. Onion
- 10.3.2.3.3. Potato
- 10.3.2.3.4. Other Roots & Bulbs
- 10.3.2.4. Solanaceae
- 10.3.2.4.1. Chilli
- 10.3.2.4.2. Eggplant
- 10.3.2.4.3. Tomato
- 10.3.2.4.4. Other Solanaceae
- 10.3.2.5. Unclassified Vegetables
- 10.3.2.5.1. Asparagus
- 10.3.2.5.2. Lettuce
- 10.3.2.5.3. Okra
- 10.3.2.5.4. Peas
- 10.3.2.5.5. Spinach
- 10.3.2.5.6. Other Unclassified Vegetables
- 10.3.2.1. Brassicas
- 10.3.1. Row Crops
- 10.4. Market Analysis, Insights and Forecast - by Breeding Technology
- 10.4.1. Hybrids
- 10.4.1.1. Non-Transgenic Hybrids
- 10.4.1.2. Herbicide Tolerant Hybrids
- 10.4.1.3. Insect Resistant Hybrids
- 10.4.1.4. Other Traits
- 10.4.2. Open Pollinated Varieties & Hybrid Derivatives
- 10.4.1. Hybrids
- 10.5. Market Analysis, Insights and Forecast - by Cultivation Mechanism
- 10.5.1. Open Field
- 10.5.2. Protected Cultivation
- 10.6. Market Analysis, Insights and Forecast - by Crop Type
- 10.6.1. Row Crops
- 10.6.1.1. Fiber Crops
- 10.6.1.1.1. Cotton
- 10.6.1.1.2. Other Fiber Crops
- 10.6.1.2. Forage Crops
- 10.6.1.2.1. Alfalfa
- 10.6.1.2.2. Forage Corn
- 10.6.1.2.3. Forage Sorghum
- 10.6.1.2.4. Other Forage Crops
- 10.6.1.3. Grains & Cereals
- 10.6.1.3.1. Rice
- 10.6.1.3.2. Wheat
- 10.6.1.3.3. Other Grains & Cereals
- 10.6.1.4. Oilseeds
- 10.6.1.4.1. Canola, Rapeseed & Mustard
- 10.6.1.4.2. Soybean
- 10.6.1.4.3. Sunflower
- 10.6.1.4.4. Other Oilseeds
- 10.6.1.5. Pulses
- 10.6.1.1. Fiber Crops
- 10.6.2. Vegetables
- 10.6.2.1. Brassicas
- 10.6.2.1.1. Cabbage
- 10.6.2.1.2. Carrot
- 10.6.2.1.3. Cauliflower & Broccoli
- 10.6.2.1.4. Other Brassicas
- 10.6.2.2. Cucurbits
- 10.6.2.2.1. Cucumber & Gherkin
- 10.6.2.2.2. Pumpkin & Squash
- 10.6.2.2.3. Other Cucurbits
- 10.6.2.3. Roots & Bulbs
- 10.6.2.3.1. Garlic
- 10.6.2.3.2. Onion
- 10.6.2.3.3. Potato
- 10.6.2.3.4. Other Roots & Bulbs
- 10.6.2.4. Solanaceae
- 10.6.2.4.1. Chilli
- 10.6.2.4.2. Eggplant
- 10.6.2.4.3. Tomato
- 10.6.2.4.4. Other Solanaceae
- 10.6.2.5. Unclassified Vegetables
- 10.6.2.5.1. Asparagus
- 10.6.2.5.2. Lettuce
- 10.6.2.5.3. Okra
- 10.6.2.5.4. Peas
- 10.6.2.5.5. Spinach
- 10.6.2.5.6. Other Unclassified Vegetables
- 10.6.2.1. Brassicas
- 10.6.1. Row Crops
- 10.1. Market Analysis, Insights and Forecast - by Breeding Technology
- 11. Asia Pacific Seeds Market Analysis, Insights and Forecast, 2020-2032
- 11.1. Market Analysis, Insights and Forecast - by Breeding Technology
- 11.1.1. Hybrids
- 11.1.1.1. Non-Transgenic Hybrids
- 11.1.1.2. Herbicide Tolerant Hybrids
- 11.1.1.3. Insect Resistant Hybrids
- 11.1.1.4. Other Traits
- 11.1.2. Open Pollinated Varieties & Hybrid Derivatives
- 11.1.1. Hybrids
- 11.2. Market Analysis, Insights and Forecast - by Cultivation Mechanism
- 11.2.1. Open Field
- 11.2.2. Protected Cultivation
- 11.3. Market Analysis, Insights and Forecast - by Crop Type
- 11.3.1. Row Crops
- 11.3.1.1. Fiber Crops
- 11.3.1.1.1. Cotton
- 11.3.1.1.2. Other Fiber Crops
- 11.3.1.2. Forage Crops
- 11.3.1.2.1. Alfalfa
- 11.3.1.2.2. Forage Corn
- 11.3.1.2.3. Forage Sorghum
- 11.3.1.2.4. Other Forage Crops
- 11.3.1.3. Grains & Cereals
- 11.3.1.3.1. Rice
- 11.3.1.3.2. Wheat
- 11.3.1.3.3. Other Grains & Cereals
- 11.3.1.4. Oilseeds
- 11.3.1.4.1. Canola, Rapeseed & Mustard
- 11.3.1.4.2. Soybean
- 11.3.1.4.3. Sunflower
- 11.3.1.4.4. Other Oilseeds
- 11.3.1.5. Pulses
- 11.3.1.1. Fiber Crops
- 11.3.2. Vegetables
- 11.3.2.1. Brassicas
- 11.3.2.1.1. Cabbage
- 11.3.2.1.2. Carrot
- 11.3.2.1.3. Cauliflower & Broccoli
- 11.3.2.1.4. Other Brassicas
- 11.3.2.2. Cucurbits
- 11.3.2.2.1. Cucumber & Gherkin
- 11.3.2.2.2. Pumpkin & Squash
- 11.3.2.2.3. Other Cucurbits
- 11.3.2.3. Roots & Bulbs
- 11.3.2.3.1. Garlic
- 11.3.2.3.2. Onion
- 11.3.2.3.3. Potato
- 11.3.2.3.4. Other Roots & Bulbs
- 11.3.2.4. Solanaceae
- 11.3.2.4.1. Chilli
- 11.3.2.4.2. Eggplant
- 11.3.2.4.3. Tomato
- 11.3.2.4.4. Other Solanaceae
- 11.3.2.5. Unclassified Vegetables
- 11.3.2.5.1. Asparagus
- 11.3.2.5.2. Lettuce
- 11.3.2.5.3. Okra
- 11.3.2.5.4. Peas
- 11.3.2.5.5. Spinach
- 11.3.2.5.6. Other Unclassified Vegetables
- 11.3.2.1. Brassicas
- 11.3.1. Row Crops
- 11.4. Market Analysis, Insights and Forecast - by Breeding Technology
- 11.4.1. Hybrids
- 11.4.1.1. Non-Transgenic Hybrids
- 11.4.1.2. Herbicide Tolerant Hybrids
- 11.4.1.3. Insect Resistant Hybrids
- 11.4.1.4. Other Traits
- 11.4.2. Open Pollinated Varieties & Hybrid Derivatives
- 11.4.1. Hybrids
- 11.5. Market Analysis, Insights and Forecast - by Cultivation Mechanism
- 11.5.1. Open Field
- 11.5.2. Protected Cultivation
- 11.6. Market Analysis, Insights and Forecast - by Crop Type
- 11.6.1. Row Crops
- 11.6.1.1. Fiber Crops
- 11.6.1.1.1. Cotton
- 11.6.1.1.2. Other Fiber Crops
- 11.6.1.2. Forage Crops
- 11.6.1.2.1. Alfalfa
- 11.6.1.2.2. Forage Corn
- 11.6.1.2.3. Forage Sorghum
- 11.6.1.2.4. Other Forage Crops
- 11.6.1.3. Grains & Cereals
- 11.6.1.3.1. Rice
- 11.6.1.3.2. Wheat
- 11.6.1.3.3. Other Grains & Cereals
- 11.6.1.4. Oilseeds
- 11.6.1.4.1. Canola, Rapeseed & Mustard
- 11.6.1.4.2. Soybean
- 11.6.1.4.3. Sunflower
- 11.6.1.4.4. Other Oilseeds
- 11.6.1.5. Pulses
- 11.6.1.1. Fiber Crops
- 11.6.2. Vegetables
- 11.6.2.1. Brassicas
- 11.6.2.1.1. Cabbage
- 11.6.2.1.2. Carrot
- 11.6.2.1.3. Cauliflower & Broccoli
- 11.6.2.1.4. Other Brassicas
- 11.6.2.2. Cucurbits
- 11.6.2.2.1. Cucumber & Gherkin
- 11.6.2.2.2. Pumpkin & Squash
- 11.6.2.2.3. Other Cucurbits
- 11.6.2.3. Roots & Bulbs
- 11.6.2.3.1. Garlic
- 11.6.2.3.2. Onion
- 11.6.2.3.3. Potato
- 11.6.2.3.4. Other Roots & Bulbs
- 11.6.2.4. Solanaceae
- 11.6.2.4.1. Chilli
- 11.6.2.4.2. Eggplant
- 11.6.2.4.3. Tomato
- 11.6.2.4.4. Other Solanaceae
- 11.6.2.5. Unclassified Vegetables
- 11.6.2.5.1. Asparagus
- 11.6.2.5.2. Lettuce
- 11.6.2.5.3. Okra
- 11.6.2.5.4. Peas
- 11.6.2.5.5. Spinach
- 11.6.2.5.6. Other Unclassified Vegetables
- 11.6.2.1. Brassicas
- 11.6.1. Row Crops
- 11.1. Market Analysis, Insights and Forecast - by Breeding Technology
- 12. Competitive Analysis
- 12.1. Company Profiles
- 12.1.1 Sakata Seeds Corporation
- 12.1.1.1. Company Overview
- 12.1.1.2. Products
- 12.1.1.3. Company Financials
- 12.1.1.4. SWOT Analysis
- 12.1.2 Groupe Limagrain
- 12.1.2.1. Company Overview
- 12.1.2.2. Products
- 12.1.2.3. Company Financials
- 12.1.2.4. SWOT Analysis
- 12.1.3 Rijk Zwaan Zaadteelt en Zaadhandel BV
- 12.1.3.1. Company Overview
- 12.1.3.2. Products
- 12.1.3.3. Company Financials
- 12.1.3.4. SWOT Analysis
- 12.1.4 DLF
- 12.1.4.1. Company Overview
- 12.1.4.2. Products
- 12.1.4.3. Company Financials
- 12.1.4.4. SWOT Analysis
- 12.1.5 Bayer AG
- 12.1.5.1. Company Overview
- 12.1.5.2. Products
- 12.1.5.3. Company Financials
- 12.1.5.4. SWOT Analysis
- 12.1.6 KWS SAAT SE & Co KGaA
- 12.1.6.1. Company Overview
- 12.1.6.2. Products
- 12.1.6.3. Company Financials
- 12.1.6.4. SWOT Analysis
- 12.1.7 Advanta Seeds - UPL
- 12.1.7.1. Company Overview
- 12.1.7.2. Products
- 12.1.7.3. Company Financials
- 12.1.7.4. SWOT Analysis
- 12.1.8 Syngenta Grou
- 12.1.8.1. Company Overview
- 12.1.8.2. Products
- 12.1.8.3. Company Financials
- 12.1.8.4. SWOT Analysis
- 12.1.9 Corteva Agriscience
- 12.1.9.1. Company Overview
- 12.1.9.2. Products
- 12.1.9.3. Company Financials
- 12.1.9.4. SWOT Analysis
- 12.1.10 BASF SE
- 12.1.10.1. Company Overview
- 12.1.10.2. Products
- 12.1.10.3. Company Financials
- 12.1.10.4. SWOT Analysis
- 12.1.1 Sakata Seeds Corporation
- 12.2. Market Entropy
- 12.2.1 Company's Key Areas Served
- 12.2.2 Recent Developments
- 12.3. Company Market Share Analysis 2025
- 12.3.1 Top 5 Companies Market Share Analysis
- 12.3.2 Top 3 Companies Market Share Analysis
- 12.4. List of Potential Customers
- 13. Research Methodology
List of Figures
- Figure 1: Global Seeds Market Revenue Breakdown (Million, %) by Region 2025 & 2033
- Figure 2: Global Seeds Market Volume Breakdown (Kiloton, %) by Region 2025 & 2033
- Figure 3: North America Seeds Market Revenue (Million), by Breeding Technology 2025 & 2033
- Figure 4: North America Seeds Market Volume (Kiloton), by Breeding Technology 2025 & 2033
- Figure 5: North America Seeds Market Revenue Share (%), by Breeding Technology 2025 & 2033
- Figure 6: North America Seeds Market Volume Share (%), by Breeding Technology 2025 & 2033
- Figure 7: North America Seeds Market Revenue (Million), by Cultivation Mechanism 2025 & 2033
- Figure 8: North America Seeds Market Volume (Kiloton), by Cultivation Mechanism 2025 & 2033
- Figure 9: North America Seeds Market Revenue Share (%), by Cultivation Mechanism 2025 & 2033
- Figure 10: North America Seeds Market Volume Share (%), by Cultivation Mechanism 2025 & 2033
- Figure 11: North America Seeds Market Revenue (Million), by Crop Type 2025 & 2033
- Figure 12: North America Seeds Market Volume (Kiloton), by Crop Type 2025 & 2033
- Figure 13: North America Seeds Market Revenue Share (%), by Crop Type 2025 & 2033
- Figure 14: North America Seeds Market Volume Share (%), by Crop Type 2025 & 2033
- Figure 15: North America Seeds Market Revenue (Million), by Breeding Technology 2025 & 2033
- Figure 16: North America Seeds Market Volume (Kiloton), by Breeding Technology 2025 & 2033
- Figure 17: North America Seeds Market Revenue Share (%), by Breeding Technology 2025 & 2033
- Figure 18: North America Seeds Market Volume Share (%), by Breeding Technology 2025 & 2033
- Figure 19: North America Seeds Market Revenue (Million), by Cultivation Mechanism 2025 & 2033
- Figure 20: North America Seeds Market Volume (Kiloton), by Cultivation Mechanism 2025 & 2033
- Figure 21: North America Seeds Market Revenue Share (%), by Cultivation Mechanism 2025 & 2033
- Figure 22: North America Seeds Market Volume Share (%), by Cultivation Mechanism 2025 & 2033
- Figure 23: North America Seeds Market Revenue (Million), by Crop Type 2025 & 2033
- Figure 24: North America Seeds Market Volume (Kiloton), by Crop Type 2025 & 2033
- Figure 25: North America Seeds Market Revenue Share (%), by Crop Type 2025 & 2033
- Figure 26: North America Seeds Market Volume Share (%), by Crop Type 2025 & 2033
- Figure 27: North America Seeds Market Revenue (Million), by Country 2025 & 2033
- Figure 28: North America Seeds Market Volume (Kiloton), by Country 2025 & 2033
- Figure 29: North America Seeds Market Revenue Share (%), by Country 2025 & 2033
- Figure 30: North America Seeds Market Volume Share (%), by Country 2025 & 2033
- Figure 31: South America Seeds Market Revenue (Million), by Breeding Technology 2025 & 2033
- Figure 32: South America Seeds Market Volume (Kiloton), by Breeding Technology 2025 & 2033
- Figure 33: South America Seeds Market Revenue Share (%), by Breeding Technology 2025 & 2033
- Figure 34: South America Seeds Market Volume Share (%), by Breeding Technology 2025 & 2033
- Figure 35: South America Seeds Market Revenue (Million), by Cultivation Mechanism 2025 & 2033
- Figure 36: South America Seeds Market Volume (Kiloton), by Cultivation Mechanism 2025 & 2033
- Figure 37: South America Seeds Market Revenue Share (%), by Cultivation Mechanism 2025 & 2033
- Figure 38: South America Seeds Market Volume Share (%), by Cultivation Mechanism 2025 & 2033
- Figure 39: South America Seeds Market Revenue (Million), by Crop Type 2025 & 2033
- Figure 40: South America Seeds Market Volume (Kiloton), by Crop Type 2025 & 2033
- Figure 41: South America Seeds Market Revenue Share (%), by Crop Type 2025 & 2033
- Figure 42: South America Seeds Market Volume Share (%), by Crop Type 2025 & 2033
- Figure 43: South America Seeds Market Revenue (Million), by Breeding Technology 2025 & 2033
- Figure 44: South America Seeds Market Volume (Kiloton), by Breeding Technology 2025 & 2033
- Figure 45: South America Seeds Market Revenue Share (%), by Breeding Technology 2025 & 2033
- Figure 46: South America Seeds Market Volume Share (%), by Breeding Technology 2025 & 2033
- Figure 47: South America Seeds Market Revenue (Million), by Cultivation Mechanism 2025 & 2033
- Figure 48: South America Seeds Market Volume (Kiloton), by Cultivation Mechanism 2025 & 2033
- Figure 49: South America Seeds Market Revenue Share (%), by Cultivation Mechanism 2025 & 2033
- Figure 50: South America Seeds Market Volume Share (%), by Cultivation Mechanism 2025 & 2033
- Figure 51: South America Seeds Market Revenue (Million), by Crop Type 2025 & 2033
- Figure 52: South America Seeds Market Volume (Kiloton), by Crop Type 2025 & 2033
- Figure 53: South America Seeds Market Revenue Share (%), by Crop Type 2025 & 2033
- Figure 54: South America Seeds Market Volume Share (%), by Crop Type 2025 & 2033
- Figure 55: South America Seeds Market Revenue (Million), by Country 2025 & 2033
- Figure 56: South America Seeds Market Volume (Kiloton), by Country 2025 & 2033
- Figure 57: South America Seeds Market Revenue Share (%), by Country 2025 & 2033
- Figure 58: South America Seeds Market Volume Share (%), by Country 2025 & 2033
- Figure 59: Europe Seeds Market Revenue (Million), by Breeding Technology 2025 & 2033
- Figure 60: Europe Seeds Market Volume (Kiloton), by Breeding Technology 2025 & 2033
- Figure 61: Europe Seeds Market Revenue Share (%), by Breeding Technology 2025 & 2033
- Figure 62: Europe Seeds Market Volume Share (%), by Breeding Technology 2025 & 2033
- Figure 63: Europe Seeds Market Revenue (Million), by Cultivation Mechanism 2025 & 2033
- Figure 64: Europe Seeds Market Volume (Kiloton), by Cultivation Mechanism 2025 & 2033
- Figure 65: Europe Seeds Market Revenue Share (%), by Cultivation Mechanism 2025 & 2033
- Figure 66: Europe Seeds Market Volume Share (%), by Cultivation Mechanism 2025 & 2033
- Figure 67: Europe Seeds Market Revenue (Million), by Crop Type 2025 & 2033
- Figure 68: Europe Seeds Market Volume (Kiloton), by Crop Type 2025 & 2033
- Figure 69: Europe Seeds Market Revenue Share (%), by Crop Type 2025 & 2033
- Figure 70: Europe Seeds Market Volume Share (%), by Crop Type 2025 & 2033
- Figure 71: Europe Seeds Market Revenue (Million), by Breeding Technology 2025 & 2033
- Figure 72: Europe Seeds Market Volume (Kiloton), by Breeding Technology 2025 & 2033
- Figure 73: Europe Seeds Market Revenue Share (%), by Breeding Technology 2025 & 2033
- Figure 74: Europe Seeds Market Volume Share (%), by Breeding Technology 2025 & 2033
- Figure 75: Europe Seeds Market Revenue (Million), by Cultivation Mechanism 2025 & 2033
- Figure 76: Europe Seeds Market Volume (Kiloton), by Cultivation Mechanism 2025 & 2033
- Figure 77: Europe Seeds Market Revenue Share (%), by Cultivation Mechanism 2025 & 2033
- Figure 78: Europe Seeds Market Volume Share (%), by Cultivation Mechanism 2025 & 2033
- Figure 79: Europe Seeds Market Revenue (Million), by Crop Type 2025 & 2033
- Figure 80: Europe Seeds Market Volume (Kiloton), by Crop Type 2025 & 2033
- Figure 81: Europe Seeds Market Revenue Share (%), by Crop Type 2025 & 2033
- Figure 82: Europe Seeds Market Volume Share (%), by Crop Type 2025 & 2033
- Figure 83: Europe Seeds Market Revenue (Million), by Country 2025 & 2033
- Figure 84: Europe Seeds Market Volume (Kiloton), by Country 2025 & 2033
- Figure 85: Europe Seeds Market Revenue Share (%), by Country 2025 & 2033
- Figure 86: Europe Seeds Market Volume Share (%), by Country 2025 & 2033
- Figure 87: Middle East & Africa Seeds Market Revenue (Million), by Breeding Technology 2025 & 2033
- Figure 88: Middle East & Africa Seeds Market Volume (Kiloton), by Breeding Technology 2025 & 2033
- Figure 89: Middle East & Africa Seeds Market Revenue Share (%), by Breeding Technology 2025 & 2033
- Figure 90: Middle East & Africa Seeds Market Volume Share (%), by Breeding Technology 2025 & 2033
- Figure 91: Middle East & Africa Seeds Market Revenue (Million), by Cultivation Mechanism 2025 & 2033
- Figure 92: Middle East & Africa Seeds Market Volume (Kiloton), by Cultivation Mechanism 2025 & 2033
- Figure 93: Middle East & Africa Seeds Market Revenue Share (%), by Cultivation Mechanism 2025 & 2033
- Figure 94: Middle East & Africa Seeds Market Volume Share (%), by Cultivation Mechanism 2025 & 2033
- Figure 95: Middle East & Africa Seeds Market Revenue (Million), by Crop Type 2025 & 2033
- Figure 96: Middle East & Africa Seeds Market Volume (Kiloton), by Crop Type 2025 & 2033
- Figure 97: Middle East & Africa Seeds Market Revenue Share (%), by Crop Type 2025 & 2033
- Figure 98: Middle East & Africa Seeds Market Volume Share (%), by Crop Type 2025 & 2033
- Figure 99: Middle East & Africa Seeds Market Revenue (Million), by Breeding Technology 2025 & 2033
- Figure 100: Middle East & Africa Seeds Market Volume (Kiloton), by Breeding Technology 2025 & 2033
- Figure 101: Middle East & Africa Seeds Market Revenue Share (%), by Breeding Technology 2025 & 2033
- Figure 102: Middle East & Africa Seeds Market Volume Share (%), by Breeding Technology 2025 & 2033
- Figure 103: Middle East & Africa Seeds Market Revenue (Million), by Cultivation Mechanism 2025 & 2033
- Figure 104: Middle East & Africa Seeds Market Volume (Kiloton), by Cultivation Mechanism 2025 & 2033
- Figure 105: Middle East & Africa Seeds Market Revenue Share (%), by Cultivation Mechanism 2025 & 2033
- Figure 106: Middle East & Africa Seeds Market Volume Share (%), by Cultivation Mechanism 2025 & 2033
- Figure 107: Middle East & Africa Seeds Market Revenue (Million), by Crop Type 2025 & 2033
- Figure 108: Middle East & Africa Seeds Market Volume (Kiloton), by Crop Type 2025 & 2033
- Figure 109: Middle East & Africa Seeds Market Revenue Share (%), by Crop Type 2025 & 2033
- Figure 110: Middle East & Africa Seeds Market Volume Share (%), by Crop Type 2025 & 2033
- Figure 111: Middle East & Africa Seeds Market Revenue (Million), by Country 2025 & 2033
- Figure 112: Middle East & Africa Seeds Market Volume (Kiloton), by Country 2025 & 2033
- Figure 113: Middle East & Africa Seeds Market Revenue Share (%), by Country 2025 & 2033
- Figure 114: Middle East & Africa Seeds Market Volume Share (%), by Country 2025 & 2033
- Figure 115: Asia Pacific Seeds Market Revenue (Million), by Breeding Technology 2025 & 2033
- Figure 116: Asia Pacific Seeds Market Volume (Kiloton), by Breeding Technology 2025 & 2033
- Figure 117: Asia Pacific Seeds Market Revenue Share (%), by Breeding Technology 2025 & 2033
- Figure 118: Asia Pacific Seeds Market Volume Share (%), by Breeding Technology 2025 & 2033
- Figure 119: Asia Pacific Seeds Market Revenue (Million), by Cultivation Mechanism 2025 & 2033
- Figure 120: Asia Pacific Seeds Market Volume (Kiloton), by Cultivation Mechanism 2025 & 2033
- Figure 121: Asia Pacific Seeds Market Revenue Share (%), by Cultivation Mechanism 2025 & 2033
- Figure 122: Asia Pacific Seeds Market Volume Share (%), by Cultivation Mechanism 2025 & 2033
- Figure 123: Asia Pacific Seeds Market Revenue (Million), by Crop Type 2025 & 2033
- Figure 124: Asia Pacific Seeds Market Volume (Kiloton), by Crop Type 2025 & 2033
- Figure 125: Asia Pacific Seeds Market Revenue Share (%), by Crop Type 2025 & 2033
- Figure 126: Asia Pacific Seeds Market Volume Share (%), by Crop Type 2025 & 2033
- Figure 127: Asia Pacific Seeds Market Revenue (Million), by Breeding Technology 2025 & 2033
- Figure 128: Asia Pacific Seeds Market Volume (Kiloton), by Breeding Technology 2025 & 2033
- Figure 129: Asia Pacific Seeds Market Revenue Share (%), by Breeding Technology 2025 & 2033
- Figure 130: Asia Pacific Seeds Market Volume Share (%), by Breeding Technology 2025 & 2033
- Figure 131: Asia Pacific Seeds Market Revenue (Million), by Cultivation Mechanism 2025 & 2033
- Figure 132: Asia Pacific Seeds Market Volume (Kiloton), by Cultivation Mechanism 2025 & 2033
- Figure 133: Asia Pacific Seeds Market Revenue Share (%), by Cultivation Mechanism 2025 & 2033
- Figure 134: Asia Pacific Seeds Market Volume Share (%), by Cultivation Mechanism 2025 & 2033
- Figure 135: Asia Pacific Seeds Market Revenue (Million), by Crop Type 2025 & 2033
- Figure 136: Asia Pacific Seeds Market Volume (Kiloton), by Crop Type 2025 & 2033
- Figure 137: Asia Pacific Seeds Market Revenue Share (%), by Crop Type 2025 & 2033
- Figure 138: Asia Pacific Seeds Market Volume Share (%), by Crop Type 2025 & 2033
- Figure 139: Asia Pacific Seeds Market Revenue (Million), by Country 2025 & 2033
- Figure 140: Asia Pacific Seeds Market Volume (Kiloton), by Country 2025 & 2033
- Figure 141: Asia Pacific Seeds Market Revenue Share (%), by Country 2025 & 2033
- Figure 142: Asia Pacific Seeds Market Volume Share (%), by Country 2025 & 2033
List of Tables
- Table 1: Global Seeds Market Revenue Million Forecast, by Breeding Technology 2020 & 2033
- Table 2: Global Seeds Market Volume Kiloton Forecast, by Breeding Technology 2020 & 2033
- Table 3: Global Seeds Market Revenue Million Forecast, by Cultivation Mechanism 2020 & 2033
- Table 4: Global Seeds Market Volume Kiloton Forecast, by Cultivation Mechanism 2020 & 2033
- Table 5: Global Seeds Market Revenue Million Forecast, by Crop Type 2020 & 2033
- Table 6: Global Seeds Market Volume Kiloton Forecast, by Crop Type 2020 & 2033
- Table 7: Global Seeds Market Revenue Million Forecast, by Breeding Technology 2020 & 2033
- Table 8: Global Seeds Market Volume Kiloton Forecast, by Breeding Technology 2020 & 2033
- Table 9: Global Seeds Market Revenue Million Forecast, by Cultivation Mechanism 2020 & 2033
- Table 10: Global Seeds Market Volume Kiloton Forecast, by Cultivation Mechanism 2020 & 2033
- Table 11: Global Seeds Market Revenue Million Forecast, by Crop Type 2020 & 2033
- Table 12: Global Seeds Market Volume Kiloton Forecast, by Crop Type 2020 & 2033
- Table 13: Global Seeds Market Revenue Million Forecast, by Region 2020 & 2033
- Table 14: Global Seeds Market Volume Kiloton Forecast, by Region 2020 & 2033
- Table 15: Global Seeds Market Revenue Million Forecast, by Breeding Technology 2020 & 2033
- Table 16: Global Seeds Market Volume Kiloton Forecast, by Breeding Technology 2020 & 2033
- Table 17: Global Seeds Market Revenue Million Forecast, by Cultivation Mechanism 2020 & 2033
- Table 18: Global Seeds Market Volume Kiloton Forecast, by Cultivation Mechanism 2020 & 2033
- Table 19: Global Seeds Market Revenue Million Forecast, by Crop Type 2020 & 2033
- Table 20: Global Seeds Market Volume Kiloton Forecast, by Crop Type 2020 & 2033
- Table 21: Global Seeds Market Revenue Million Forecast, by Breeding Technology 2020 & 2033
- Table 22: Global Seeds Market Volume Kiloton Forecast, by Breeding Technology 2020 & 2033
- Table 23: Global Seeds Market Revenue Million Forecast, by Cultivation Mechanism 2020 & 2033
- Table 24: Global Seeds Market Volume Kiloton Forecast, by Cultivation Mechanism 2020 & 2033
- Table 25: Global Seeds Market Revenue Million Forecast, by Crop Type 2020 & 2033
- Table 26: Global Seeds Market Volume Kiloton Forecast, by Crop Type 2020 & 2033
- Table 27: Global Seeds Market Revenue Million Forecast, by Country 2020 & 2033
- Table 28: Global Seeds Market Volume Kiloton Forecast, by Country 2020 & 2033
- Table 29: United States Seeds Market Revenue (Million) Forecast, by Application 2020 & 2033
- Table 30: United States Seeds Market Volume (Kiloton) Forecast, by Application 2020 & 2033
- Table 31: Canada Seeds Market Revenue (Million) Forecast, by Application 2020 & 2033
- Table 32: Canada Seeds Market Volume (Kiloton) Forecast, by Application 2020 & 2033
- Table 33: Mexico Seeds Market Revenue (Million) Forecast, by Application 2020 & 2033
- Table 34: Mexico Seeds Market Volume (Kiloton) Forecast, by Application 2020 & 2033
- Table 35: Global Seeds Market Revenue Million Forecast, by Breeding Technology 2020 & 2033
- Table 36: Global Seeds Market Volume Kiloton Forecast, by Breeding Technology 2020 & 2033
- Table 37: Global Seeds Market Revenue Million Forecast, by Cultivation Mechanism 2020 & 2033
- Table 38: Global Seeds Market Volume Kiloton Forecast, by Cultivation Mechanism 2020 & 2033
- Table 39: Global Seeds Market Revenue Million Forecast, by Crop Type 2020 & 2033
- Table 40: Global Seeds Market Volume Kiloton Forecast, by Crop Type 2020 & 2033
- Table 41: Global Seeds Market Revenue Million Forecast, by Breeding Technology 2020 & 2033
- Table 42: Global Seeds Market Volume Kiloton Forecast, by Breeding Technology 2020 & 2033
- Table 43: Global Seeds Market Revenue Million Forecast, by Cultivation Mechanism 2020 & 2033
- Table 44: Global Seeds Market Volume Kiloton Forecast, by Cultivation Mechanism 2020 & 2033
- Table 45: Global Seeds Market Revenue Million Forecast, by Crop Type 2020 & 2033
- Table 46: Global Seeds Market Volume Kiloton Forecast, by Crop Type 2020 & 2033
- Table 47: Global Seeds Market Revenue Million Forecast, by Country 2020 & 2033
- Table 48: Global Seeds Market Volume Kiloton Forecast, by Country 2020 & 2033
- Table 49: Brazil Seeds Market Revenue (Million) Forecast, by Application 2020 & 2033
- Table 50: Brazil Seeds Market Volume (Kiloton) Forecast, by Application 2020 & 2033
- Table 51: Argentina Seeds Market Revenue (Million) Forecast, by Application 2020 & 2033
- Table 52: Argentina Seeds Market Volume (Kiloton) Forecast, by Application 2020 & 2033
- Table 53: Rest of South America Seeds Market Revenue (Million) Forecast, by Application 2020 & 2033
- Table 54: Rest of South America Seeds Market Volume (Kiloton) Forecast, by Application 2020 & 2033
- Table 55: Global Seeds Market Revenue Million Forecast, by Breeding Technology 2020 & 2033
- Table 56: Global Seeds Market Volume Kiloton Forecast, by Breeding Technology 2020 & 2033
- Table 57: Global Seeds Market Revenue Million Forecast, by Cultivation Mechanism 2020 & 2033
- Table 58: Global Seeds Market Volume Kiloton Forecast, by Cultivation Mechanism 2020 & 2033
- Table 59: Global Seeds Market Revenue Million Forecast, by Crop Type 2020 & 2033
- Table 60: Global Seeds Market Volume Kiloton Forecast, by Crop Type 2020 & 2033
- Table 61: Global Seeds Market Revenue Million Forecast, by Breeding Technology 2020 & 2033
- Table 62: Global Seeds Market Volume Kiloton Forecast, by Breeding Technology 2020 & 2033
- Table 63: Global Seeds Market Revenue Million Forecast, by Cultivation Mechanism 2020 & 2033
- Table 64: Global Seeds Market Volume Kiloton Forecast, by Cultivation Mechanism 2020 & 2033
- Table 65: Global Seeds Market Revenue Million Forecast, by Crop Type 2020 & 2033
- Table 66: Global Seeds Market Volume Kiloton Forecast, by Crop Type 2020 & 2033
- Table 67: Global Seeds Market Revenue Million Forecast, by Country 2020 & 2033
- Table 68: Global Seeds Market Volume Kiloton Forecast, by Country 2020 & 2033
- Table 69: United Kingdom Seeds Market Revenue (Million) Forecast, by Application 2020 & 2033
- Table 70: United Kingdom Seeds Market Volume (Kiloton) Forecast, by Application 2020 & 2033
- Table 71: Germany Seeds Market Revenue (Million) Forecast, by Application 2020 & 2033
- Table 72: Germany Seeds Market Volume (Kiloton) Forecast, by Application 2020 & 2033
- Table 73: France Seeds Market Revenue (Million) Forecast, by Application 2020 & 2033
- Table 74: France Seeds Market Volume (Kiloton) Forecast, by Application 2020 & 2033
- Table 75: Italy Seeds Market Revenue (Million) Forecast, by Application 2020 & 2033
- Table 76: Italy Seeds Market Volume (Kiloton) Forecast, by Application 2020 & 2033
- Table 77: Spain Seeds Market Revenue (Million) Forecast, by Application 2020 & 2033
- Table 78: Spain Seeds Market Volume (Kiloton) Forecast, by Application 2020 & 2033
- Table 79: Russia Seeds Market Revenue (Million) Forecast, by Application 2020 & 2033
- Table 80: Russia Seeds Market Volume (Kiloton) Forecast, by Application 2020 & 2033
- Table 81: Benelux Seeds Market Revenue (Million) Forecast, by Application 2020 & 2033
- Table 82: Benelux Seeds Market Volume (Kiloton) Forecast, by Application 2020 & 2033
- Table 83: Nordics Seeds Market Revenue (Million) Forecast, by Application 2020 & 2033
- Table 84: Nordics Seeds Market Volume (Kiloton) Forecast, by Application 2020 & 2033
- Table 85: Rest of Europe Seeds Market Revenue (Million) Forecast, by Application 2020 & 2033
- Table 86: Rest of Europe Seeds Market Volume (Kiloton) Forecast, by Application 2020 & 2033
- Table 87: Global Seeds Market Revenue Million Forecast, by Breeding Technology 2020 & 2033
- Table 88: Global Seeds Market Volume Kiloton Forecast, by Breeding Technology 2020 & 2033
- Table 89: Global Seeds Market Revenue Million Forecast, by Cultivation Mechanism 2020 & 2033
- Table 90: Global Seeds Market Volume Kiloton Forecast, by Cultivation Mechanism 2020 & 2033
- Table 91: Global Seeds Market Revenue Million Forecast, by Crop Type 2020 & 2033
- Table 92: Global Seeds Market Volume Kiloton Forecast, by Crop Type 2020 & 2033
- Table 93: Global Seeds Market Revenue Million Forecast, by Breeding Technology 2020 & 2033
- Table 94: Global Seeds Market Volume Kiloton Forecast, by Breeding Technology 2020 & 2033
- Table 95: Global Seeds Market Revenue Million Forecast, by Cultivation Mechanism 2020 & 2033
- Table 96: Global Seeds Market Volume Kiloton Forecast, by Cultivation Mechanism 2020 & 2033
- Table 97: Global Seeds Market Revenue Million Forecast, by Crop Type 2020 & 2033
- Table 98: Global Seeds Market Volume Kiloton Forecast, by Crop Type 2020 & 2033
- Table 99: Global Seeds Market Revenue Million Forecast, by Country 2020 & 2033
- Table 100: Global Seeds Market Volume Kiloton Forecast, by Country 2020 & 2033
- Table 101: Turkey Seeds Market Revenue (Million) Forecast, by Application 2020 & 2033
- Table 102: Turkey Seeds Market Volume (Kiloton) Forecast, by Application 2020 & 2033
- Table 103: Israel Seeds Market Revenue (Million) Forecast, by Application 2020 & 2033
- Table 104: Israel Seeds Market Volume (Kiloton) Forecast, by Application 2020 & 2033
- Table 105: GCC Seeds Market Revenue (Million) Forecast, by Application 2020 & 2033
- Table 106: GCC Seeds Market Volume (Kiloton) Forecast, by Application 2020 & 2033
- Table 107: North Africa Seeds Market Revenue (Million) Forecast, by Application 2020 & 2033
- Table 108: North Africa Seeds Market Volume (Kiloton) Forecast, by Application 2020 & 2033
- Table 109: South Africa Seeds Market Revenue (Million) Forecast, by Application 2020 & 2033
- Table 110: South Africa Seeds Market Volume (Kiloton) Forecast, by Application 2020 & 2033
- Table 111: Rest of Middle East & Africa Seeds Market Revenue (Million) Forecast, by Application 2020 & 2033
- Table 112: Rest of Middle East & Africa Seeds Market Volume (Kiloton) Forecast, by Application 2020 & 2033
- Table 113: Global Seeds Market Revenue Million Forecast, by Breeding Technology 2020 & 2033
- Table 114: Global Seeds Market Volume Kiloton Forecast, by Breeding Technology 2020 & 2033
- Table 115: Global Seeds Market Revenue Million Forecast, by Cultivation Mechanism 2020 & 2033
- Table 116: Global Seeds Market Volume Kiloton Forecast, by Cultivation Mechanism 2020 & 2033
- Table 117: Global Seeds Market Revenue Million Forecast, by Crop Type 2020 & 2033
- Table 118: Global Seeds Market Volume Kiloton Forecast, by Crop Type 2020 & 2033
- Table 119: Global Seeds Market Revenue Million Forecast, by Breeding Technology 2020 & 2033
- Table 120: Global Seeds Market Volume Kiloton Forecast, by Breeding Technology 2020 & 2033
- Table 121: Global Seeds Market Revenue Million Forecast, by Cultivation Mechanism 2020 & 2033
- Table 122: Global Seeds Market Volume Kiloton Forecast, by Cultivation Mechanism 2020 & 2033
- Table 123: Global Seeds Market Revenue Million Forecast, by Crop Type 2020 & 2033
- Table 124: Global Seeds Market Volume Kiloton Forecast, by Crop Type 2020 & 2033
- Table 125: Global Seeds Market Revenue Million Forecast, by Country 2020 & 2033
- Table 126: Global Seeds Market Volume Kiloton Forecast, by Country 2020 & 2033
- Table 127: China Seeds Market Revenue (Million) Forecast, by Application 2020 & 2033
- Table 128: China Seeds Market Volume (Kiloton) Forecast, by Application 2020 & 2033
- Table 129: India Seeds Market Revenue (Million) Forecast, by Application 2020 & 2033
- Table 130: India Seeds Market Volume (Kiloton) Forecast, by Application 2020 & 2033
- Table 131: Japan Seeds Market Revenue (Million) Forecast, by Application 2020 & 2033
- Table 132: Japan Seeds Market Volume (Kiloton) Forecast, by Application 2020 & 2033
- Table 133: South Korea Seeds Market Revenue (Million) Forecast, by Application 2020 & 2033
- Table 134: South Korea Seeds Market Volume (Kiloton) Forecast, by Application 2020 & 2033
- Table 135: ASEAN Seeds Market Revenue (Million) Forecast, by Application 2020 & 2033
- Table 136: ASEAN Seeds Market Volume (Kiloton) Forecast, by Application 2020 & 2033
- Table 137: Oceania Seeds Market Revenue (Million) Forecast, by Application 2020 & 2033
- Table 138: Oceania Seeds Market Volume (Kiloton) Forecast, by Application 2020 & 2033
- Table 139: Rest of Asia Pacific Seeds Market Revenue (Million) Forecast, by Application 2020 & 2033
- Table 140: Rest of Asia Pacific Seeds Market Volume (Kiloton) Forecast, by Application 2020 & 2033
Frequently Asked Questions
1. What is the projected Compound Annual Growth Rate (CAGR) of the Seeds Market?
The projected CAGR is approximately 4.70%.
2. Which companies are prominent players in the Seeds Market?
Key companies in the market include Sakata Seeds Corporation, Groupe Limagrain, Rijk Zwaan Zaadteelt en Zaadhandel BV, DLF, Bayer AG, KWS SAAT SE & Co KGaA, Advanta Seeds - UPL, Syngenta Grou, Corteva Agriscience, BASF SE.
3. What are the main segments of the Seeds Market?
The market segments include Breeding Technology, Cultivation Mechanism, Crop Type, Breeding Technology, Cultivation Mechanism, Crop Type.
4. Can you provide details about the market size?
The market size is estimated to be USD XX Million as of 2022.
5. What are some drivers contributing to market growth?
Seed Treatment As A Solution To Enhance Yield; Growing Awareness For Seed Treatment Among The Farmers; Rising Trend Of Organic Farming.
6. What are the notable trends driving market growth?
OTHER KEY INDUSTRY TRENDS COVERED IN THE REPORT.
7. Are there any restraints impacting market growth?
Limitations Across Farm-Level Seed Treatment; Rising Environmental Concerns.
8. Can you provide examples of recent developments in the market?
August 2023: Bayer AG launched the herbicide-tolerant biotech corn Dekalb DK95R in Banggo village, Manggalewa district, Dompu Regency, West Nusa Tenggara, Indonesia.July 2023: Syngenta launched a new hybrid winter barley with tolerance to barley yellowing virus (BYDV) and higher yield.July 2023: BASF expanded its Xitavo soybean seed portfolio with the addition of its 11 new high-yielding varieties for the 2024 growing season, featuring the Enlist E3 technology to combat difficult weeds.
9. What pricing options are available for accessing the report?
Pricing options include single-user, multi-user, and enterprise licenses priced at USD 3800, USD 4500, and USD 5800 respectively.
10. Is the market size provided in terms of value or volume?
The market size is provided in terms of value, measured in Million and volume, measured in Kiloton.
11. Are there any specific market keywords associated with the report?
Yes, the market keyword associated with the report is "Seeds Market," which aids in identifying and referencing the specific market segment covered.
12. How do I determine which pricing option suits my needs best?
The pricing options vary based on user requirements and access needs. Individual users may opt for single-user licenses, while businesses requiring broader access may choose multi-user or enterprise licenses for cost-effective access to the report.
13. Are there any additional resources or data provided in the Seeds Market report?
While the report offers comprehensive insights, it's advisable to review the specific contents or supplementary materials provided to ascertain if additional resources or data are available.
14. How can I stay updated on further developments or reports in the Seeds Market?
To stay informed about further developments, trends, and reports in the Seeds Market, consider subscribing to industry newsletters, following relevant companies and organizations, or regularly checking reputable industry news sources and publications.
Methodology
Step 1 - Identification of Relevant Samples Size from Population Database


Step 2 - Approaches for Defining Global Market Size (Value, Volume* & Price*)

Note*: In applicable scenarios
Step 3 - Data Sources
Primary Research
- Web Analytics
- Survey Reports
- Research Institute
- Latest Research Reports
- Opinion Leaders
Secondary Research
- Annual Reports
- White Paper
- Latest Press Release
- Industry Association
- Paid Database
- Investor Presentations

Step 4 - Data Triangulation
Involves using different sources of information in order to increase the validity of a study
These sources are likely to be stakeholders in a program - participants, other researchers, program staff, other community members, and so on.
Then we put all data in single framework & apply various statistical tools to find out the dynamic on the market.
During the analysis stage, feedback from the stakeholder groups would be compared to determine areas of agreement as well as areas of divergence

