

Key Insights
The global Shoe Orthotics market is poised for significant expansion, projected to reach an estimated value of $2,300 million by 2025, with a robust Compound Annual Growth Rate (CAGR) of 7.5% anticipated through 2033. This upward trajectory is primarily fueled by a growing awareness among consumers regarding foot health and the increasing prevalence of chronic foot conditions such as plantar fasciitis, flat feet, and diabetic foot complications. The aging global population also contributes to market growth, as older individuals are more susceptible to foot-related issues requiring orthotic intervention. Furthermore, the rising participation in sports and athletic activities, coupled with a greater emphasis on performance enhancement and injury prevention, is driving demand for specialized orthotic solutions. Advancements in material science and manufacturing technologies are leading to the development of more comfortable, durable, and customized orthotic devices, enhancing their appeal and effectiveness. The medical segment, in particular, is expected to witness substantial growth due to the therapeutic benefits of orthotics in managing a range of musculoskeletal disorders and improving mobility.
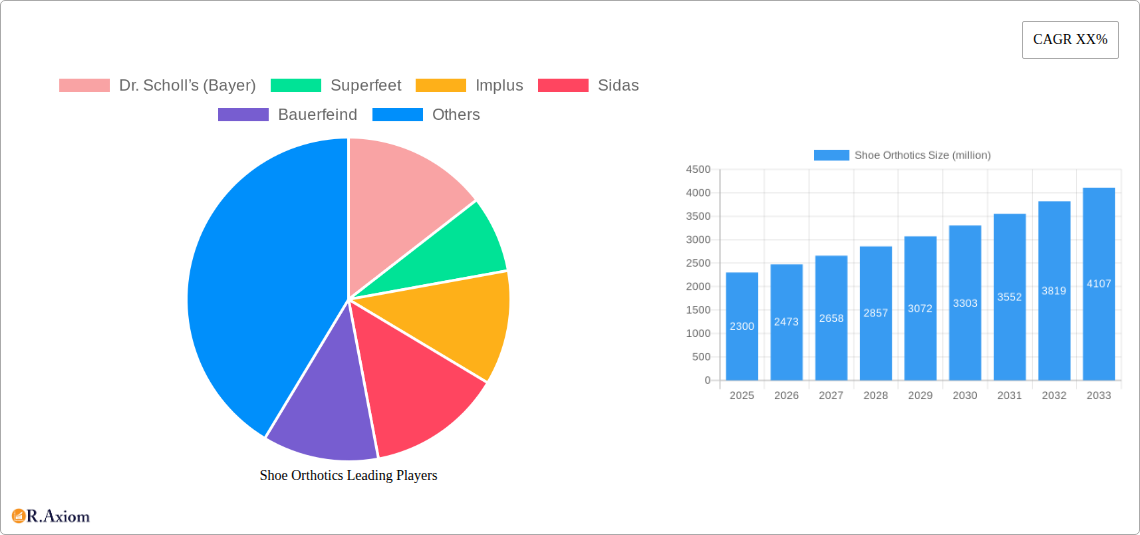
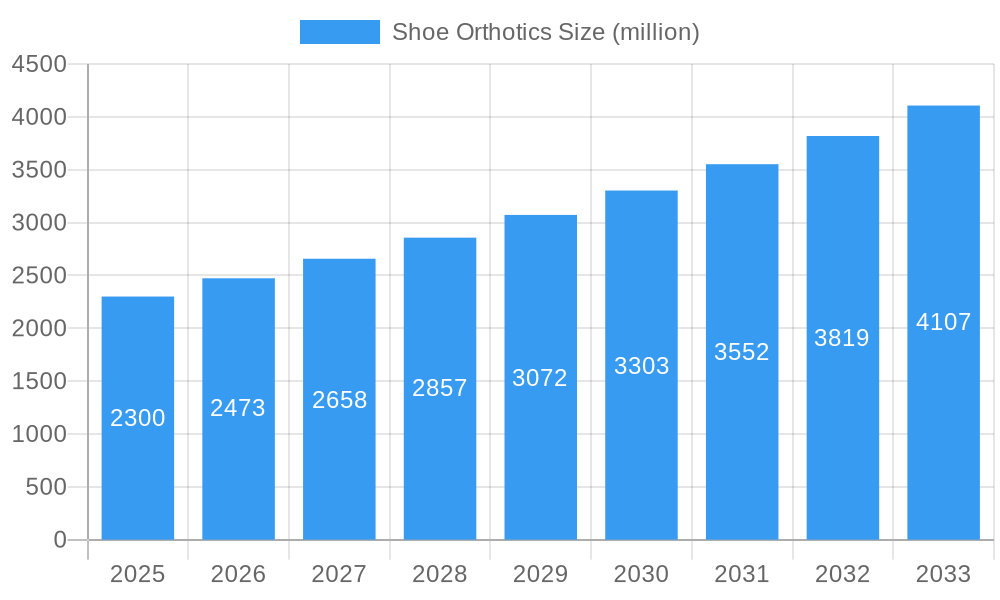
Shoe Orthotics Market Size (In Billion)
The market's expansion is further supported by the increasing adoption of orthotic solutions across various applications, including sports and medical settings. Rigid orthotics, offering superior structural support for severe conditions, and soft orthotics, prioritizing comfort and cushioning, cater to a diverse range of consumer needs. Key players such as Dr. Scholl’s (Bayer), Superfeet, and Bauerfeind are actively investing in research and development to innovate their product portfolios and expand their market reach. Strategic collaborations and mergers are also shaping the competitive landscape, with companies aiming to leverage each other's expertise and distribution networks. While the market demonstrates strong growth potential, certain restraints, such as the high cost of customized orthotics and limited insurance coverage in some regions, could pose challenges. However, the continuous drive towards affordable and accessible orthotic solutions, along with the growing preference for over-the-counter options, is expected to mitigate these concerns, ensuring sustained market prosperity.
Shoe Orthotics Company Market Share
Shoe Orthotics Market Concentration & Innovation
The global shoe orthotics market exhibits moderate concentration, with a significant portion of the market share held by a few prominent players. Dr. Scholl’s (Bayer) currently commands an estimated market share of 18%, followed by Superfeet at 12%, and Implus with 9%. Innovation is a key differentiator, driven by advancements in materials science and 3D printing technology, enabling the creation of highly customized and effective orthotic solutions. Regulatory frameworks, particularly in the medical application segment, play a crucial role in product development and market access, ensuring safety and efficacy. The threat of product substitutes, such as specialized footwear and therapeutic massages, is present but largely mitigated by the specific biomechanical support offered by orthotics. End-user trends are shifting towards proactive foot health management and performance enhancement, particularly within the sports segment. Mergers and acquisitions (M&A) activities are present, with significant M&A deal values estimated at over $500 million in the historical period, indicating strategic consolidation and investment in promising technologies. Key companies actively involved include Sidas, Bauerfeind, Aetrex Worldwide, Powerstep, Footbalance Systems, and Comfortfit Labs, each contributing to the evolving landscape through proprietary technologies and strategic partnerships.
Shoe Orthotics Industry Trends & Insights
The global shoe orthotics market is poised for robust expansion, driven by a confluence of increasing health consciousness, a growing prevalence of foot-related ailments, and significant technological advancements. The market is projected to witness a Compound Annual Growth Rate (CAGR) of approximately 7.2% during the forecast period of 2025–2033, with the market size expected to reach an estimated value of over $7,000 million by 2033. A primary growth driver is the escalating awareness among consumers regarding the importance of foot health and its direct impact on overall well-being and athletic performance. This heightened awareness is further fueled by an aging global population, which is more susceptible to conditions like plantar fasciitis, arthritis, and diabetes, all of which benefit from the corrective and supportive properties of shoe orthotics.
Technological disruptions are revolutionizing the industry. The integration of 3D scanning and printing technologies has paved the way for highly personalized orthotics, precisely tailored to individual foot anatomy and biomechanics. This level of customization not only enhances comfort and efficacy but also opens new avenues for product development and market penetration. Furthermore, advancements in materials science have led to the development of lighter, more durable, and more comfortable orthotic materials, improving user experience and compliance.
Consumer preferences are evolving, with a growing demand for both therapeutic and performance-enhancing orthotic solutions. The sports segment, in particular, is witnessing a surge in demand as athletes of all levels recognize the role of orthotics in injury prevention, pain management, and performance optimization. This trend is supported by increased participation in sports and fitness activities globally. The medical segment continues to be a significant contributor, driven by prescriptions from healthcare professionals for treating conditions like flat feet, overpronation, and heel spurs. The "Others" segment, encompassing lifestyle and general comfort, is also gaining traction as individuals prioritize foot comfort in their daily lives.
The competitive landscape is characterized by intense innovation and strategic collaborations. Companies are investing heavily in research and development to differentiate their product offerings and capture market share. The market penetration of advanced orthotic solutions is increasing as awareness and accessibility improve. While established players maintain a strong presence, new entrants with innovative technologies are continuously challenging the status quo. The interplay between technological innovation, evolving consumer demands, and the increasing focus on preventative healthcare is shaping a dynamic and growth-oriented future for the shoe orthotics market.
Dominant Markets & Segments in Shoe Orthotics
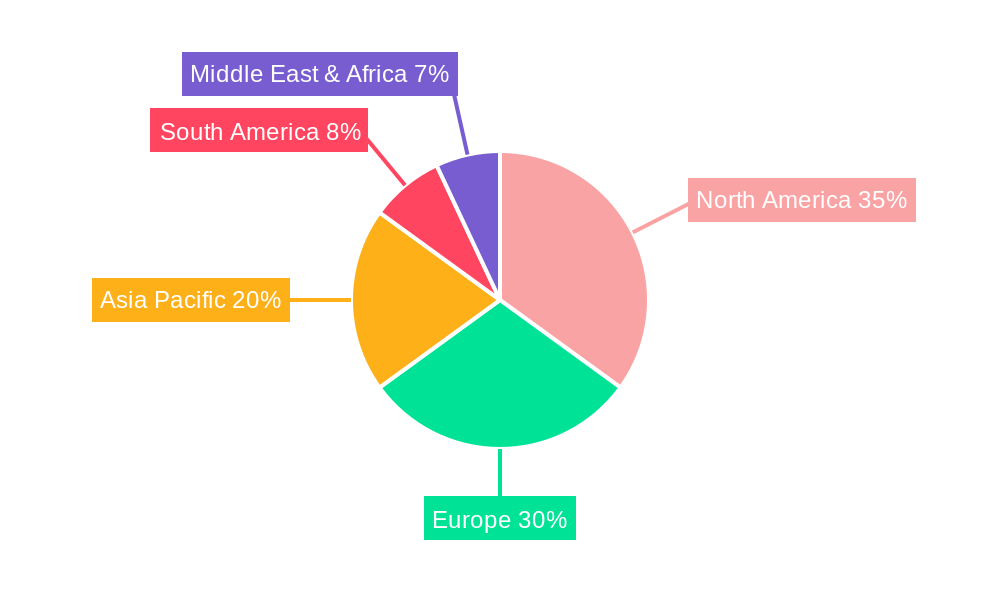
The global shoe orthotics market's dominance is multifaceted, with distinct regional, country, and segment leadership. Geographically, North America currently represents the largest market, driven by high disposable incomes, a strong emphasis on health and wellness, and a well-established healthcare infrastructure that facilitates access to advanced orthotic solutions. The United States, in particular, is a powerhouse, accounting for an estimated 40% of the global market revenue. Factors contributing to this dominance include a high prevalence of foot-related disorders, robust insurance coverage for medical devices, and a proactive consumer base that readily adopts innovative health products. Economic policies that support healthcare innovation and consumer spending, coupled with extensive distribution networks of podiatrists, orthopedic specialists, and sports medicine clinics, further solidify North America's leading position.
Within the major segments, the Medical application of shoe orthotics holds a commanding position. This dominance is attributed to the widespread use of orthotics in managing chronic foot conditions, post-operative care, and rehabilitation. The segment benefits from an aging population experiencing an increased incidence of conditions like diabetic neuropathy, osteoarthritis, and plantar fasciitis, all of which necessitate specialized foot support. Strong clinical evidence supporting the efficacy of orthotics in pain reduction and functional improvement further drives demand within the medical sphere. Regulatory approvals and reimbursement policies from healthcare providers also play a pivotal role in the sustained growth and dominance of the medical application.
Concurrently, the Rigid Orthotics type segment demonstrates significant leadership. These orthotics, typically constructed from firmer materials like plastic or carbon fiber, offer superior structural support and control for biomechanical issues such as severe pronation or supination. Their effectiveness in correcting complex foot deformities and providing substantial relief from debilitating pain makes them a preferred choice for a considerable portion of the patient population seeking advanced therapeutic solutions. The demand for rigid orthotics is intrinsically linked to the medical segment's performance, as they are frequently prescribed for conditions requiring precise alignment and support.
The Sports application segment is experiencing rapid growth and is projected to gain significant market share in the coming years. This surge is fueled by increasing global participation in athletic activities, a growing awareness among athletes about the role of orthotics in performance enhancement and injury prevention, and advancements in lightweight, durable materials tailored for high-impact activities. The rise of specialized sports footwear, often designed to accommodate custom or semi-custom orthotics, further amplifies this trend.
The Others segment, encompassing lifestyle and everyday comfort applications, is also expanding steadily. As individuals increasingly prioritize foot health and comfort in their daily routines, the demand for insoles that alleviate general foot fatigue, cushioning, and support for prolonged standing or walking is on the rise. This segment is driven by the broad consumer market seeking to improve their quality of life through better foot care.
While rigid orthotics currently lead, Soft Orthotics, made from cushioning materials like foam or gel, are witnessing a substantial increase in demand due to their comfort-centric benefits and widespread use for general foot pain and fatigue. The interplay between these segments, driven by evolving consumer needs and technological advancements, will continue to shape the future landscape of the shoe orthotics market.
Shoe Orthotics Product Developments
Recent product developments in the shoe orthotics market are characterized by an increased focus on personalization, advanced materials, and integration with digital technologies. Companies are leveraging 3D scanning and printing to create custom-fit orthotics that precisely match individual foot anatomy and biomechanics, offering unparalleled comfort and therapeutic efficacy. Innovations in materials science have led to the introduction of lighter, more breathable, and highly resilient orthotics, enhancing durability and user experience. Furthermore, the development of smart orthotics, incorporating sensors to track gait patterns and pressure distribution, signifies a move towards data-driven foot health management and performance optimization, providing valuable insights for both users and healthcare professionals.
Report Scope & Segmentation Analysis
This comprehensive market research report provides an in-depth analysis of the global shoe orthotics market, segmented by Application (Sports, Medical, Others) and Type (Rigid Orthotics, Soft Orthotics). The study period encompasses 2019–2033, with a base year of 2025, and includes historical data from 2019–2024 and a forecast period of 2025–2033.
The Sports segment is expected to exhibit a significant CAGR of approximately 8.5%, driven by increasing athletic participation and the demand for performance-enhancing and injury-prevention solutions. Market size in this segment is projected to reach over $2,500 million by 2033.
The Medical segment, currently the largest, is anticipated to grow at a steady CAGR of around 6.8%, propelled by the rising prevalence of foot-related ailments and an aging global population. Its market size is projected to exceed $3,800 million by 2033.
The Others segment, encompassing lifestyle and general comfort applications, is forecast to grow at a CAGR of approximately 7.0%, driven by increasing consumer awareness and the demand for everyday foot comfort. This segment is expected to reach over $700 million by 2033.
In terms of types, Rigid Orthotics are expected to maintain their dominance with a CAGR of around 7.5%, driven by their efficacy in treating complex biomechanical issues. The market size is projected to surpass $4,500 million by 2033.
Soft Orthotics are anticipated to witness a robust CAGR of approximately 8.0%, fueled by their comfort-centric benefits and growing popularity for general foot pain relief. This segment is projected to reach over $2,500 million by 2033.
Key Drivers of Shoe Orthotics Growth
Several key factors are propelling the growth of the shoe orthotics market. The rising global prevalence of foot and lower limb disorders, such as plantar fasciitis, diabetes-related foot complications, and sports injuries, creates a sustained demand for corrective and supportive insoles. Technological advancements, particularly in 3D scanning, additive manufacturing (3D printing), and advanced material science, are enabling the development of highly customized, comfortable, and effective orthotic solutions, significantly enhancing their appeal and efficacy. Furthermore, increasing consumer awareness regarding the importance of foot health for overall well-being and athletic performance is a critical driver, leading to proactive adoption of orthotic products. The growing aging population also contributes significantly, as older individuals are more prone to degenerative foot conditions requiring specialized support.
Challenges in the Shoe Orthotics Sector
Despite strong growth prospects, the shoe orthotics sector faces several challenges. Regulatory hurdles and the stringent approval processes for medical-grade orthotics, particularly in new markets, can slow down product launches and market penetration. The high cost associated with customized orthotics and advanced technologies can limit accessibility for a segment of the population, especially in developing economies. Intense competition from both established brands and emerging players, coupled with the threat of lower-cost, generic insoles, puts pressure on pricing and market share. Supply chain disruptions, raw material price volatility, and the need for skilled labor in manufacturing and fitting can also pose significant operational challenges.
Emerging Opportunities in Shoe Orthotics
The shoe orthotics market is ripe with emerging opportunities. The growing demand for personalized and custom-fit orthotics, driven by advancements in 3D scanning and printing technologies, presents a significant avenue for growth. The expanding sports and fitness sector globally, coupled with a rising awareness among athletes and fitness enthusiasts about the benefits of orthotics for performance enhancement and injury prevention, offers substantial market potential. The increasing prevalence of lifestyle-related foot issues due to sedentary work patterns and prolonged standing also fuels demand for comfortable and supportive insoles. Furthermore, the integration of digital health technologies, such as wearable sensors and mobile applications for gait analysis and remote monitoring, opens doors for innovative product development and service offerings, creating a data-driven approach to foot care.
Leading Players in the Shoe Orthotics Market
- Dr. Scholl’s (Bayer)
- Superfeet
- Implus
- Sidas
- Bauerfeind
- Aetrex Worldwide
- Powerstep
- Footbalance Systems
- Comfortfit Labs
Key Developments in Shoe Orthotics Industry
- 2023 September: Superfeet launches a new line of eco-friendly insoles made from recycled materials, addressing growing consumer demand for sustainable products.
- 2023 August: Bauerfeind introduces a novel 3D printing technology for creating ultra-lightweight and highly breathable custom orthotics, enhancing patient comfort and treatment outcomes.
- 2023 April: Implus acquires a leading distributor of athletic and orthopedic insoles, expanding its market reach and product portfolio.
- 2022 December: Aetrex Worldwide unveils a new AI-powered gait analysis system for podiatrists, enabling more precise orthotic prescription and personalized patient care.
- 2022 October: Sidas develops a proprietary foam technology that offers superior shock absorption and energy return for athletes, improving performance and reducing fatigue.
- 2022 June: Powerstep introduces an innovative range of orthotics designed for specific sports activities, catering to the specialized needs of runners, hikers, and cyclists.
- 2022 March: Footbalance System expands its global presence with new flagship stores in key European markets, offering in-store custom orthotic fitting services.
- 2021 November: Comfortfit Labs partners with a major footwear manufacturer to integrate their custom orthotic technology directly into athletic shoe designs.
Strategic Outlook for Shoe Orthotics Market
The strategic outlook for the shoe orthotics market is highly optimistic, driven by a confluence of sustained demand for therapeutic solutions and the burgeoning interest in performance enhancement. The increasing integration of advanced digital technologies, such as AI-driven gait analysis and 3D printing, will continue to be a key growth catalyst, enabling hyper-personalization and improved patient outcomes. The market is poised for further consolidation and strategic alliances as companies seek to expand their technological capabilities and market reach. The growing emphasis on preventative healthcare and the proactive management of foot health by consumers worldwide will underpin long-term market expansion, making shoe orthotics an increasingly vital component of both medical treatment and active lifestyles.
Shoe Orthotics Segmentation
-
1. Application
- 1.1. Sports
- 1.2. Medical
- 1.3. Others
-
2. Types
- 2.1. Rigid Orthotics
- 2.2. Soft Orthotics
Shoe Orthotics Segmentation By Geography
-
1. North America
- 1.1. United States
- 1.2. Canada
- 1.3. Mexico
-
2. South America
- 2.1. Brazil
- 2.2. Argentina
- 2.3. Rest of South America
-
3. Europe
- 3.1. United Kingdom
- 3.2. Germany
- 3.3. France
- 3.4. Italy
- 3.5. Spain
- 3.6. Russia
- 3.7. Benelux
- 3.8. Nordics
- 3.9. Rest of Europe
-
4. Middle East & Africa
- 4.1. Turkey
- 4.2. Israel
- 4.3. GCC
- 4.4. North Africa
- 4.5. South Africa
- 4.6. Rest of Middle East & Africa
-
5. Asia Pacific
- 5.1. China
- 5.2. India
- 5.3. Japan
- 5.4. South Korea
- 5.5. ASEAN
- 5.6. Oceania
- 5.7. Rest of Asia Pacific
Shoe Orthotics Regional Market Share
Geographic Coverage of Shoe Orthotics
Shoe Orthotics REPORT HIGHLIGHTS
| Aspects | Details |
|---|---|
| Study Period | 2020-2034 |
| Base Year | 2025 |
| Estimated Year | 2026 |
| Forecast Period | 2026-2034 |
| Historical Period | 2020-2025 |
| Growth Rate | CAGR of XX% from 2020-2034 |
| Segmentation |
|
Table of Contents
- 1. Introduction
- 1.1. Research Scope
- 1.2. Market Segmentation
- 1.3. Research Objective
- 1.4. Definitions and Assumptions
- 2. Executive Summary
- 2.1. Market Snapshot
- 3. Market Dynamics
- 3.1. Market Drivers
- 3.2. Market Restrains
- 3.3. Market Trends
- 3.4. Market Opportunities
- 4. Market Factor Analysis
- 4.1. Porters Five Forces
- 4.1.1. Bargaining Power of Suppliers
- 4.1.2. Bargaining Power of Buyers
- 4.1.3. Threat of New Entrants
- 4.1.4. Threat of Substitutes
- 4.1.5. Competitive Rivalry
- 4.2. PESTEL analysis
- 4.3. BCG Analysis
- 4.3.1. Stars (High Growth, High Market Share)
- 4.3.2. Cash Cows (Low Growth, High Market Share)
- 4.3.3. Question Mark (High Growth, Low Market Share)
- 4.3.4. Dogs (Low Growth, Low Market Share)
- 4.4. Ansoff Matrix Analysis
- 4.5. Supply Chain Analysis
- 4.6. Regulatory Landscape
- 4.7. Current Market Potential and Opportunity Assessment (TAM–SAM–SOM Framework)
- 4.8. RAX Analyst Note
- 4.1. Porters Five Forces
- 5. Market Analysis, Insights and Forecast 2021-2033
- 5.1. Market Analysis, Insights and Forecast - by Application
- 5.1.1. Sports
- 5.1.2. Medical
- 5.1.3. Others
- 5.2. Market Analysis, Insights and Forecast - by Types
- 5.2.1. Rigid Orthotics
- 5.2.2. Soft Orthotics
- 5.3. Market Analysis, Insights and Forecast - by Region
- 5.3.1. North America
- 5.3.2. South America
- 5.3.3. Europe
- 5.3.4. Middle East & Africa
- 5.3.5. Asia Pacific
- 5.1. Market Analysis, Insights and Forecast - by Application
- 6. Global Shoe Orthotics Analysis, Insights and Forecast, 2021-2033
- 6.1. Market Analysis, Insights and Forecast - by Application
- 6.1.1. Sports
- 6.1.2. Medical
- 6.1.3. Others
- 6.2. Market Analysis, Insights and Forecast - by Types
- 6.2.1. Rigid Orthotics
- 6.2.2. Soft Orthotics
- 6.1. Market Analysis, Insights and Forecast - by Application
- 7. North America Shoe Orthotics Analysis, Insights and Forecast, 2020-2032
- 7.1. Market Analysis, Insights and Forecast - by Application
- 7.1.1. Sports
- 7.1.2. Medical
- 7.1.3. Others
- 7.2. Market Analysis, Insights and Forecast - by Types
- 7.2.1. Rigid Orthotics
- 7.2.2. Soft Orthotics
- 7.1. Market Analysis, Insights and Forecast - by Application
- 8. South America Shoe Orthotics Analysis, Insights and Forecast, 2020-2032
- 8.1. Market Analysis, Insights and Forecast - by Application
- 8.1.1. Sports
- 8.1.2. Medical
- 8.1.3. Others
- 8.2. Market Analysis, Insights and Forecast - by Types
- 8.2.1. Rigid Orthotics
- 8.2.2. Soft Orthotics
- 8.1. Market Analysis, Insights and Forecast - by Application
- 9. Europe Shoe Orthotics Analysis, Insights and Forecast, 2020-2032
- 9.1. Market Analysis, Insights and Forecast - by Application
- 9.1.1. Sports
- 9.1.2. Medical
- 9.1.3. Others
- 9.2. Market Analysis, Insights and Forecast - by Types
- 9.2.1. Rigid Orthotics
- 9.2.2. Soft Orthotics
- 9.1. Market Analysis, Insights and Forecast - by Application
- 10. Middle East & Africa Shoe Orthotics Analysis, Insights and Forecast, 2020-2032
- 10.1. Market Analysis, Insights and Forecast - by Application
- 10.1.1. Sports
- 10.1.2. Medical
- 10.1.3. Others
- 10.2. Market Analysis, Insights and Forecast - by Types
- 10.2.1. Rigid Orthotics
- 10.2.2. Soft Orthotics
- 10.1. Market Analysis, Insights and Forecast - by Application
- 11. Asia Pacific Shoe Orthotics Analysis, Insights and Forecast, 2020-2032
- 11.1. Market Analysis, Insights and Forecast - by Application
- 11.1.1. Sports
- 11.1.2. Medical
- 11.1.3. Others
- 11.2. Market Analysis, Insights and Forecast - by Types
- 11.2.1. Rigid Orthotics
- 11.2.2. Soft Orthotics
- 11.1. Market Analysis, Insights and Forecast - by Application
- 12. Competitive Analysis
- 12.1. Company Profiles
- 12.1.1 Dr. Scholl’s (Bayer)
- 12.1.1.1. Company Overview
- 12.1.1.2. Products
- 12.1.1.3. Company Financials
- 12.1.1.4. SWOT Analysis
- 12.1.2 Superfeet
- 12.1.2.1. Company Overview
- 12.1.2.2. Products
- 12.1.2.3. Company Financials
- 12.1.2.4. SWOT Analysis
- 12.1.3 Implus
- 12.1.3.1. Company Overview
- 12.1.3.2. Products
- 12.1.3.3. Company Financials
- 12.1.3.4. SWOT Analysis
- 12.1.4 Sidas
- 12.1.4.1. Company Overview
- 12.1.4.2. Products
- 12.1.4.3. Company Financials
- 12.1.4.4. SWOT Analysis
- 12.1.5 Bauerfeind
- 12.1.5.1. Company Overview
- 12.1.5.2. Products
- 12.1.5.3. Company Financials
- 12.1.5.4. SWOT Analysis
- 12.1.6 Aetrex Worldwide
- 12.1.6.1. Company Overview
- 12.1.6.2. Products
- 12.1.6.3. Company Financials
- 12.1.6.4. SWOT Analysis
- 12.1.7 Powerstep
- 12.1.7.1. Company Overview
- 12.1.7.2. Products
- 12.1.7.3. Company Financials
- 12.1.7.4. SWOT Analysis
- 12.1.8 Footbalance Systems
- 12.1.8.1. Company Overview
- 12.1.8.2. Products
- 12.1.8.3. Company Financials
- 12.1.8.4. SWOT Analysis
- 12.1.9 Comfortfit Labs
- 12.1.9.1. Company Overview
- 12.1.9.2. Products
- 12.1.9.3. Company Financials
- 12.1.9.4. SWOT Analysis
- 12.1.1 Dr. Scholl’s (Bayer)
- 12.2. Market Entropy
- 12.2.1 Company's Key Areas Served
- 12.2.2 Recent Developments
- 12.3. Company Market Share Analysis 2025
- 12.3.1 Top 5 Companies Market Share Analysis
- 12.3.2 Top 3 Companies Market Share Analysis
- 12.4. List of Potential Customers
- 13. Research Methodology
List of Figures
- Figure 1: Global Shoe Orthotics Revenue Breakdown (million, %) by Region 2025 & 2033
- Figure 2: Global Shoe Orthotics Volume Breakdown (K, %) by Region 2025 & 2033
- Figure 3: North America Shoe Orthotics Revenue (million), by Application 2025 & 2033
- Figure 4: North America Shoe Orthotics Volume (K), by Application 2025 & 2033
- Figure 5: North America Shoe Orthotics Revenue Share (%), by Application 2025 & 2033
- Figure 6: North America Shoe Orthotics Volume Share (%), by Application 2025 & 2033
- Figure 7: North America Shoe Orthotics Revenue (million), by Types 2025 & 2033
- Figure 8: North America Shoe Orthotics Volume (K), by Types 2025 & 2033
- Figure 9: North America Shoe Orthotics Revenue Share (%), by Types 2025 & 2033
- Figure 10: North America Shoe Orthotics Volume Share (%), by Types 2025 & 2033
- Figure 11: North America Shoe Orthotics Revenue (million), by Country 2025 & 2033
- Figure 12: North America Shoe Orthotics Volume (K), by Country 2025 & 2033
- Figure 13: North America Shoe Orthotics Revenue Share (%), by Country 2025 & 2033
- Figure 14: North America Shoe Orthotics Volume Share (%), by Country 2025 & 2033
- Figure 15: South America Shoe Orthotics Revenue (million), by Application 2025 & 2033
- Figure 16: South America Shoe Orthotics Volume (K), by Application 2025 & 2033
- Figure 17: South America Shoe Orthotics Revenue Share (%), by Application 2025 & 2033
- Figure 18: South America Shoe Orthotics Volume Share (%), by Application 2025 & 2033
- Figure 19: South America Shoe Orthotics Revenue (million), by Types 2025 & 2033
- Figure 20: South America Shoe Orthotics Volume (K), by Types 2025 & 2033
- Figure 21: South America Shoe Orthotics Revenue Share (%), by Types 2025 & 2033
- Figure 22: South America Shoe Orthotics Volume Share (%), by Types 2025 & 2033
- Figure 23: South America Shoe Orthotics Revenue (million), by Country 2025 & 2033
- Figure 24: South America Shoe Orthotics Volume (K), by Country 2025 & 2033
- Figure 25: South America Shoe Orthotics Revenue Share (%), by Country 2025 & 2033
- Figure 26: South America Shoe Orthotics Volume Share (%), by Country 2025 & 2033
- Figure 27: Europe Shoe Orthotics Revenue (million), by Application 2025 & 2033
- Figure 28: Europe Shoe Orthotics Volume (K), by Application 2025 & 2033
- Figure 29: Europe Shoe Orthotics Revenue Share (%), by Application 2025 & 2033
- Figure 30: Europe Shoe Orthotics Volume Share (%), by Application 2025 & 2033
- Figure 31: Europe Shoe Orthotics Revenue (million), by Types 2025 & 2033
- Figure 32: Europe Shoe Orthotics Volume (K), by Types 2025 & 2033
- Figure 33: Europe Shoe Orthotics Revenue Share (%), by Types 2025 & 2033
- Figure 34: Europe Shoe Orthotics Volume Share (%), by Types 2025 & 2033
- Figure 35: Europe Shoe Orthotics Revenue (million), by Country 2025 & 2033
- Figure 36: Europe Shoe Orthotics Volume (K), by Country 2025 & 2033
- Figure 37: Europe Shoe Orthotics Revenue Share (%), by Country 2025 & 2033
- Figure 38: Europe Shoe Orthotics Volume Share (%), by Country 2025 & 2033
- Figure 39: Middle East & Africa Shoe Orthotics Revenue (million), by Application 2025 & 2033
- Figure 40: Middle East & Africa Shoe Orthotics Volume (K), by Application 2025 & 2033
- Figure 41: Middle East & Africa Shoe Orthotics Revenue Share (%), by Application 2025 & 2033
- Figure 42: Middle East & Africa Shoe Orthotics Volume Share (%), by Application 2025 & 2033
- Figure 43: Middle East & Africa Shoe Orthotics Revenue (million), by Types 2025 & 2033
- Figure 44: Middle East & Africa Shoe Orthotics Volume (K), by Types 2025 & 2033
- Figure 45: Middle East & Africa Shoe Orthotics Revenue Share (%), by Types 2025 & 2033
- Figure 46: Middle East & Africa Shoe Orthotics Volume Share (%), by Types 2025 & 2033
- Figure 47: Middle East & Africa Shoe Orthotics Revenue (million), by Country 2025 & 2033
- Figure 48: Middle East & Africa Shoe Orthotics Volume (K), by Country 2025 & 2033
- Figure 49: Middle East & Africa Shoe Orthotics Revenue Share (%), by Country 2025 & 2033
- Figure 50: Middle East & Africa Shoe Orthotics Volume Share (%), by Country 2025 & 2033
- Figure 51: Asia Pacific Shoe Orthotics Revenue (million), by Application 2025 & 2033
- Figure 52: Asia Pacific Shoe Orthotics Volume (K), by Application 2025 & 2033
- Figure 53: Asia Pacific Shoe Orthotics Revenue Share (%), by Application 2025 & 2033
- Figure 54: Asia Pacific Shoe Orthotics Volume Share (%), by Application 2025 & 2033
- Figure 55: Asia Pacific Shoe Orthotics Revenue (million), by Types 2025 & 2033
- Figure 56: Asia Pacific Shoe Orthotics Volume (K), by Types 2025 & 2033
- Figure 57: Asia Pacific Shoe Orthotics Revenue Share (%), by Types 2025 & 2033
- Figure 58: Asia Pacific Shoe Orthotics Volume Share (%), by Types 2025 & 2033
- Figure 59: Asia Pacific Shoe Orthotics Revenue (million), by Country 2025 & 2033
- Figure 60: Asia Pacific Shoe Orthotics Volume (K), by Country 2025 & 2033
- Figure 61: Asia Pacific Shoe Orthotics Revenue Share (%), by Country 2025 & 2033
- Figure 62: Asia Pacific Shoe Orthotics Volume Share (%), by Country 2025 & 2033
List of Tables
- Table 1: Global Shoe Orthotics Revenue million Forecast, by Application 2020 & 2033
- Table 2: Global Shoe Orthotics Volume K Forecast, by Application 2020 & 2033
- Table 3: Global Shoe Orthotics Revenue million Forecast, by Types 2020 & 2033
- Table 4: Global Shoe Orthotics Volume K Forecast, by Types 2020 & 2033
- Table 5: Global Shoe Orthotics Revenue million Forecast, by Region 2020 & 2033
- Table 6: Global Shoe Orthotics Volume K Forecast, by Region 2020 & 2033
- Table 7: Global Shoe Orthotics Revenue million Forecast, by Application 2020 & 2033
- Table 8: Global Shoe Orthotics Volume K Forecast, by Application 2020 & 2033
- Table 9: Global Shoe Orthotics Revenue million Forecast, by Types 2020 & 2033
- Table 10: Global Shoe Orthotics Volume K Forecast, by Types 2020 & 2033
- Table 11: Global Shoe Orthotics Revenue million Forecast, by Country 2020 & 2033
- Table 12: Global Shoe Orthotics Volume K Forecast, by Country 2020 & 2033
- Table 13: United States Shoe Orthotics Revenue (million) Forecast, by Application 2020 & 2033
- Table 14: United States Shoe Orthotics Volume (K) Forecast, by Application 2020 & 2033
- Table 15: Canada Shoe Orthotics Revenue (million) Forecast, by Application 2020 & 2033
- Table 16: Canada Shoe Orthotics Volume (K) Forecast, by Application 2020 & 2033
- Table 17: Mexico Shoe Orthotics Revenue (million) Forecast, by Application 2020 & 2033
- Table 18: Mexico Shoe Orthotics Volume (K) Forecast, by Application 2020 & 2033
- Table 19: Global Shoe Orthotics Revenue million Forecast, by Application 2020 & 2033
- Table 20: Global Shoe Orthotics Volume K Forecast, by Application 2020 & 2033
- Table 21: Global Shoe Orthotics Revenue million Forecast, by Types 2020 & 2033
- Table 22: Global Shoe Orthotics Volume K Forecast, by Types 2020 & 2033
- Table 23: Global Shoe Orthotics Revenue million Forecast, by Country 2020 & 2033
- Table 24: Global Shoe Orthotics Volume K Forecast, by Country 2020 & 2033
- Table 25: Brazil Shoe Orthotics Revenue (million) Forecast, by Application 2020 & 2033
- Table 26: Brazil Shoe Orthotics Volume (K) Forecast, by Application 2020 & 2033
- Table 27: Argentina Shoe Orthotics Revenue (million) Forecast, by Application 2020 & 2033
- Table 28: Argentina Shoe Orthotics Volume (K) Forecast, by Application 2020 & 2033
- Table 29: Rest of South America Shoe Orthotics Revenue (million) Forecast, by Application 2020 & 2033
- Table 30: Rest of South America Shoe Orthotics Volume (K) Forecast, by Application 2020 & 2033
- Table 31: Global Shoe Orthotics Revenue million Forecast, by Application 2020 & 2033
- Table 32: Global Shoe Orthotics Volume K Forecast, by Application 2020 & 2033
- Table 33: Global Shoe Orthotics Revenue million Forecast, by Types 2020 & 2033
- Table 34: Global Shoe Orthotics Volume K Forecast, by Types 2020 & 2033
- Table 35: Global Shoe Orthotics Revenue million Forecast, by Country 2020 & 2033
- Table 36: Global Shoe Orthotics Volume K Forecast, by Country 2020 & 2033
- Table 37: United Kingdom Shoe Orthotics Revenue (million) Forecast, by Application 2020 & 2033
- Table 38: United Kingdom Shoe Orthotics Volume (K) Forecast, by Application 2020 & 2033
- Table 39: Germany Shoe Orthotics Revenue (million) Forecast, by Application 2020 & 2033
- Table 40: Germany Shoe Orthotics Volume (K) Forecast, by Application 2020 & 2033
- Table 41: France Shoe Orthotics Revenue (million) Forecast, by Application 2020 & 2033
- Table 42: France Shoe Orthotics Volume (K) Forecast, by Application 2020 & 2033
- Table 43: Italy Shoe Orthotics Revenue (million) Forecast, by Application 2020 & 2033
- Table 44: Italy Shoe Orthotics Volume (K) Forecast, by Application 2020 & 2033
- Table 45: Spain Shoe Orthotics Revenue (million) Forecast, by Application 2020 & 2033
- Table 46: Spain Shoe Orthotics Volume (K) Forecast, by Application 2020 & 2033
- Table 47: Russia Shoe Orthotics Revenue (million) Forecast, by Application 2020 & 2033
- Table 48: Russia Shoe Orthotics Volume (K) Forecast, by Application 2020 & 2033
- Table 49: Benelux Shoe Orthotics Revenue (million) Forecast, by Application 2020 & 2033
- Table 50: Benelux Shoe Orthotics Volume (K) Forecast, by Application 2020 & 2033
- Table 51: Nordics Shoe Orthotics Revenue (million) Forecast, by Application 2020 & 2033
- Table 52: Nordics Shoe Orthotics Volume (K) Forecast, by Application 2020 & 2033
- Table 53: Rest of Europe Shoe Orthotics Revenue (million) Forecast, by Application 2020 & 2033
- Table 54: Rest of Europe Shoe Orthotics Volume (K) Forecast, by Application 2020 & 2033
- Table 55: Global Shoe Orthotics Revenue million Forecast, by Application 2020 & 2033
- Table 56: Global Shoe Orthotics Volume K Forecast, by Application 2020 & 2033
- Table 57: Global Shoe Orthotics Revenue million Forecast, by Types 2020 & 2033
- Table 58: Global Shoe Orthotics Volume K Forecast, by Types 2020 & 2033
- Table 59: Global Shoe Orthotics Revenue million Forecast, by Country 2020 & 2033
- Table 60: Global Shoe Orthotics Volume K Forecast, by Country 2020 & 2033
- Table 61: Turkey Shoe Orthotics Revenue (million) Forecast, by Application 2020 & 2033
- Table 62: Turkey Shoe Orthotics Volume (K) Forecast, by Application 2020 & 2033
- Table 63: Israel Shoe Orthotics Revenue (million) Forecast, by Application 2020 & 2033
- Table 64: Israel Shoe Orthotics Volume (K) Forecast, by Application 2020 & 2033
- Table 65: GCC Shoe Orthotics Revenue (million) Forecast, by Application 2020 & 2033
- Table 66: GCC Shoe Orthotics Volume (K) Forecast, by Application 2020 & 2033
- Table 67: North Africa Shoe Orthotics Revenue (million) Forecast, by Application 2020 & 2033
- Table 68: North Africa Shoe Orthotics Volume (K) Forecast, by Application 2020 & 2033
- Table 69: South Africa Shoe Orthotics Revenue (million) Forecast, by Application 2020 & 2033
- Table 70: South Africa Shoe Orthotics Volume (K) Forecast, by Application 2020 & 2033
- Table 71: Rest of Middle East & Africa Shoe Orthotics Revenue (million) Forecast, by Application 2020 & 2033
- Table 72: Rest of Middle East & Africa Shoe Orthotics Volume (K) Forecast, by Application 2020 & 2033
- Table 73: Global Shoe Orthotics Revenue million Forecast, by Application 2020 & 2033
- Table 74: Global Shoe Orthotics Volume K Forecast, by Application 2020 & 2033
- Table 75: Global Shoe Orthotics Revenue million Forecast, by Types 2020 & 2033
- Table 76: Global Shoe Orthotics Volume K Forecast, by Types 2020 & 2033
- Table 77: Global Shoe Orthotics Revenue million Forecast, by Country 2020 & 2033
- Table 78: Global Shoe Orthotics Volume K Forecast, by Country 2020 & 2033
- Table 79: China Shoe Orthotics Revenue (million) Forecast, by Application 2020 & 2033
- Table 80: China Shoe Orthotics Volume (K) Forecast, by Application 2020 & 2033
- Table 81: India Shoe Orthotics Revenue (million) Forecast, by Application 2020 & 2033
- Table 82: India Shoe Orthotics Volume (K) Forecast, by Application 2020 & 2033
- Table 83: Japan Shoe Orthotics Revenue (million) Forecast, by Application 2020 & 2033
- Table 84: Japan Shoe Orthotics Volume (K) Forecast, by Application 2020 & 2033
- Table 85: South Korea Shoe Orthotics Revenue (million) Forecast, by Application 2020 & 2033
- Table 86: South Korea Shoe Orthotics Volume (K) Forecast, by Application 2020 & 2033
- Table 87: ASEAN Shoe Orthotics Revenue (million) Forecast, by Application 2020 & 2033
- Table 88: ASEAN Shoe Orthotics Volume (K) Forecast, by Application 2020 & 2033
- Table 89: Oceania Shoe Orthotics Revenue (million) Forecast, by Application 2020 & 2033
- Table 90: Oceania Shoe Orthotics Volume (K) Forecast, by Application 2020 & 2033
- Table 91: Rest of Asia Pacific Shoe Orthotics Revenue (million) Forecast, by Application 2020 & 2033
- Table 92: Rest of Asia Pacific Shoe Orthotics Volume (K) Forecast, by Application 2020 & 2033
Frequently Asked Questions
1. What is the projected Compound Annual Growth Rate (CAGR) of the Shoe Orthotics?
The projected CAGR is approximately XX%.
2. Which companies are prominent players in the Shoe Orthotics?
Key companies in the market include Dr. Scholl’s (Bayer), Superfeet, Implus, Sidas, Bauerfeind, Aetrex Worldwide, Powerstep, Footbalance Systems, Comfortfit Labs.
3. What are the main segments of the Shoe Orthotics?
The market segments include Application, Types.
4. Can you provide details about the market size?
The market size is estimated to be USD XXX million as of 2022.
5. What are some drivers contributing to market growth?
N/A
6. What are the notable trends driving market growth?
N/A
7. Are there any restraints impacting market growth?
N/A
8. Can you provide examples of recent developments in the market?
N/A
9. What pricing options are available for accessing the report?
Pricing options include single-user, multi-user, and enterprise licenses priced at USD 3350.00, USD 5025.00, and USD 6700.00 respectively.
10. Is the market size provided in terms of value or volume?
The market size is provided in terms of value, measured in million and volume, measured in K.
11. Are there any specific market keywords associated with the report?
Yes, the market keyword associated with the report is "Shoe Orthotics," which aids in identifying and referencing the specific market segment covered.
12. How do I determine which pricing option suits my needs best?
The pricing options vary based on user requirements and access needs. Individual users may opt for single-user licenses, while businesses requiring broader access may choose multi-user or enterprise licenses for cost-effective access to the report.
13. Are there any additional resources or data provided in the Shoe Orthotics report?
While the report offers comprehensive insights, it's advisable to review the specific contents or supplementary materials provided to ascertain if additional resources or data are available.
14. How can I stay updated on further developments or reports in the Shoe Orthotics?
To stay informed about further developments, trends, and reports in the Shoe Orthotics, consider subscribing to industry newsletters, following relevant companies and organizations, or regularly checking reputable industry news sources and publications.
Methodology
Step 1 - Identification of Relevant Samples Size from Population Database


Step 2 - Approaches for Defining Global Market Size (Value, Volume* & Price*)

Note*: In applicable scenarios
Step 3 - Data Sources
Primary Research
- Web Analytics
- Survey Reports
- Research Institute
- Latest Research Reports
- Opinion Leaders
Secondary Research
- Annual Reports
- White Paper
- Latest Press Release
- Industry Association
- Paid Database
- Investor Presentations

Step 4 - Data Triangulation
Involves using different sources of information in order to increase the validity of a study
These sources are likely to be stakeholders in a program - participants, other researchers, program staff, other community members, and so on.
Then we put all data in single framework & apply various statistical tools to find out the dynamic on the market.
During the analysis stage, feedback from the stakeholder groups would be compared to determine areas of agreement as well as areas of divergence