

Key Insights
The global shoulder-fired missiles market, estimated at 13.81 billion in 2025, is poised for substantial growth, projecting a Compound Annual Growth Rate (CAGR) of 10.99% from 2025 to 2033. This expansion is primarily driven by escalating geopolitical instability and a consistent demand for agile, portable anti-tank and anti-aircraft weapon systems from both state and non-state entities. Advancements in guidance technologies, including sophisticated seeker integration and enhanced warhead capabilities, are significantly improving missile precision and efficacy, further stimulating market expansion. The market is segmented by range (short, medium, long), assembly type (projectile, launcher), and technology (guided, unguided). The guided missile segment is anticipated to lead due to its superior accuracy, with a growing demand for long-range capabilities expected. Key industry players such as Raytheon Technologies, Lockheed Martin, and MBDA are actively pursuing innovation and market penetration. Regional growth is expected to be robust in North America and Asia Pacific, fueled by substantial defense expenditures and technological innovation.
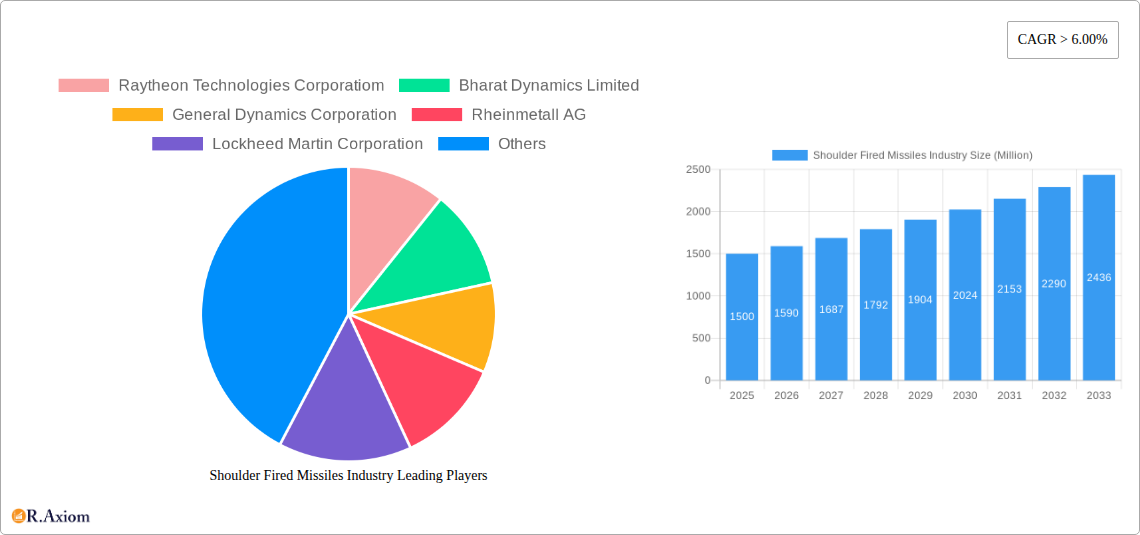
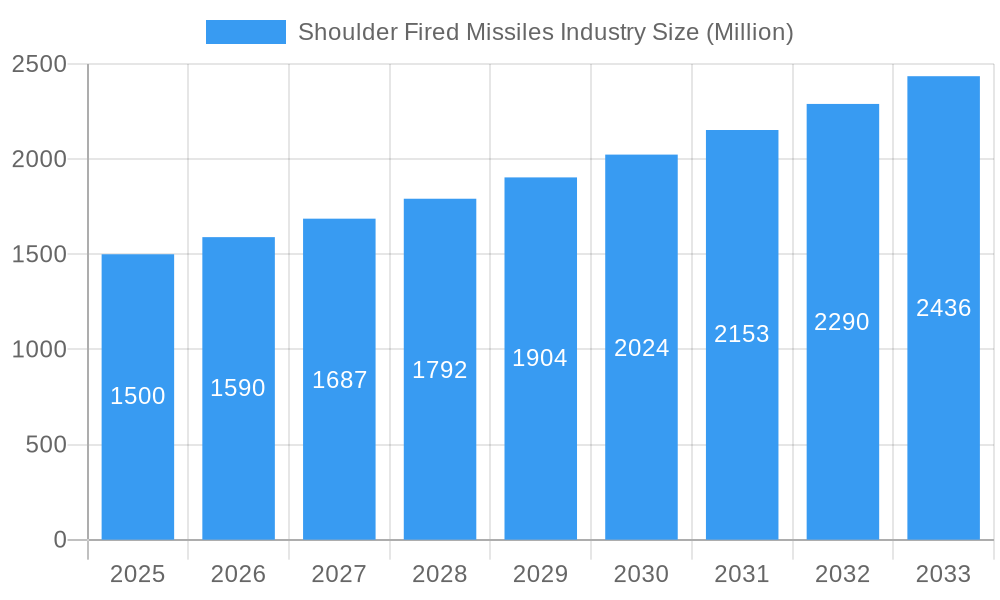
Shoulder Fired Missiles Industry Market Size (In Billion)
Conversely, the market encounters certain limitations, including substantial research and development costs and stringent regulatory frameworks governing production and deployment, which may impede market entry for smaller competitors. The proliferation of these weapons also poses significant security risks, leading to international control efforts that could impact market growth in specific regions. Nevertheless, the persistent need for effective, portable anti-tank and anti-aircraft defenses, coupled with ongoing technological enhancements, is expected to drive significant market expansion. The dynamic nature of modern warfare and the emergence of novel threats will also contribute to sustained demand. The future trajectory of this market will be significantly influenced by geopolitical developments, technological breakthroughs, and international regulatory landscapes.
Shoulder Fired Missiles Industry Company Market Share
Shoulder Fired Missiles Industry: A Comprehensive Market Analysis (2019-2033)
This in-depth report provides a comprehensive analysis of the global Shoulder Fired Missiles industry, offering invaluable insights for stakeholders, investors, and industry professionals. The study covers the period from 2019 to 2033, with 2025 serving as the base and estimated year. The report leverages rigorous data analysis and expert insights to forecast market trends and identify lucrative opportunities within this dynamic sector. The global market value is projected to reach xx Million by 2033, exhibiting a CAGR of xx% during the forecast period (2025-2033).
Shoulder Fired Missiles Industry Market Concentration & Innovation
The shoulder fired missiles industry exhibits a moderately concentrated market structure, with a few key players commanding significant market share. Raytheon Technologies Corporation, Lockheed Martin Corporation, and MBDA are among the leading players, collectively holding an estimated xx% market share in 2025. Innovation is a critical driver, with companies investing heavily in developing advanced guided missiles incorporating technologies like improved seeker heads, enhanced propulsion systems, and improved warheads. Regulatory frameworks, particularly export controls and international arms trade treaties, significantly impact market dynamics. The industry also faces competition from emerging technologies, such as directed energy weapons, which could pose a long-term threat to traditional missile systems. Mergers and acquisitions (M&A) are prevalent, with several significant deals valued at over xx Million recorded between 2019 and 2024. These M&A activities are driven by a need to expand product portfolios, access new technologies, and gain a competitive edge.
- Market Share (2025): Raytheon Technologies: xx%; Lockheed Martin: xx%; MBDA: xx%; Others: xx%
- M&A Activity (2019-2024): Total deal value exceeding xx Million.
Shoulder Fired Missiles Industry Industry Trends & Insights
The shoulder fired missiles market is experiencing robust growth fueled by increasing geopolitical instability, modernization of armed forces globally, and rising demand for lightweight, portable weaponry. Technological advancements, particularly in precision-guided munitions and improved seeker technologies, are driving market expansion and enhancing the effectiveness of these weapons. Consumer preferences are shifting towards more accurate, longer-range, and easily deployable systems. Competitive dynamics are intense, with leading manufacturers continuously striving to differentiate their products through technological superiority and cost-effectiveness. The market's growth is further spurred by increasing defense budgets in several regions, particularly in the Asia-Pacific and Middle East regions. The adoption of smart munitions and networked systems is expected to further fuel market growth.
Dominant Markets & Segments in Shoulder Fired Missiles Industry
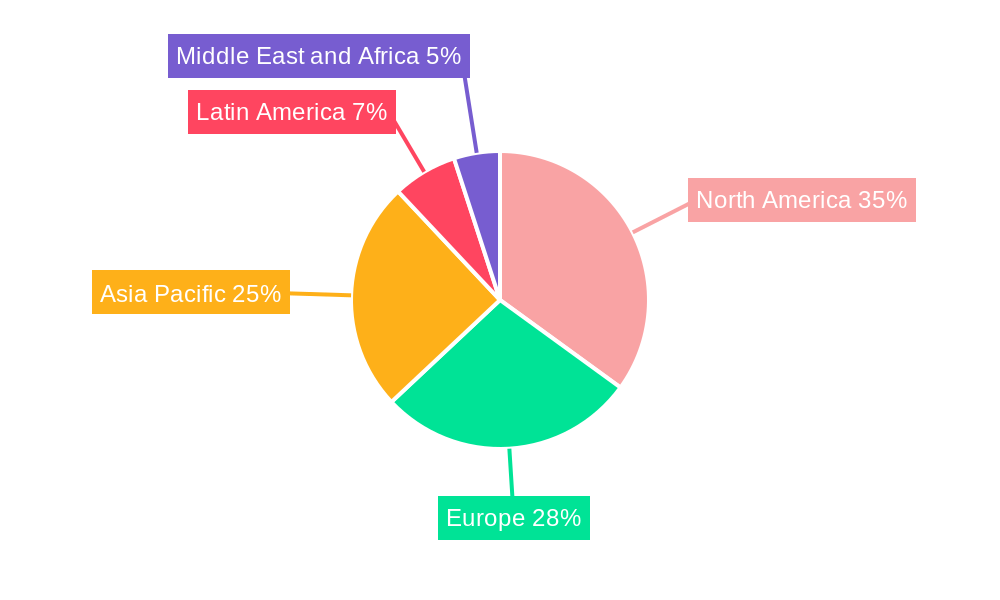
The North American region is currently the dominant market for shoulder-fired missiles, accounting for approximately xx% of global revenue in 2025. This dominance is attributed to strong defense spending, technologically advanced military forces, and the presence of major manufacturers. Within the segment breakdown:
- Range: The medium-range segment holds the largest market share, driven by its versatility and effectiveness in various combat scenarios.
- Assembly Type: The projectile segment dominates, due to cost-effectiveness and ease of production.
- Technology: Guided missiles constitute the majority of the market, reflecting the increasing preference for precision-guided weaponry.
Key Drivers:
- North America: High defense budgets, technological advancements, presence of major manufacturers.
- Europe: Strong military alliances, modernization programs, regional conflicts.
- Asia-Pacific: Rising defense spending, territorial disputes, modernization of armed forces.
Shoulder Fired Missiles Industry Product Developments
Recent product innovations focus on miniaturization, improved accuracy, enhanced lethality, and incorporation of advanced technologies like laser guidance and infrared seekers. These advancements are improving the effectiveness and range of shoulder-fired missiles, while also increasing their resistance to countermeasures. The market is witnessing a transition toward smarter, more adaptable missiles that can engage a wider range of targets.
Report Scope & Segmentation Analysis
This report segments the shoulder-fired missiles market based on range (short, medium, long), assembly type (projectile, launcher), and technology (guided, unguided). Each segment's growth trajectory, market size, and competitive landscape are comprehensively analyzed. For example, the guided missile segment is projected to experience significant growth due to increasing demand for precision-strike capabilities. Similarly, the medium-range segment is expected to maintain its dominant market share due to its versatility.
Key Drivers of Shoulder Fired Missiles Industry Growth
Several factors contribute to the growth of the shoulder-fired missiles industry. These include:
- Technological advancements: Improved guidance systems, warhead technology, and propulsion systems enhance the effectiveness of these weapons.
- Geopolitical instability: Regional conflicts and heightened tensions drive demand for portable, easily deployable weapons.
- Defense spending: Increased budgets allocated to defense modernization initiatives fuel the market's expansion.
Challenges in the Shoulder Fired Missiles Industry Sector
The shoulder-fired missiles industry faces several challenges. These include:
- Stringent regulations: International arms control treaties and export controls restrict the trade and distribution of these weapons.
- Supply chain disruptions: Global events can impact the availability of critical components, impacting production.
- Competitive pressures: Intense competition among manufacturers necessitates continuous innovation and cost optimization.
Emerging Opportunities in Shoulder Fired Missiles Industry
Emerging opportunities exist in several areas:
- Development of advanced seeker technologies: Next-generation seekers will improve targeting and accuracy, expanding market potential.
- Integration with unmanned aerial vehicles (UAVs): Combining shoulder-fired missiles with UAVs offers tactical advantages.
- Expansion into emerging markets: Increased defense spending in developing countries creates new market opportunities.
Leading Players in the Shoulder Fired Missiles Industry Market
- Raytheon Technologies Corporation
- Bharat Dynamics Limited
- General Dynamics Corporation
- Rheinmetall AG
- Lockheed Martin Corporation
- MBDA
- Rafael Advanced Defense Systems Ltd
- AirTronic USA LL
- BAE Systems plc
- Saab AB
- ROKETSAN
Key Developments in Shoulder Fired Missiles Industry Industry
- 2023-Q4: Raytheon Technologies announced the successful testing of a new guided missile with enhanced precision capabilities.
- 2022-Q3: MBDA secured a major contract for the supply of shoulder-fired missiles to a Middle Eastern country.
- 2021-Q2: Lockheed Martin unveiled a new lightweight shoulder-fired missile designed for urban combat.
Strategic Outlook for Shoulder Fired Missiles Industry Market
The future of the shoulder-fired missiles market looks promising, driven by continuous technological advancements, increasing defense budgets, and ongoing geopolitical instability. The focus on precision-guided munitions and the integration of these weapons with UAVs will significantly shape market growth in the coming years. Companies that invest in research and development, and those that successfully navigate regulatory hurdles, are likely to gain a significant competitive advantage.
Shoulder Fired Missiles Industry Segmentation
- 1. Production Analysis
- 2. Consumption Analysis
- 3. Import Market Analysis (Value & Volume)
- 4. Export Market Analysis (Value & Volume)
- 5. Price Trend Analysis
Shoulder Fired Missiles Industry Segmentation By Geography
-
1. North America
- 1.1. United States
- 1.2. Canada
- 1.3. Mexico
-
2. South America
- 2.1. Brazil
- 2.2. Argentina
- 2.3. Rest of South America
-
3. Europe
- 3.1. United Kingdom
- 3.2. Germany
- 3.3. France
- 3.4. Italy
- 3.5. Spain
- 3.6. Russia
- 3.7. Benelux
- 3.8. Nordics
- 3.9. Rest of Europe
-
4. Middle East & Africa
- 4.1. Turkey
- 4.2. Israel
- 4.3. GCC
- 4.4. North Africa
- 4.5. South Africa
- 4.6. Rest of Middle East & Africa
-
5. Asia Pacific
- 5.1. China
- 5.2. India
- 5.3. Japan
- 5.4. South Korea
- 5.5. ASEAN
- 5.6. Oceania
- 5.7. Rest of Asia Pacific
Shoulder Fired Missiles Industry Regional Market Share
Geographic Coverage of Shoulder Fired Missiles Industry
Shoulder Fired Missiles Industry REPORT HIGHLIGHTS
| Aspects | Details |
|---|---|
| Study Period | 2020-2034 |
| Base Year | 2025 |
| Estimated Year | 2026 |
| Forecast Period | 2026-2034 |
| Historical Period | 2020-2025 |
| Growth Rate | CAGR of 10.9899999999999% from 2020-2034 |
| Segmentation |
|
Table of Contents
- 1. Introduction
- 1.1. Research Scope
- 1.2. Market Segmentation
- 1.3. Research Objective
- 1.4. Definitions and Assumptions
- 2. Executive Summary
- 2.1. Market Snapshot
- 3. Market Dynamics
- 3.1. Market Drivers
- 3.2. Market Restrains
- 3.3. Market Trends
- 3.4. Market Opportunities
- 4. Market Factor Analysis
- 4.1. Porters Five Forces
- 4.1.1. Bargaining Power of Suppliers
- 4.1.2. Bargaining Power of Buyers
- 4.1.3. Threat of New Entrants
- 4.1.4. Threat of Substitutes
- 4.1.5. Competitive Rivalry
- 4.2. PESTEL analysis
- 4.3. BCG Analysis
- 4.3.1. Stars (High Growth, High Market Share)
- 4.3.2. Cash Cows (Low Growth, High Market Share)
- 4.3.3. Question Mark (High Growth, Low Market Share)
- 4.3.4. Dogs (Low Growth, Low Market Share)
- 4.4. Ansoff Matrix Analysis
- 4.5. Supply Chain Analysis
- 4.6. Regulatory Landscape
- 4.7. Current Market Potential and Opportunity Assessment (TAM–SAM–SOM Framework)
- 4.8. RAX Analyst Note
- 4.1. Porters Five Forces
- 5. Market Analysis, Insights and Forecast 2021-2033
- 5.1. Market Analysis, Insights and Forecast - by Production Analysis
- 5.2. Market Analysis, Insights and Forecast - by Consumption Analysis
- 5.3. Market Analysis, Insights and Forecast - by Import Market Analysis (Value & Volume)
- 5.4. Market Analysis, Insights and Forecast - by Export Market Analysis (Value & Volume)
- 5.5. Market Analysis, Insights and Forecast - by Price Trend Analysis
- 5.6. Market Analysis, Insights and Forecast - by Region
- 5.6.1. North America
- 5.6.2. South America
- 5.6.3. Europe
- 5.6.4. Middle East & Africa
- 5.6.5. Asia Pacific
- 6. Global Shoulder Fired Missiles Industry Analysis, Insights and Forecast, 2021-2033
- 6.1. Market Analysis, Insights and Forecast - by Production Analysis
- 6.2. Market Analysis, Insights and Forecast - by Consumption Analysis
- 6.3. Market Analysis, Insights and Forecast - by Import Market Analysis (Value & Volume)
- 6.4. Market Analysis, Insights and Forecast - by Export Market Analysis (Value & Volume)
- 6.5. Market Analysis, Insights and Forecast - by Price Trend Analysis
- 7. North America Shoulder Fired Missiles Industry Analysis, Insights and Forecast, 2020-2032
- 7.1. Market Analysis, Insights and Forecast - by Production Analysis
- 7.2. Market Analysis, Insights and Forecast - by Consumption Analysis
- 7.3. Market Analysis, Insights and Forecast - by Import Market Analysis (Value & Volume)
- 7.4. Market Analysis, Insights and Forecast - by Export Market Analysis (Value & Volume)
- 7.5. Market Analysis, Insights and Forecast - by Price Trend Analysis
- 8. South America Shoulder Fired Missiles Industry Analysis, Insights and Forecast, 2020-2032
- 8.1. Market Analysis, Insights and Forecast - by Production Analysis
- 8.2. Market Analysis, Insights and Forecast - by Consumption Analysis
- 8.3. Market Analysis, Insights and Forecast - by Import Market Analysis (Value & Volume)
- 8.4. Market Analysis, Insights and Forecast - by Export Market Analysis (Value & Volume)
- 8.5. Market Analysis, Insights and Forecast - by Price Trend Analysis
- 9. Europe Shoulder Fired Missiles Industry Analysis, Insights and Forecast, 2020-2032
- 9.1. Market Analysis, Insights and Forecast - by Production Analysis
- 9.2. Market Analysis, Insights and Forecast - by Consumption Analysis
- 9.3. Market Analysis, Insights and Forecast - by Import Market Analysis (Value & Volume)
- 9.4. Market Analysis, Insights and Forecast - by Export Market Analysis (Value & Volume)
- 9.5. Market Analysis, Insights and Forecast - by Price Trend Analysis
- 10. Middle East & Africa Shoulder Fired Missiles Industry Analysis, Insights and Forecast, 2020-2032
- 10.1. Market Analysis, Insights and Forecast - by Production Analysis
- 10.2. Market Analysis, Insights and Forecast - by Consumption Analysis
- 10.3. Market Analysis, Insights and Forecast - by Import Market Analysis (Value & Volume)
- 10.4. Market Analysis, Insights and Forecast - by Export Market Analysis (Value & Volume)
- 10.5. Market Analysis, Insights and Forecast - by Price Trend Analysis
- 11. Asia Pacific Shoulder Fired Missiles Industry Analysis, Insights and Forecast, 2020-2032
- 11.1. Market Analysis, Insights and Forecast - by Production Analysis
- 11.2. Market Analysis, Insights and Forecast - by Consumption Analysis
- 11.3. Market Analysis, Insights and Forecast - by Import Market Analysis (Value & Volume)
- 11.4. Market Analysis, Insights and Forecast - by Export Market Analysis (Value & Volume)
- 11.5. Market Analysis, Insights and Forecast - by Price Trend Analysis
- 12. Competitive Analysis
- 12.1. Company Profiles
- 12.1.1 Raytheon Technologies Corporatiom
- 12.1.1.1. Company Overview
- 12.1.1.2. Products
- 12.1.1.3. Company Financials
- 12.1.1.4. SWOT Analysis
- 12.1.2 Bharat Dynamics Limited
- 12.1.2.1. Company Overview
- 12.1.2.2. Products
- 12.1.2.3. Company Financials
- 12.1.2.4. SWOT Analysis
- 12.1.3 General Dynamics Corporation
- 12.1.3.1. Company Overview
- 12.1.3.2. Products
- 12.1.3.3. Company Financials
- 12.1.3.4. SWOT Analysis
- 12.1.4 Rheinmetall AG
- 12.1.4.1. Company Overview
- 12.1.4.2. Products
- 12.1.4.3. Company Financials
- 12.1.4.4. SWOT Analysis
- 12.1.5 Lockheed Martin Corporation
- 12.1.5.1. Company Overview
- 12.1.5.2. Products
- 12.1.5.3. Company Financials
- 12.1.5.4. SWOT Analysis
- 12.1.6 MBDA
- 12.1.6.1. Company Overview
- 12.1.6.2. Products
- 12.1.6.3. Company Financials
- 12.1.6.4. SWOT Analysis
- 12.1.7 Rafael Advanced Defense Systems Ltd
- 12.1.7.1. Company Overview
- 12.1.7.2. Products
- 12.1.7.3. Company Financials
- 12.1.7.4. SWOT Analysis
- 12.1.8 AirTronic USA LL
- 12.1.8.1. Company Overview
- 12.1.8.2. Products
- 12.1.8.3. Company Financials
- 12.1.8.4. SWOT Analysis
- 12.1.9 BAE Systems plc
- 12.1.9.1. Company Overview
- 12.1.9.2. Products
- 12.1.9.3. Company Financials
- 12.1.9.4. SWOT Analysis
- 12.1.10 Saab AB
- 12.1.10.1. Company Overview
- 12.1.10.2. Products
- 12.1.10.3. Company Financials
- 12.1.10.4. SWOT Analysis
- 12.1.11 ROKETSAN
- 12.1.11.1. Company Overview
- 12.1.11.2. Products
- 12.1.11.3. Company Financials
- 12.1.11.4. SWOT Analysis
- 12.1.1 Raytheon Technologies Corporatiom
- 12.2. Market Entropy
- 12.2.1 Company's Key Areas Served
- 12.2.2 Recent Developments
- 12.3. Company Market Share Analysis 2025
- 12.3.1 Top 5 Companies Market Share Analysis
- 12.3.2 Top 3 Companies Market Share Analysis
- 12.4. List of Potential Customers
- 13. Research Methodology
List of Figures
- Figure 1: Global Shoulder Fired Missiles Industry Revenue Breakdown (billion, %) by Region 2025 & 2033
- Figure 2: North America Shoulder Fired Missiles Industry Revenue (billion), by Production Analysis 2025 & 2033
- Figure 3: North America Shoulder Fired Missiles Industry Revenue Share (%), by Production Analysis 2025 & 2033
- Figure 4: North America Shoulder Fired Missiles Industry Revenue (billion), by Consumption Analysis 2025 & 2033
- Figure 5: North America Shoulder Fired Missiles Industry Revenue Share (%), by Consumption Analysis 2025 & 2033
- Figure 6: North America Shoulder Fired Missiles Industry Revenue (billion), by Import Market Analysis (Value & Volume) 2025 & 2033
- Figure 7: North America Shoulder Fired Missiles Industry Revenue Share (%), by Import Market Analysis (Value & Volume) 2025 & 2033
- Figure 8: North America Shoulder Fired Missiles Industry Revenue (billion), by Export Market Analysis (Value & Volume) 2025 & 2033
- Figure 9: North America Shoulder Fired Missiles Industry Revenue Share (%), by Export Market Analysis (Value & Volume) 2025 & 2033
- Figure 10: North America Shoulder Fired Missiles Industry Revenue (billion), by Price Trend Analysis 2025 & 2033
- Figure 11: North America Shoulder Fired Missiles Industry Revenue Share (%), by Price Trend Analysis 2025 & 2033
- Figure 12: North America Shoulder Fired Missiles Industry Revenue (billion), by Country 2025 & 2033
- Figure 13: North America Shoulder Fired Missiles Industry Revenue Share (%), by Country 2025 & 2033
- Figure 14: South America Shoulder Fired Missiles Industry Revenue (billion), by Production Analysis 2025 & 2033
- Figure 15: South America Shoulder Fired Missiles Industry Revenue Share (%), by Production Analysis 2025 & 2033
- Figure 16: South America Shoulder Fired Missiles Industry Revenue (billion), by Consumption Analysis 2025 & 2033
- Figure 17: South America Shoulder Fired Missiles Industry Revenue Share (%), by Consumption Analysis 2025 & 2033
- Figure 18: South America Shoulder Fired Missiles Industry Revenue (billion), by Import Market Analysis (Value & Volume) 2025 & 2033
- Figure 19: South America Shoulder Fired Missiles Industry Revenue Share (%), by Import Market Analysis (Value & Volume) 2025 & 2033
- Figure 20: South America Shoulder Fired Missiles Industry Revenue (billion), by Export Market Analysis (Value & Volume) 2025 & 2033
- Figure 21: South America Shoulder Fired Missiles Industry Revenue Share (%), by Export Market Analysis (Value & Volume) 2025 & 2033
- Figure 22: South America Shoulder Fired Missiles Industry Revenue (billion), by Price Trend Analysis 2025 & 2033
- Figure 23: South America Shoulder Fired Missiles Industry Revenue Share (%), by Price Trend Analysis 2025 & 2033
- Figure 24: South America Shoulder Fired Missiles Industry Revenue (billion), by Country 2025 & 2033
- Figure 25: South America Shoulder Fired Missiles Industry Revenue Share (%), by Country 2025 & 2033
- Figure 26: Europe Shoulder Fired Missiles Industry Revenue (billion), by Production Analysis 2025 & 2033
- Figure 27: Europe Shoulder Fired Missiles Industry Revenue Share (%), by Production Analysis 2025 & 2033
- Figure 28: Europe Shoulder Fired Missiles Industry Revenue (billion), by Consumption Analysis 2025 & 2033
- Figure 29: Europe Shoulder Fired Missiles Industry Revenue Share (%), by Consumption Analysis 2025 & 2033
- Figure 30: Europe Shoulder Fired Missiles Industry Revenue (billion), by Import Market Analysis (Value & Volume) 2025 & 2033
- Figure 31: Europe Shoulder Fired Missiles Industry Revenue Share (%), by Import Market Analysis (Value & Volume) 2025 & 2033
- Figure 32: Europe Shoulder Fired Missiles Industry Revenue (billion), by Export Market Analysis (Value & Volume) 2025 & 2033
- Figure 33: Europe Shoulder Fired Missiles Industry Revenue Share (%), by Export Market Analysis (Value & Volume) 2025 & 2033
- Figure 34: Europe Shoulder Fired Missiles Industry Revenue (billion), by Price Trend Analysis 2025 & 2033
- Figure 35: Europe Shoulder Fired Missiles Industry Revenue Share (%), by Price Trend Analysis 2025 & 2033
- Figure 36: Europe Shoulder Fired Missiles Industry Revenue (billion), by Country 2025 & 2033
- Figure 37: Europe Shoulder Fired Missiles Industry Revenue Share (%), by Country 2025 & 2033
- Figure 38: Middle East & Africa Shoulder Fired Missiles Industry Revenue (billion), by Production Analysis 2025 & 2033
- Figure 39: Middle East & Africa Shoulder Fired Missiles Industry Revenue Share (%), by Production Analysis 2025 & 2033
- Figure 40: Middle East & Africa Shoulder Fired Missiles Industry Revenue (billion), by Consumption Analysis 2025 & 2033
- Figure 41: Middle East & Africa Shoulder Fired Missiles Industry Revenue Share (%), by Consumption Analysis 2025 & 2033
- Figure 42: Middle East & Africa Shoulder Fired Missiles Industry Revenue (billion), by Import Market Analysis (Value & Volume) 2025 & 2033
- Figure 43: Middle East & Africa Shoulder Fired Missiles Industry Revenue Share (%), by Import Market Analysis (Value & Volume) 2025 & 2033
- Figure 44: Middle East & Africa Shoulder Fired Missiles Industry Revenue (billion), by Export Market Analysis (Value & Volume) 2025 & 2033
- Figure 45: Middle East & Africa Shoulder Fired Missiles Industry Revenue Share (%), by Export Market Analysis (Value & Volume) 2025 & 2033
- Figure 46: Middle East & Africa Shoulder Fired Missiles Industry Revenue (billion), by Price Trend Analysis 2025 & 2033
- Figure 47: Middle East & Africa Shoulder Fired Missiles Industry Revenue Share (%), by Price Trend Analysis 2025 & 2033
- Figure 48: Middle East & Africa Shoulder Fired Missiles Industry Revenue (billion), by Country 2025 & 2033
- Figure 49: Middle East & Africa Shoulder Fired Missiles Industry Revenue Share (%), by Country 2025 & 2033
- Figure 50: Asia Pacific Shoulder Fired Missiles Industry Revenue (billion), by Production Analysis 2025 & 2033
- Figure 51: Asia Pacific Shoulder Fired Missiles Industry Revenue Share (%), by Production Analysis 2025 & 2033
- Figure 52: Asia Pacific Shoulder Fired Missiles Industry Revenue (billion), by Consumption Analysis 2025 & 2033
- Figure 53: Asia Pacific Shoulder Fired Missiles Industry Revenue Share (%), by Consumption Analysis 2025 & 2033
- Figure 54: Asia Pacific Shoulder Fired Missiles Industry Revenue (billion), by Import Market Analysis (Value & Volume) 2025 & 2033
- Figure 55: Asia Pacific Shoulder Fired Missiles Industry Revenue Share (%), by Import Market Analysis (Value & Volume) 2025 & 2033
- Figure 56: Asia Pacific Shoulder Fired Missiles Industry Revenue (billion), by Export Market Analysis (Value & Volume) 2025 & 2033
- Figure 57: Asia Pacific Shoulder Fired Missiles Industry Revenue Share (%), by Export Market Analysis (Value & Volume) 2025 & 2033
- Figure 58: Asia Pacific Shoulder Fired Missiles Industry Revenue (billion), by Price Trend Analysis 2025 & 2033
- Figure 59: Asia Pacific Shoulder Fired Missiles Industry Revenue Share (%), by Price Trend Analysis 2025 & 2033
- Figure 60: Asia Pacific Shoulder Fired Missiles Industry Revenue (billion), by Country 2025 & 2033
- Figure 61: Asia Pacific Shoulder Fired Missiles Industry Revenue Share (%), by Country 2025 & 2033
List of Tables
- Table 1: Global Shoulder Fired Missiles Industry Revenue billion Forecast, by Production Analysis 2020 & 2033
- Table 2: Global Shoulder Fired Missiles Industry Revenue billion Forecast, by Consumption Analysis 2020 & 2033
- Table 3: Global Shoulder Fired Missiles Industry Revenue billion Forecast, by Import Market Analysis (Value & Volume) 2020 & 2033
- Table 4: Global Shoulder Fired Missiles Industry Revenue billion Forecast, by Export Market Analysis (Value & Volume) 2020 & 2033
- Table 5: Global Shoulder Fired Missiles Industry Revenue billion Forecast, by Price Trend Analysis 2020 & 2033
- Table 6: Global Shoulder Fired Missiles Industry Revenue billion Forecast, by Region 2020 & 2033
- Table 7: Global Shoulder Fired Missiles Industry Revenue billion Forecast, by Production Analysis 2020 & 2033
- Table 8: Global Shoulder Fired Missiles Industry Revenue billion Forecast, by Consumption Analysis 2020 & 2033
- Table 9: Global Shoulder Fired Missiles Industry Revenue billion Forecast, by Import Market Analysis (Value & Volume) 2020 & 2033
- Table 10: Global Shoulder Fired Missiles Industry Revenue billion Forecast, by Export Market Analysis (Value & Volume) 2020 & 2033
- Table 11: Global Shoulder Fired Missiles Industry Revenue billion Forecast, by Price Trend Analysis 2020 & 2033
- Table 12: Global Shoulder Fired Missiles Industry Revenue billion Forecast, by Country 2020 & 2033
- Table 13: United States Shoulder Fired Missiles Industry Revenue (billion) Forecast, by Application 2020 & 2033
- Table 14: Canada Shoulder Fired Missiles Industry Revenue (billion) Forecast, by Application 2020 & 2033
- Table 15: Mexico Shoulder Fired Missiles Industry Revenue (billion) Forecast, by Application 2020 & 2033
- Table 16: Global Shoulder Fired Missiles Industry Revenue billion Forecast, by Production Analysis 2020 & 2033
- Table 17: Global Shoulder Fired Missiles Industry Revenue billion Forecast, by Consumption Analysis 2020 & 2033
- Table 18: Global Shoulder Fired Missiles Industry Revenue billion Forecast, by Import Market Analysis (Value & Volume) 2020 & 2033
- Table 19: Global Shoulder Fired Missiles Industry Revenue billion Forecast, by Export Market Analysis (Value & Volume) 2020 & 2033
- Table 20: Global Shoulder Fired Missiles Industry Revenue billion Forecast, by Price Trend Analysis 2020 & 2033
- Table 21: Global Shoulder Fired Missiles Industry Revenue billion Forecast, by Country 2020 & 2033
- Table 22: Brazil Shoulder Fired Missiles Industry Revenue (billion) Forecast, by Application 2020 & 2033
- Table 23: Argentina Shoulder Fired Missiles Industry Revenue (billion) Forecast, by Application 2020 & 2033
- Table 24: Rest of South America Shoulder Fired Missiles Industry Revenue (billion) Forecast, by Application 2020 & 2033
- Table 25: Global Shoulder Fired Missiles Industry Revenue billion Forecast, by Production Analysis 2020 & 2033
- Table 26: Global Shoulder Fired Missiles Industry Revenue billion Forecast, by Consumption Analysis 2020 & 2033
- Table 27: Global Shoulder Fired Missiles Industry Revenue billion Forecast, by Import Market Analysis (Value & Volume) 2020 & 2033
- Table 28: Global Shoulder Fired Missiles Industry Revenue billion Forecast, by Export Market Analysis (Value & Volume) 2020 & 2033
- Table 29: Global Shoulder Fired Missiles Industry Revenue billion Forecast, by Price Trend Analysis 2020 & 2033
- Table 30: Global Shoulder Fired Missiles Industry Revenue billion Forecast, by Country 2020 & 2033
- Table 31: United Kingdom Shoulder Fired Missiles Industry Revenue (billion) Forecast, by Application 2020 & 2033
- Table 32: Germany Shoulder Fired Missiles Industry Revenue (billion) Forecast, by Application 2020 & 2033
- Table 33: France Shoulder Fired Missiles Industry Revenue (billion) Forecast, by Application 2020 & 2033
- Table 34: Italy Shoulder Fired Missiles Industry Revenue (billion) Forecast, by Application 2020 & 2033
- Table 35: Spain Shoulder Fired Missiles Industry Revenue (billion) Forecast, by Application 2020 & 2033
- Table 36: Russia Shoulder Fired Missiles Industry Revenue (billion) Forecast, by Application 2020 & 2033
- Table 37: Benelux Shoulder Fired Missiles Industry Revenue (billion) Forecast, by Application 2020 & 2033
- Table 38: Nordics Shoulder Fired Missiles Industry Revenue (billion) Forecast, by Application 2020 & 2033
- Table 39: Rest of Europe Shoulder Fired Missiles Industry Revenue (billion) Forecast, by Application 2020 & 2033
- Table 40: Global Shoulder Fired Missiles Industry Revenue billion Forecast, by Production Analysis 2020 & 2033
- Table 41: Global Shoulder Fired Missiles Industry Revenue billion Forecast, by Consumption Analysis 2020 & 2033
- Table 42: Global Shoulder Fired Missiles Industry Revenue billion Forecast, by Import Market Analysis (Value & Volume) 2020 & 2033
- Table 43: Global Shoulder Fired Missiles Industry Revenue billion Forecast, by Export Market Analysis (Value & Volume) 2020 & 2033
- Table 44: Global Shoulder Fired Missiles Industry Revenue billion Forecast, by Price Trend Analysis 2020 & 2033
- Table 45: Global Shoulder Fired Missiles Industry Revenue billion Forecast, by Country 2020 & 2033
- Table 46: Turkey Shoulder Fired Missiles Industry Revenue (billion) Forecast, by Application 2020 & 2033
- Table 47: Israel Shoulder Fired Missiles Industry Revenue (billion) Forecast, by Application 2020 & 2033
- Table 48: GCC Shoulder Fired Missiles Industry Revenue (billion) Forecast, by Application 2020 & 2033
- Table 49: North Africa Shoulder Fired Missiles Industry Revenue (billion) Forecast, by Application 2020 & 2033
- Table 50: South Africa Shoulder Fired Missiles Industry Revenue (billion) Forecast, by Application 2020 & 2033
- Table 51: Rest of Middle East & Africa Shoulder Fired Missiles Industry Revenue (billion) Forecast, by Application 2020 & 2033
- Table 52: Global Shoulder Fired Missiles Industry Revenue billion Forecast, by Production Analysis 2020 & 2033
- Table 53: Global Shoulder Fired Missiles Industry Revenue billion Forecast, by Consumption Analysis 2020 & 2033
- Table 54: Global Shoulder Fired Missiles Industry Revenue billion Forecast, by Import Market Analysis (Value & Volume) 2020 & 2033
- Table 55: Global Shoulder Fired Missiles Industry Revenue billion Forecast, by Export Market Analysis (Value & Volume) 2020 & 2033
- Table 56: Global Shoulder Fired Missiles Industry Revenue billion Forecast, by Price Trend Analysis 2020 & 2033
- Table 57: Global Shoulder Fired Missiles Industry Revenue billion Forecast, by Country 2020 & 2033
- Table 58: China Shoulder Fired Missiles Industry Revenue (billion) Forecast, by Application 2020 & 2033
- Table 59: India Shoulder Fired Missiles Industry Revenue (billion) Forecast, by Application 2020 & 2033
- Table 60: Japan Shoulder Fired Missiles Industry Revenue (billion) Forecast, by Application 2020 & 2033
- Table 61: South Korea Shoulder Fired Missiles Industry Revenue (billion) Forecast, by Application 2020 & 2033
- Table 62: ASEAN Shoulder Fired Missiles Industry Revenue (billion) Forecast, by Application 2020 & 2033
- Table 63: Oceania Shoulder Fired Missiles Industry Revenue (billion) Forecast, by Application 2020 & 2033
- Table 64: Rest of Asia Pacific Shoulder Fired Missiles Industry Revenue (billion) Forecast, by Application 2020 & 2033
Frequently Asked Questions
1. What is the projected Compound Annual Growth Rate (CAGR) of the Shoulder Fired Missiles Industry?
The projected CAGR is approximately 10.9899999999999%.
2. Which companies are prominent players in the Shoulder Fired Missiles Industry?
Key companies in the market include Raytheon Technologies Corporatiom, Bharat Dynamics Limited, General Dynamics Corporation, Rheinmetall AG, Lockheed Martin Corporation, MBDA, Rafael Advanced Defense Systems Ltd, AirTronic USA LL, BAE Systems plc, Saab AB, ROKETSAN.
3. What are the main segments of the Shoulder Fired Missiles Industry?
The market segments include Production Analysis, Consumption Analysis, Import Market Analysis (Value & Volume), Export Market Analysis (Value & Volume), Price Trend Analysis.
4. Can you provide details about the market size?
The market size is estimated to be USD 13.81 billion as of 2022.
5. What are some drivers contributing to market growth?
; Increased Seaborne Threats And Ambiguous Maritime Security Policies; Increasing Adoption Of Security Technologies In Bric Countries.
6. What are the notable trends driving market growth?
Rise in the Demand for MANPATS and MANPADS.
7. Are there any restraints impacting market growth?
; High Risk Rate In Ungoverned Zones; Unstructured Security Standards And Technologies.
8. Can you provide examples of recent developments in the market?
N/A
9. What pricing options are available for accessing the report?
Pricing options include single-user, multi-user, and enterprise licenses priced at USD 4750, USD 5250, and USD 8750 respectively.
10. Is the market size provided in terms of value or volume?
The market size is provided in terms of value, measured in billion.
11. Are there any specific market keywords associated with the report?
Yes, the market keyword associated with the report is "Shoulder Fired Missiles Industry," which aids in identifying and referencing the specific market segment covered.
12. How do I determine which pricing option suits my needs best?
The pricing options vary based on user requirements and access needs. Individual users may opt for single-user licenses, while businesses requiring broader access may choose multi-user or enterprise licenses for cost-effective access to the report.
13. Are there any additional resources or data provided in the Shoulder Fired Missiles Industry report?
While the report offers comprehensive insights, it's advisable to review the specific contents or supplementary materials provided to ascertain if additional resources or data are available.
14. How can I stay updated on further developments or reports in the Shoulder Fired Missiles Industry?
To stay informed about further developments, trends, and reports in the Shoulder Fired Missiles Industry, consider subscribing to industry newsletters, following relevant companies and organizations, or regularly checking reputable industry news sources and publications.
Methodology
Step 1 - Identification of Relevant Samples Size from Population Database


Step 2 - Approaches for Defining Global Market Size (Value, Volume* & Price*)

Note*: In applicable scenarios
Step 3 - Data Sources
Primary Research
- Web Analytics
- Survey Reports
- Research Institute
- Latest Research Reports
- Opinion Leaders
Secondary Research
- Annual Reports
- White Paper
- Latest Press Release
- Industry Association
- Paid Database
- Investor Presentations

Step 4 - Data Triangulation
Involves using different sources of information in order to increase the validity of a study
These sources are likely to be stakeholders in a program - participants, other researchers, program staff, other community members, and so on.
Then we put all data in single framework & apply various statistical tools to find out the dynamic on the market.
During the analysis stage, feedback from the stakeholder groups would be compared to determine areas of agreement as well as areas of divergence