Key Insights
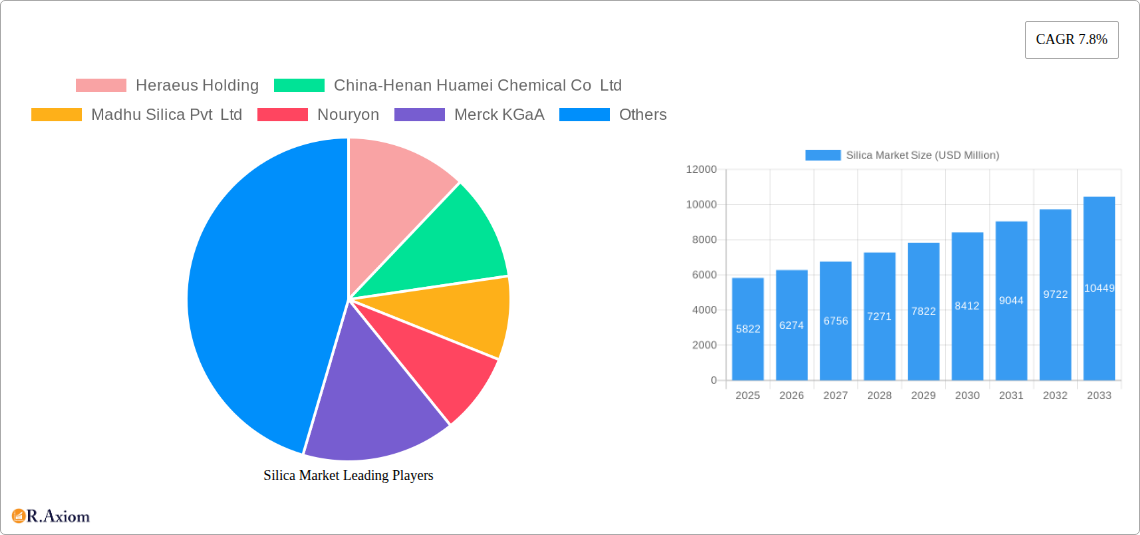
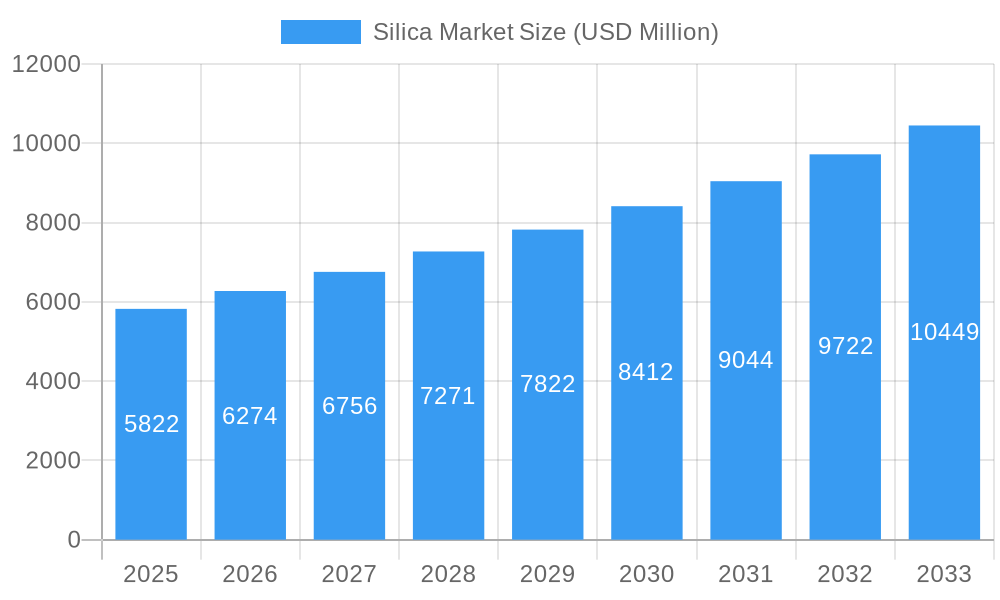
The global Silica Market is poised for robust expansion, projected to reach an estimated $5822 million in 2025, with a compelling Compound Annual Growth Rate (CAGR) of 7.8% through the forecast period ending in 2033. This significant growth is propelled by a confluence of factors, with the building and construction industry serving as a primary demand driver. The increasing use of silica in advanced construction materials, such as high-performance concrete and insulating glass, underpins this surge. Furthermore, the burgeoning demand from the shale oil and gas sector for proppants in hydraulic fracturing operations, coupled with the continuous evolution of glass manufacturing for diverse applications ranging from electronics to packaging, are substantial contributors to market expansion. The critical role of silica in water treatment processes for purification and filtration is also a consistent growth engine. Emerging trends include the development of novel silica-based nanomaterials with enhanced functionalities for specialized applications, as well as a growing emphasis on sustainable sourcing and production methods within the industry.
Silica Market Market Size (In Billion)
Despite the promising outlook, certain restraints could temper the market's trajectory. Fluctuations in raw material prices, particularly quartz and its derivatives, can impact profitability for manufacturers. Stringent environmental regulations concerning mining and processing operations in certain regions may also pose compliance challenges and increase operational costs. Additionally, the development of alternative materials for specific applications could present competitive pressures. However, the inherent versatility and cost-effectiveness of silica across a wide array of industrial applications are expected to largely mitigate these restraints, ensuring sustained market growth. The market is characterized by a diverse range of segments, including amorphous silica (pyrogenic/fumed and hydrated) and crystalline silica (quartz, tridymite, cristobalite), catering to specialized needs across various end-user industries.
Silica Market Company Market Share
This comprehensive report offers an in-depth analysis of the global Silica Market, projecting significant growth and evolving dynamics. The Silica Market is anticipated to witness substantial expansion driven by increasing demand across diverse end-user industries. Our study covers the Study Period: 2019–2033, with the Base Year: 2025, Estimated Year: 2025, and a robust Forecast Period: 2025–2033, building upon Historical Period: 2019–2024 data. This report is essential for stakeholders seeking to understand the Silica Market Size, Silica Market Share, and future trajectory of this vital industry.
Silica Market Market Concentration & Innovation
The Silica Market exhibits a moderate to high level of concentration, with key players strategically positioning themselves through innovation and strategic acquisitions. Companies are investing heavily in research and development to enhance the properties of silica for specialized applications, particularly in advanced materials and high-tech sectors. Regulatory frameworks, while generally supportive of industrial growth, focus on environmental sustainability and safety standards, influencing product development and manufacturing processes. Product substitutes exist, but the unique properties of silica, such as its inertness, high purity, and thermal resistance, make it indispensable in many applications. End-user trends, including the growing demand for lightweight and durable materials in the automotive and aerospace industries, as well as the need for high-performance components in electronics, are key innovation drivers. Mergers and acquisitions (M&A) are a significant aspect of market dynamics. For instance, Heraeus's acquisition of HS Advanced Materials Co. Ltd. in November 2021, valued in the tens of millions, exemplifies strategic consolidation aimed at expanding product portfolios and market reach within the semiconductor industry.
- Market Concentration: Moderate to High, driven by strategic M&A and R&D investments.
- Innovation Drivers: Demand for advanced materials, high-performance components in electronics, lightweight materials in automotive/aerospace.
- Regulatory Frameworks: Focus on environmental sustainability, safety standards.
- Product Substitutes: Limited for highly specialized applications due to silica's unique properties.
- End-User Trends: Electrification, miniaturization in electronics, sustainable construction materials.
- M&A Activities: Ongoing consolidation for portfolio expansion and market access.
Silica Market Industry Trends & Insights
The global Silica Market is on a robust growth trajectory, propelled by an array of compelling industry trends and technological advancements. The market is projected to achieve a Compound Annual Growth Rate (CAGR) of approximately 5.8% during the forecast period, with the estimated market size reaching over $15,000 million by 2025. This expansion is underpinned by the increasing adoption of silica in a multitude of applications, ranging from essential industrial processes to cutting-edge technological solutions. A significant growth driver is the escalating demand for high-purity amorphous silica, particularly fumed and precipitated silica, in sectors like coatings, adhesives, sealants, and elastomers (CASE), where they function as crucial rheology modifiers, reinforcing agents, and anti-caking agents. The building and construction industry continues to be a substantial consumer, utilizing silica in concrete, cement, and insulation materials to enhance strength, durability, and thermal performance, reflecting a growing market penetration of silica-based additives in sustainable construction practices.
Furthermore, the shale oil and gas industry’s sustained activity necessitates the use of specialized silica-based proppants for hydraulic fracturing, contributing significantly to market volume. Glass manufacturing, a traditional but enduring sector for silica, also exhibits steady growth, driven by demand in construction, automotive, and consumer electronics. The water treatment sector is another burgeoning area, with silica's adsorbent properties being leveraged for wastewater purification and industrial effluent treatment. Technological disruptions, such as advancements in silica synthesis techniques that yield tailored particle sizes and surface chemistries, are enabling novel applications and improving the performance of existing ones. Consumer preferences are increasingly leaning towards sustainable and high-performance products, which indirectly boosts the demand for silica as an essential component in eco-friendly materials and advanced manufacturing. The competitive dynamics within the Silica Market are characterized by intense R&D efforts, strategic collaborations, and a focus on cost optimization and supply chain resilience. Companies are continually innovating to develop silica grades with enhanced functionalities, such as improved dispersibility, higher surface area, and specific optical properties, thereby capturing niche markets and expanding their competitive edge.
Dominant Markets & Segments in Silica Market
The Silica Market is segmented by product type and end-user industry, with specific regions and segments demonstrating dominant growth and consumption.
Dominant Segments by Type:
Amorphous Silica: This category, encompassing Pyrogenic/Fumed and Hydrated silica, is poised for substantial growth.
- Pyrogenic/Fumed Silica: Its high purity, fine particle size, and large surface area make it indispensable in high-performance applications like advanced coatings, electronic components, and pharmaceuticals. Growth in these advanced sectors, particularly in regions with strong manufacturing bases like East Asia and North America, is a key driver. The market for fumed silica is expected to grow at a CAGR of over 6.5% in the forecast period, with its market share projected to reach over $6,000 million by 2025.
- Hydrated Silica: Widely used in tires, toothpaste, and food industries, hydrated silica benefits from the growing demand for sustainable and performance-enhancing materials in consumer goods and automotive sectors. Its cost-effectiveness and versatility contribute to its sustained market penetration.
Crystalline Silica: While facing increasing regulatory scrutiny due to health concerns in certain applications, crystalline silica, including Quartz, Tridymite, and Cristobalite, remains crucial in foundational industries.
- Quartz: As the most abundant form, quartz is a fundamental raw material for glass manufacturing, electronics, and construction. Its demand is closely tied to infrastructure development and the growth of the semiconductor industry, with its market size estimated to be around $7,000 million in 2025.
Dominant Segments by End-User Industry:
- Building and Construction: This sector is a cornerstone of the silica market.
- Drivers: Global urbanization, infrastructure development projects, and the increasing adoption of advanced construction materials that enhance durability, strength, and energy efficiency. The demand for silica in cement, concrete admixtures, and insulation is projected to contribute over 25% of the total market revenue by 2025, with an estimated market value exceeding $4,000 million. Economic policies supporting construction and housing initiatives in emerging economies are significant catalysts.
- Glass Manufacturing: A traditional and consistent consumer of silica.
- Drivers: Growing demand for flat glass in construction (windows, facades), automotive glass, and specialty glass for electronics and solar panels. Technological advancements in glass production and the increasing use of energy-efficient glazing are key factors. The market is estimated to be valued at over $3,000 million in 2025.
- Shale Oil and Gas: Crucial for hydraulic fracturing.
- Drivers: Global energy demand and the ongoing exploration and extraction activities, particularly in North America. The need for high-performance proppants to enhance oil and gas recovery is a primary driver.
- Water Treatment: A segment with significant growth potential.
- Drivers: Increasing global focus on clean water, stringent environmental regulations, and the growing need for industrial wastewater management. Silica's adsorbent properties are key here.
- Other End-user Industries: This broad category includes paints and coatings, plastics, rubber, personal care, pharmaceuticals, and electronics, all of which contribute significantly to the overall silica market, with specialized silica types finding increasing application.
Silica Market Product Developments
Product development in the Silica Market is focused on enhancing performance and expanding application horizons. Innovations include the creation of highly dispersible silica grades for fuel-efficient tires, advanced fumed silica for improved rheology control in coatings and adhesives, and ultra-pure silica for semiconductor manufacturing and advanced optics. Tailored particle sizes and surface modifications are key technological trends, allowing for customized solutions that offer superior strength, clarity, and functional properties. These developments provide competitive advantages by meeting the stringent demands of emerging industries and offering solutions for complex material challenges.
Report Scope & Segmentation Analysis
This report meticulously analyzes the global Silica Market across its key segmentations. The market is broadly divided by Type, including Amorphous silica (Pyrogenic/Fumed, Hydrated) and Crystalline silica (Quartz, Tridymite, Cristobalite). The End-user Industry segmentation covers Building and Construction, Shale Oil and Gas, Glass Manufacturing, Water Treatment, and Other End-user Industries.
- Amorphous Silica: This segment, expected to grow at a CAGR of over 6.0%, will continue to lead market share, driven by its versatile applications in advanced materials and consumer products.
- Crystalline Silica: While facing some regulatory headwinds, its fundamental role in glass and construction ensures continued demand, projected to grow at a CAGR of around 4.5%.
- Building and Construction: This segment is forecast to dominate, driven by global infrastructure spending and sustainable building initiatives, with a projected market size exceeding $4,000 million by 2025.
- Glass Manufacturing: A stable and significant segment, driven by architectural and automotive glass demand, with an estimated market size of over $3,000 million.
- Shale Oil and Gas: Demand is linked to energy exploration, with specialized silica proppants playing a key role.
- Water Treatment: This segment offers significant growth potential due to increasing environmental awareness and stricter regulations.
Key Drivers of Silica Market Growth
The Silica Market growth is propelled by several interconnected factors. The burgeoning demand for high-performance materials in sectors like automotive, construction, and electronics is a primary driver. Technological advancements leading to new applications for silica, particularly in areas like advanced coatings, composite materials, and renewable energy technologies, are significantly boosting market penetration. Economic development and industrialization, especially in emerging economies, are fueling demand for silica in infrastructure projects and manufacturing. Furthermore, increasing consumer preference for sustainable and eco-friendly products is indirectly benefiting silica due to its role in producing durable and energy-efficient materials. The global push for cleaner water resources is also elevating the importance of silica in water treatment applications.
Challenges in the Silica Market Sector
Despite robust growth, the Silica Market faces several challenges. Regulatory scrutiny surrounding crystalline silica, due to its potential health hazards, can impact its usage in specific applications and necessitate costly compliance measures. Fluctuations in raw material prices and energy costs can affect manufacturing profitability. Intense competition among established players and the emergence of new entrants can lead to price pressures. Supply chain disruptions, exacerbated by geopolitical events or logistical complexities, can impede market access and increase operational costs. Moreover, the development of alternative materials in some niche applications poses a competitive threat.
Emerging Opportunities in Silica Market
The Silica Market presents numerous emerging opportunities. The increasing focus on electric vehicles (EVs) is driving demand for silica in lightweight materials and advanced battery components. The growth of the renewable energy sector, particularly solar power, is creating opportunities for high-purity silica in solar panel manufacturing. Advancements in 3D printing technology are opening new avenues for silica-based materials. The expanding personal care and pharmaceutical industries, seeking high-purity and functional silica, represent significant growth segments. Furthermore, the development of smart materials and nanotechnology applications for silica offers substantial future potential.
Leading Players in the Silica Market Market
- Heraeus Holding
- China-Henan Huamei Chemical Co Ltd
- Madhu Silica Pvt Ltd
- Nouryon
- Merck KGaA
- AMS Applied Material Solutions
- Mitsubishi Chemical Corporation
- Tokuyama Corporation
- OCI COMPANY Ltd
- Evonik Industries AG
- PPG Industries Inc
- Cabot Corporation
- Covia Holdings Corporation
- Sibelco
- Kemitura Group AS
- WR Grace & Co -Conn
- US Silica
- AGSCO Corp
- Denka Company Limited
- Wacker Chemie AG
Key Developments in Silica Market Industry
- November 2021: Heraeus expanded its portfolio for semi-finished quartz materials with the acquisition of Korean company HS Advanced Materials Co. Ltd. This acquisition will help the company to expand its product portfolio in the semiconductor industry.
- 2023: Several key players announced significant investments in R&D for developing advanced silica grades for EV battery applications, aiming to enhance energy density and safety.
- 2022: Increased focus on sustainable silica production methods, including the use of recycled materials and energy-efficient manufacturing processes, was observed across the industry.
- 2024: The market saw a rise in strategic partnerships between silica manufacturers and end-user industries to co-develop customized solutions for emerging technological applications.
Strategic Outlook for Silica Market Market
The strategic outlook for the Silica Market is exceptionally positive, driven by ongoing innovation and the indispensable nature of silica across a vast spectrum of industries. Future growth will be catalyzed by the continued expansion in advanced materials, electronics, and sustainable construction. The increasing demand for specialized silica grades, such as high-purity amorphous silica for semiconductor fabrication and functionalized silica for novel applications, presents significant opportunities. Strategic acquisitions and collaborations will remain crucial for market players to enhance their product offerings, expand geographical reach, and consolidate their market positions. A focus on sustainable manufacturing practices and product lifecycle management will also be paramount for long-term success and regulatory compliance.
Silica Market Segmentation
-
1. Type
-
1.1. Amorphous
- 1.1.1. Pyrogenic/Fumed
- 1.1.2. Hydrated
-
1.2. Crystalline
- 1.2.1. Quartz
- 1.2.2. Tridymite
- 1.2.3. Cristobalite
-
1.1. Amorphous
-
2. End-user Industry
- 2.1. Building and Construction
- 2.2. Shale Oil and Gas
- 2.3. Glass Manufacturing
- 2.4. Water Treatment
- 2.5. Other End-user Industries
Silica Market Segmentation By Geography
-
1. Asia Pacific
- 1.1. China
- 1.2. India
- 1.3. Japan
- 1.4. South Korea
- 1.5. Malaysia
- 1.6. Thailand
- 1.7. Indonesia
- 1.8. Vietnam
- 1.9. Rest of Asia Pacific
-
2. North America
- 2.1. United States
- 2.2. Canada
- 2.3. Mexico
-
3. Europe
- 3.1. Germany
- 3.2. United Kingdom
- 3.3. Italy
- 3.4. France
- 3.5. Russia
- 3.6. Spain
- 3.7. NORDIC
- 3.8. Turkey
- 3.9. Rest of Europe
-
4. South America
- 4.1. Brazil
- 4.2. Argentina
- 4.3. Rest of South America
-
5. Middle East and Africa
- 5.1. Saudi Arabia
- 5.2. South Africa
- 5.3. Nigeria
- 5.4. Qatar
- 5.5. United Arab Emirates
- 5.6. Egypt
- 5.7. Rest of Middle East and Africa
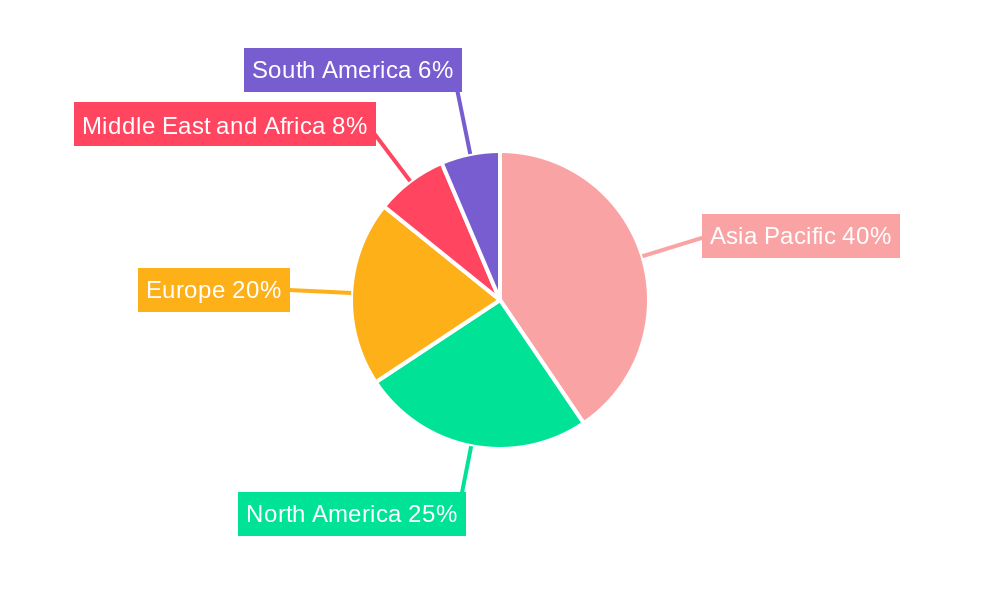
Silica Market Regional Market Share
Geographic Coverage of Silica Market
Silica Market REPORT HIGHLIGHTS
| Aspects | Details |
|---|---|
| Study Period | 2020-2034 |
| Base Year | 2025 |
| Estimated Year | 2026 |
| Forecast Period | 2026-2034 |
| Historical Period | 2020-2025 |
| Growth Rate | CAGR of 6.5% from 2020-2034 |
| Segmentation |
|
Table of Contents
- 1. Introduction
- 1.1. Research Scope
- 1.2. Market Segmentation
- 1.3. Research Objective
- 1.4. Definitions and Assumptions
- 2. Executive Summary
- 2.1. Market Snapshot
- 3. Market Dynamics
- 3.1. Market Drivers
- 3.2. Market Restrains
- 3.3. Market Trends
- 3.4. Market Opportunities
- 4. Market Factor Analysis
- 4.1. Porters Five Forces
- 4.1.1. Bargaining Power of Suppliers
- 4.1.2. Bargaining Power of Buyers
- 4.1.3. Threat of New Entrants
- 4.1.4. Threat of Substitutes
- 4.1.5. Competitive Rivalry
- 4.2. PESTEL analysis
- 4.3. BCG Analysis
- 4.3.1. Stars (High Growth, High Market Share)
- 4.3.2. Cash Cows (Low Growth, High Market Share)
- 4.3.3. Question Mark (High Growth, Low Market Share)
- 4.3.4. Dogs (Low Growth, Low Market Share)
- 4.4. Ansoff Matrix Analysis
- 4.5. Supply Chain Analysis
- 4.6. Regulatory Landscape
- 4.7. Current Market Potential and Opportunity Assessment (TAM–SAM–SOM Framework)
- 4.8. RAX Analyst Note
- 4.1. Porters Five Forces
- 5. Market Analysis, Insights and Forecast 2021-2033
- 5.1. Market Analysis, Insights and Forecast - by Type
- 5.1.1. Amorphous
- 5.1.1.1. Pyrogenic/Fumed
- 5.1.1.2. Hydrated
- 5.1.2. Crystalline
- 5.1.2.1. Quartz
- 5.1.2.2. Tridymite
- 5.1.2.3. Cristobalite
- 5.1.1. Amorphous
- 5.2. Market Analysis, Insights and Forecast - by End-user Industry
- 5.2.1. Building and Construction
- 5.2.2. Shale Oil and Gas
- 5.2.3. Glass Manufacturing
- 5.2.4. Water Treatment
- 5.2.5. Other End-user Industries
- 5.3. Market Analysis, Insights and Forecast - by Region
- 5.3.1. Asia Pacific
- 5.3.2. North America
- 5.3.3. Europe
- 5.3.4. South America
- 5.3.5. Middle East and Africa
- 5.1. Market Analysis, Insights and Forecast - by Type
- 6. Global Silica Market Analysis, Insights and Forecast, 2021-2033
- 6.1. Market Analysis, Insights and Forecast - by Type
- 6.1.1. Amorphous
- 6.1.1.1. Pyrogenic/Fumed
- 6.1.1.2. Hydrated
- 6.1.2. Crystalline
- 6.1.2.1. Quartz
- 6.1.2.2. Tridymite
- 6.1.2.3. Cristobalite
- 6.1.1. Amorphous
- 6.2. Market Analysis, Insights and Forecast - by End-user Industry
- 6.2.1. Building and Construction
- 6.2.2. Shale Oil and Gas
- 6.2.3. Glass Manufacturing
- 6.2.4. Water Treatment
- 6.2.5. Other End-user Industries
- 6.1. Market Analysis, Insights and Forecast - by Type
- 7. Asia Pacific Silica Market Analysis, Insights and Forecast, 2020-2032
- 7.1. Market Analysis, Insights and Forecast - by Type
- 7.1.1. Amorphous
- 7.1.1.1. Pyrogenic/Fumed
- 7.1.1.2. Hydrated
- 7.1.2. Crystalline
- 7.1.2.1. Quartz
- 7.1.2.2. Tridymite
- 7.1.2.3. Cristobalite
- 7.1.1. Amorphous
- 7.2. Market Analysis, Insights and Forecast - by End-user Industry
- 7.2.1. Building and Construction
- 7.2.2. Shale Oil and Gas
- 7.2.3. Glass Manufacturing
- 7.2.4. Water Treatment
- 7.2.5. Other End-user Industries
- 7.1. Market Analysis, Insights and Forecast - by Type
- 8. North America Silica Market Analysis, Insights and Forecast, 2020-2032
- 8.1. Market Analysis, Insights and Forecast - by Type
- 8.1.1. Amorphous
- 8.1.1.1. Pyrogenic/Fumed
- 8.1.1.2. Hydrated
- 8.1.2. Crystalline
- 8.1.2.1. Quartz
- 8.1.2.2. Tridymite
- 8.1.2.3. Cristobalite
- 8.1.1. Amorphous
- 8.2. Market Analysis, Insights and Forecast - by End-user Industry
- 8.2.1. Building and Construction
- 8.2.2. Shale Oil and Gas
- 8.2.3. Glass Manufacturing
- 8.2.4. Water Treatment
- 8.2.5. Other End-user Industries
- 8.1. Market Analysis, Insights and Forecast - by Type
- 9. Europe Silica Market Analysis, Insights and Forecast, 2020-2032
- 9.1. Market Analysis, Insights and Forecast - by Type
- 9.1.1. Amorphous
- 9.1.1.1. Pyrogenic/Fumed
- 9.1.1.2. Hydrated
- 9.1.2. Crystalline
- 9.1.2.1. Quartz
- 9.1.2.2. Tridymite
- 9.1.2.3. Cristobalite
- 9.1.1. Amorphous
- 9.2. Market Analysis, Insights and Forecast - by End-user Industry
- 9.2.1. Building and Construction
- 9.2.2. Shale Oil and Gas
- 9.2.3. Glass Manufacturing
- 9.2.4. Water Treatment
- 9.2.5. Other End-user Industries
- 9.1. Market Analysis, Insights and Forecast - by Type
- 10. South America Silica Market Analysis, Insights and Forecast, 2020-2032
- 10.1. Market Analysis, Insights and Forecast - by Type
- 10.1.1. Amorphous
- 10.1.1.1. Pyrogenic/Fumed
- 10.1.1.2. Hydrated
- 10.1.2. Crystalline
- 10.1.2.1. Quartz
- 10.1.2.2. Tridymite
- 10.1.2.3. Cristobalite
- 10.1.1. Amorphous
- 10.2. Market Analysis, Insights and Forecast - by End-user Industry
- 10.2.1. Building and Construction
- 10.2.2. Shale Oil and Gas
- 10.2.3. Glass Manufacturing
- 10.2.4. Water Treatment
- 10.2.5. Other End-user Industries
- 10.1. Market Analysis, Insights and Forecast - by Type
- 11. Middle East and Africa Silica Market Analysis, Insights and Forecast, 2020-2032
- 11.1. Market Analysis, Insights and Forecast - by Type
- 11.1.1. Amorphous
- 11.1.1.1. Pyrogenic/Fumed
- 11.1.1.2. Hydrated
- 11.1.2. Crystalline
- 11.1.2.1. Quartz
- 11.1.2.2. Tridymite
- 11.1.2.3. Cristobalite
- 11.1.1. Amorphous
- 11.2. Market Analysis, Insights and Forecast - by End-user Industry
- 11.2.1. Building and Construction
- 11.2.2. Shale Oil and Gas
- 11.2.3. Glass Manufacturing
- 11.2.4. Water Treatment
- 11.2.5. Other End-user Industries
- 11.1. Market Analysis, Insights and Forecast - by Type
- 12. Competitive Analysis
- 12.1. Company Profiles
- 12.1.1 Heraeus Holding
- 12.1.1.1. Company Overview
- 12.1.1.2. Products
- 12.1.1.3. Company Financials
- 12.1.1.4. SWOT Analysis
- 12.1.2 China-Henan Huamei Chemical Co Ltd
- 12.1.2.1. Company Overview
- 12.1.2.2. Products
- 12.1.2.3. Company Financials
- 12.1.2.4. SWOT Analysis
- 12.1.3 Madhu Silica Pvt Ltd
- 12.1.3.1. Company Overview
- 12.1.3.2. Products
- 12.1.3.3. Company Financials
- 12.1.3.4. SWOT Analysis
- 12.1.4 Nouryon
- 12.1.4.1. Company Overview
- 12.1.4.2. Products
- 12.1.4.3. Company Financials
- 12.1.4.4. SWOT Analysis
- 12.1.5 Merck KGaA
- 12.1.5.1. Company Overview
- 12.1.5.2. Products
- 12.1.5.3. Company Financials
- 12.1.5.4. SWOT Analysis
- 12.1.6 AMS Applied Material Solutions
- 12.1.6.1. Company Overview
- 12.1.6.2. Products
- 12.1.6.3. Company Financials
- 12.1.6.4. SWOT Analysis
- 12.1.7 Mitsubishi Chemical Corporation
- 12.1.7.1. Company Overview
- 12.1.7.2. Products
- 12.1.7.3. Company Financials
- 12.1.7.4. SWOT Analysis
- 12.1.8 Tokuyama Corporation
- 12.1.8.1. Company Overview
- 12.1.8.2. Products
- 12.1.8.3. Company Financials
- 12.1.8.4. SWOT Analysis
- 12.1.9 OCI COMPANY Ltd
- 12.1.9.1. Company Overview
- 12.1.9.2. Products
- 12.1.9.3. Company Financials
- 12.1.9.4. SWOT Analysis
- 12.1.10 Evonik Industries AG
- 12.1.10.1. Company Overview
- 12.1.10.2. Products
- 12.1.10.3. Company Financials
- 12.1.10.4. SWOT Analysis
- 12.1.11 PPG Industries Inc
- 12.1.11.1. Company Overview
- 12.1.11.2. Products
- 12.1.11.3. Company Financials
- 12.1.11.4. SWOT Analysis
- 12.1.12 Cabot Corporation
- 12.1.12.1. Company Overview
- 12.1.12.2. Products
- 12.1.12.3. Company Financials
- 12.1.12.4. SWOT Analysis
- 12.1.13 Covia Holdings Corporation
- 12.1.13.1. Company Overview
- 12.1.13.2. Products
- 12.1.13.3. Company Financials
- 12.1.13.4. SWOT Analysis
- 12.1.14 Sibelco
- 12.1.14.1. Company Overview
- 12.1.14.2. Products
- 12.1.14.3. Company Financials
- 12.1.14.4. SWOT Analysis
- 12.1.15 Kemitura Group AS
- 12.1.15.1. Company Overview
- 12.1.15.2. Products
- 12.1.15.3. Company Financials
- 12.1.15.4. SWOT Analysis
- 12.1.16 WR Grace & Co -Conn *List Not Exhaustive
- 12.1.16.1. Company Overview
- 12.1.16.2. Products
- 12.1.16.3. Company Financials
- 12.1.16.4. SWOT Analysis
- 12.1.17 US Silica
- 12.1.17.1. Company Overview
- 12.1.17.2. Products
- 12.1.17.3. Company Financials
- 12.1.17.4. SWOT Analysis
- 12.1.18 AGSCO Corp
- 12.1.18.1. Company Overview
- 12.1.18.2. Products
- 12.1.18.3. Company Financials
- 12.1.18.4. SWOT Analysis
- 12.1.19 Denka Company Limited
- 12.1.19.1. Company Overview
- 12.1.19.2. Products
- 12.1.19.3. Company Financials
- 12.1.19.4. SWOT Analysis
- 12.1.20 Wacker Chemie AG
- 12.1.20.1. Company Overview
- 12.1.20.2. Products
- 12.1.20.3. Company Financials
- 12.1.20.4. SWOT Analysis
- 12.1.1 Heraeus Holding
- 12.2. Market Entropy
- 12.2.1 Company's Key Areas Served
- 12.2.2 Recent Developments
- 12.3. Company Market Share Analysis 2025
- 12.3.1 Top 5 Companies Market Share Analysis
- 12.3.2 Top 3 Companies Market Share Analysis
- 12.4. List of Potential Customers
- 13. Research Methodology
List of Figures
- Figure 1: Global Silica Market Revenue Breakdown (billion, %) by Region 2025 & 2033
- Figure 2: Global Silica Market Volume Breakdown (Million, %) by Region 2025 & 2033
- Figure 3: Asia Pacific Silica Market Revenue (billion), by Type 2025 & 2033
- Figure 4: Asia Pacific Silica Market Volume (Million), by Type 2025 & 2033
- Figure 5: Asia Pacific Silica Market Revenue Share (%), by Type 2025 & 2033
- Figure 6: Asia Pacific Silica Market Volume Share (%), by Type 2025 & 2033
- Figure 7: Asia Pacific Silica Market Revenue (billion), by End-user Industry 2025 & 2033
- Figure 8: Asia Pacific Silica Market Volume (Million), by End-user Industry 2025 & 2033
- Figure 9: Asia Pacific Silica Market Revenue Share (%), by End-user Industry 2025 & 2033
- Figure 10: Asia Pacific Silica Market Volume Share (%), by End-user Industry 2025 & 2033
- Figure 11: Asia Pacific Silica Market Revenue (billion), by Country 2025 & 2033
- Figure 12: Asia Pacific Silica Market Volume (Million), by Country 2025 & 2033
- Figure 13: Asia Pacific Silica Market Revenue Share (%), by Country 2025 & 2033
- Figure 14: Asia Pacific Silica Market Volume Share (%), by Country 2025 & 2033
- Figure 15: North America Silica Market Revenue (billion), by Type 2025 & 2033
- Figure 16: North America Silica Market Volume (Million), by Type 2025 & 2033
- Figure 17: North America Silica Market Revenue Share (%), by Type 2025 & 2033
- Figure 18: North America Silica Market Volume Share (%), by Type 2025 & 2033
- Figure 19: North America Silica Market Revenue (billion), by End-user Industry 2025 & 2033
- Figure 20: North America Silica Market Volume (Million), by End-user Industry 2025 & 2033
- Figure 21: North America Silica Market Revenue Share (%), by End-user Industry 2025 & 2033
- Figure 22: North America Silica Market Volume Share (%), by End-user Industry 2025 & 2033
- Figure 23: North America Silica Market Revenue (billion), by Country 2025 & 2033
- Figure 24: North America Silica Market Volume (Million), by Country 2025 & 2033
- Figure 25: North America Silica Market Revenue Share (%), by Country 2025 & 2033
- Figure 26: North America Silica Market Volume Share (%), by Country 2025 & 2033
- Figure 27: Europe Silica Market Revenue (billion), by Type 2025 & 2033
- Figure 28: Europe Silica Market Volume (Million), by Type 2025 & 2033
- Figure 29: Europe Silica Market Revenue Share (%), by Type 2025 & 2033
- Figure 30: Europe Silica Market Volume Share (%), by Type 2025 & 2033
- Figure 31: Europe Silica Market Revenue (billion), by End-user Industry 2025 & 2033
- Figure 32: Europe Silica Market Volume (Million), by End-user Industry 2025 & 2033
- Figure 33: Europe Silica Market Revenue Share (%), by End-user Industry 2025 & 2033
- Figure 34: Europe Silica Market Volume Share (%), by End-user Industry 2025 & 2033
- Figure 35: Europe Silica Market Revenue (billion), by Country 2025 & 2033
- Figure 36: Europe Silica Market Volume (Million), by Country 2025 & 2033
- Figure 37: Europe Silica Market Revenue Share (%), by Country 2025 & 2033
- Figure 38: Europe Silica Market Volume Share (%), by Country 2025 & 2033
- Figure 39: South America Silica Market Revenue (billion), by Type 2025 & 2033
- Figure 40: South America Silica Market Volume (Million), by Type 2025 & 2033
- Figure 41: South America Silica Market Revenue Share (%), by Type 2025 & 2033
- Figure 42: South America Silica Market Volume Share (%), by Type 2025 & 2033
- Figure 43: South America Silica Market Revenue (billion), by End-user Industry 2025 & 2033
- Figure 44: South America Silica Market Volume (Million), by End-user Industry 2025 & 2033
- Figure 45: South America Silica Market Revenue Share (%), by End-user Industry 2025 & 2033
- Figure 46: South America Silica Market Volume Share (%), by End-user Industry 2025 & 2033
- Figure 47: South America Silica Market Revenue (billion), by Country 2025 & 2033
- Figure 48: South America Silica Market Volume (Million), by Country 2025 & 2033
- Figure 49: South America Silica Market Revenue Share (%), by Country 2025 & 2033
- Figure 50: South America Silica Market Volume Share (%), by Country 2025 & 2033
- Figure 51: Middle East and Africa Silica Market Revenue (billion), by Type 2025 & 2033
- Figure 52: Middle East and Africa Silica Market Volume (Million), by Type 2025 & 2033
- Figure 53: Middle East and Africa Silica Market Revenue Share (%), by Type 2025 & 2033
- Figure 54: Middle East and Africa Silica Market Volume Share (%), by Type 2025 & 2033
- Figure 55: Middle East and Africa Silica Market Revenue (billion), by End-user Industry 2025 & 2033
- Figure 56: Middle East and Africa Silica Market Volume (Million), by End-user Industry 2025 & 2033
- Figure 57: Middle East and Africa Silica Market Revenue Share (%), by End-user Industry 2025 & 2033
- Figure 58: Middle East and Africa Silica Market Volume Share (%), by End-user Industry 2025 & 2033
- Figure 59: Middle East and Africa Silica Market Revenue (billion), by Country 2025 & 2033
- Figure 60: Middle East and Africa Silica Market Volume (Million), by Country 2025 & 2033
- Figure 61: Middle East and Africa Silica Market Revenue Share (%), by Country 2025 & 2033
- Figure 62: Middle East and Africa Silica Market Volume Share (%), by Country 2025 & 2033
List of Tables
- Table 1: Global Silica Market Revenue billion Forecast, by Type 2020 & 2033
- Table 2: Global Silica Market Volume Million Forecast, by Type 2020 & 2033
- Table 3: Global Silica Market Revenue billion Forecast, by End-user Industry 2020 & 2033
- Table 4: Global Silica Market Volume Million Forecast, by End-user Industry 2020 & 2033
- Table 5: Global Silica Market Revenue billion Forecast, by Region 2020 & 2033
- Table 6: Global Silica Market Volume Million Forecast, by Region 2020 & 2033
- Table 7: Global Silica Market Revenue billion Forecast, by Type 2020 & 2033
- Table 8: Global Silica Market Volume Million Forecast, by Type 2020 & 2033
- Table 9: Global Silica Market Revenue billion Forecast, by End-user Industry 2020 & 2033
- Table 10: Global Silica Market Volume Million Forecast, by End-user Industry 2020 & 2033
- Table 11: Global Silica Market Revenue billion Forecast, by Country 2020 & 2033
- Table 12: Global Silica Market Volume Million Forecast, by Country 2020 & 2033
- Table 13: China Silica Market Revenue (billion) Forecast, by Application 2020 & 2033
- Table 14: China Silica Market Volume (Million) Forecast, by Application 2020 & 2033
- Table 15: India Silica Market Revenue (billion) Forecast, by Application 2020 & 2033
- Table 16: India Silica Market Volume (Million) Forecast, by Application 2020 & 2033
- Table 17: Japan Silica Market Revenue (billion) Forecast, by Application 2020 & 2033
- Table 18: Japan Silica Market Volume (Million) Forecast, by Application 2020 & 2033
- Table 19: South Korea Silica Market Revenue (billion) Forecast, by Application 2020 & 2033
- Table 20: South Korea Silica Market Volume (Million) Forecast, by Application 2020 & 2033
- Table 21: Malaysia Silica Market Revenue (billion) Forecast, by Application 2020 & 2033
- Table 22: Malaysia Silica Market Volume (Million) Forecast, by Application 2020 & 2033
- Table 23: Thailand Silica Market Revenue (billion) Forecast, by Application 2020 & 2033
- Table 24: Thailand Silica Market Volume (Million) Forecast, by Application 2020 & 2033
- Table 25: Indonesia Silica Market Revenue (billion) Forecast, by Application 2020 & 2033
- Table 26: Indonesia Silica Market Volume (Million) Forecast, by Application 2020 & 2033
- Table 27: Vietnam Silica Market Revenue (billion) Forecast, by Application 2020 & 2033
- Table 28: Vietnam Silica Market Volume (Million) Forecast, by Application 2020 & 2033
- Table 29: Rest of Asia Pacific Silica Market Revenue (billion) Forecast, by Application 2020 & 2033
- Table 30: Rest of Asia Pacific Silica Market Volume (Million) Forecast, by Application 2020 & 2033
- Table 31: Global Silica Market Revenue billion Forecast, by Type 2020 & 2033
- Table 32: Global Silica Market Volume Million Forecast, by Type 2020 & 2033
- Table 33: Global Silica Market Revenue billion Forecast, by End-user Industry 2020 & 2033
- Table 34: Global Silica Market Volume Million Forecast, by End-user Industry 2020 & 2033
- Table 35: Global Silica Market Revenue billion Forecast, by Country 2020 & 2033
- Table 36: Global Silica Market Volume Million Forecast, by Country 2020 & 2033
- Table 37: United States Silica Market Revenue (billion) Forecast, by Application 2020 & 2033
- Table 38: United States Silica Market Volume (Million) Forecast, by Application 2020 & 2033
- Table 39: Canada Silica Market Revenue (billion) Forecast, by Application 2020 & 2033
- Table 40: Canada Silica Market Volume (Million) Forecast, by Application 2020 & 2033
- Table 41: Mexico Silica Market Revenue (billion) Forecast, by Application 2020 & 2033
- Table 42: Mexico Silica Market Volume (Million) Forecast, by Application 2020 & 2033
- Table 43: Global Silica Market Revenue billion Forecast, by Type 2020 & 2033
- Table 44: Global Silica Market Volume Million Forecast, by Type 2020 & 2033
- Table 45: Global Silica Market Revenue billion Forecast, by End-user Industry 2020 & 2033
- Table 46: Global Silica Market Volume Million Forecast, by End-user Industry 2020 & 2033
- Table 47: Global Silica Market Revenue billion Forecast, by Country 2020 & 2033
- Table 48: Global Silica Market Volume Million Forecast, by Country 2020 & 2033
- Table 49: Germany Silica Market Revenue (billion) Forecast, by Application 2020 & 2033
- Table 50: Germany Silica Market Volume (Million) Forecast, by Application 2020 & 2033
- Table 51: United Kingdom Silica Market Revenue (billion) Forecast, by Application 2020 & 2033
- Table 52: United Kingdom Silica Market Volume (Million) Forecast, by Application 2020 & 2033
- Table 53: Italy Silica Market Revenue (billion) Forecast, by Application 2020 & 2033
- Table 54: Italy Silica Market Volume (Million) Forecast, by Application 2020 & 2033
- Table 55: France Silica Market Revenue (billion) Forecast, by Application 2020 & 2033
- Table 56: France Silica Market Volume (Million) Forecast, by Application 2020 & 2033
- Table 57: Russia Silica Market Revenue (billion) Forecast, by Application 2020 & 2033
- Table 58: Russia Silica Market Volume (Million) Forecast, by Application 2020 & 2033
- Table 59: Spain Silica Market Revenue (billion) Forecast, by Application 2020 & 2033
- Table 60: Spain Silica Market Volume (Million) Forecast, by Application 2020 & 2033
- Table 61: NORDIC Silica Market Revenue (billion) Forecast, by Application 2020 & 2033
- Table 62: NORDIC Silica Market Volume (Million) Forecast, by Application 2020 & 2033
- Table 63: Turkey Silica Market Revenue (billion) Forecast, by Application 2020 & 2033
- Table 64: Turkey Silica Market Volume (Million) Forecast, by Application 2020 & 2033
- Table 65: Rest of Europe Silica Market Revenue (billion) Forecast, by Application 2020 & 2033
- Table 66: Rest of Europe Silica Market Volume (Million) Forecast, by Application 2020 & 2033
- Table 67: Global Silica Market Revenue billion Forecast, by Type 2020 & 2033
- Table 68: Global Silica Market Volume Million Forecast, by Type 2020 & 2033
- Table 69: Global Silica Market Revenue billion Forecast, by End-user Industry 2020 & 2033
- Table 70: Global Silica Market Volume Million Forecast, by End-user Industry 2020 & 2033
- Table 71: Global Silica Market Revenue billion Forecast, by Country 2020 & 2033
- Table 72: Global Silica Market Volume Million Forecast, by Country 2020 & 2033
- Table 73: Brazil Silica Market Revenue (billion) Forecast, by Application 2020 & 2033
- Table 74: Brazil Silica Market Volume (Million) Forecast, by Application 2020 & 2033
- Table 75: Argentina Silica Market Revenue (billion) Forecast, by Application 2020 & 2033
- Table 76: Argentina Silica Market Volume (Million) Forecast, by Application 2020 & 2033
- Table 77: Rest of South America Silica Market Revenue (billion) Forecast, by Application 2020 & 2033
- Table 78: Rest of South America Silica Market Volume (Million) Forecast, by Application 2020 & 2033
- Table 79: Global Silica Market Revenue billion Forecast, by Type 2020 & 2033
- Table 80: Global Silica Market Volume Million Forecast, by Type 2020 & 2033
- Table 81: Global Silica Market Revenue billion Forecast, by End-user Industry 2020 & 2033
- Table 82: Global Silica Market Volume Million Forecast, by End-user Industry 2020 & 2033
- Table 83: Global Silica Market Revenue billion Forecast, by Country 2020 & 2033
- Table 84: Global Silica Market Volume Million Forecast, by Country 2020 & 2033
- Table 85: Saudi Arabia Silica Market Revenue (billion) Forecast, by Application 2020 & 2033
- Table 86: Saudi Arabia Silica Market Volume (Million) Forecast, by Application 2020 & 2033
- Table 87: South Africa Silica Market Revenue (billion) Forecast, by Application 2020 & 2033
- Table 88: South Africa Silica Market Volume (Million) Forecast, by Application 2020 & 2033
- Table 89: Nigeria Silica Market Revenue (billion) Forecast, by Application 2020 & 2033
- Table 90: Nigeria Silica Market Volume (Million) Forecast, by Application 2020 & 2033
- Table 91: Qatar Silica Market Revenue (billion) Forecast, by Application 2020 & 2033
- Table 92: Qatar Silica Market Volume (Million) Forecast, by Application 2020 & 2033
- Table 93: United Arab Emirates Silica Market Revenue (billion) Forecast, by Application 2020 & 2033
- Table 94: United Arab Emirates Silica Market Volume (Million) Forecast, by Application 2020 & 2033
- Table 95: Egypt Silica Market Revenue (billion) Forecast, by Application 2020 & 2033
- Table 96: Egypt Silica Market Volume (Million) Forecast, by Application 2020 & 2033
- Table 97: Rest of Middle East and Africa Silica Market Revenue (billion) Forecast, by Application 2020 & 2033
- Table 98: Rest of Middle East and Africa Silica Market Volume (Million) Forecast, by Application 2020 & 2033
Frequently Asked Questions
1. What is the projected Compound Annual Growth Rate (CAGR) of the Silica Market?
The projected CAGR is approximately 6.5%.
2. Which companies are prominent players in the Silica Market?
Key companies in the market include Heraeus Holding, China-Henan Huamei Chemical Co Ltd, Madhu Silica Pvt Ltd, Nouryon, Merck KGaA, AMS Applied Material Solutions, Mitsubishi Chemical Corporation, Tokuyama Corporation, OCI COMPANY Ltd, Evonik Industries AG, PPG Industries Inc, Cabot Corporation, Covia Holdings Corporation, Sibelco, Kemitura Group AS, WR Grace & Co -Conn *List Not Exhaustive, US Silica, AGSCO Corp, Denka Company Limited, Wacker Chemie AG.
3. What are the main segments of the Silica Market?
The market segments include Type, End-user Industry.
4. Can you provide details about the market size?
The market size is estimated to be USD 14.2 billion as of 2022.
5. What are some drivers contributing to market growth?
Increasing Demand of Precipitated Silica for Different End Uses; Rapidly Expanding Construction Activities.
6. What are the notable trends driving market growth?
Increasing Demand from the Building and Construction Industry.
7. Are there any restraints impacting market growth?
Competition from Substitute Products.
8. Can you provide examples of recent developments in the market?
In November 2021, Heraeus expanded its portfolio for semi-finished quartz materials with the acquisition of Korean company HS Advanced Materials Co. Ltd. This acquisition will help the company to expand its product portfolio in the semiconductor industry.
9. What pricing options are available for accessing the report?
Pricing options include single-user, multi-user, and enterprise licenses priced at USD 4750, USD 5250, and USD 8750 respectively.
10. Is the market size provided in terms of value or volume?
The market size is provided in terms of value, measured in billion and volume, measured in Million.
11. Are there any specific market keywords associated with the report?
Yes, the market keyword associated with the report is "Silica Market," which aids in identifying and referencing the specific market segment covered.
12. How do I determine which pricing option suits my needs best?
The pricing options vary based on user requirements and access needs. Individual users may opt for single-user licenses, while businesses requiring broader access may choose multi-user or enterprise licenses for cost-effective access to the report.
13. Are there any additional resources or data provided in the Silica Market report?
While the report offers comprehensive insights, it's advisable to review the specific contents or supplementary materials provided to ascertain if additional resources or data are available.
14. How can I stay updated on further developments or reports in the Silica Market?
To stay informed about further developments, trends, and reports in the Silica Market, consider subscribing to industry newsletters, following relevant companies and organizations, or regularly checking reputable industry news sources and publications.
Methodology
Step 1 - Identification of Relevant Samples Size from Population Database


Step 2 - Approaches for Defining Global Market Size (Value, Volume* & Price*)

Note*: In applicable scenarios
Step 3 - Data Sources
Primary Research
- Web Analytics
- Survey Reports
- Research Institute
- Latest Research Reports
- Opinion Leaders
Secondary Research
- Annual Reports
- White Paper
- Latest Press Release
- Industry Association
- Paid Database
- Investor Presentations

Step 4 - Data Triangulation
Involves using different sources of information in order to increase the validity of a study
These sources are likely to be stakeholders in a program - participants, other researchers, program staff, other community members, and so on.
Then we put all data in single framework & apply various statistical tools to find out the dynamic on the market.
During the analysis stage, feedback from the stakeholder groups would be compared to determine areas of agreement as well as areas of divergence

