

Key Insights
The global Silicon Potting Compound market is projected to reach $33.15 billion by 2025, expanding at a CAGR of 3.12% during the forecast period (2025-2033). This significant growth is primarily driven by escalating demand in the Electronics and Automotive sectors. In electronics, device miniaturization and increasing component complexity necessitate robust protection against environmental factors, thermal stress, and vibration, areas where silicon potting compounds excel. The automotive industry's rapid transition to electric vehicles (EVs) and advanced driver-assistance systems (ADAS) amplifies the need for reliable encapsulation of sensitive electronic modules and power components, ensuring their durability and performance. The aerospace sector, with its rigorous safety and reliability mandates for critical flight systems, also remains a consistent contributor to market demand.
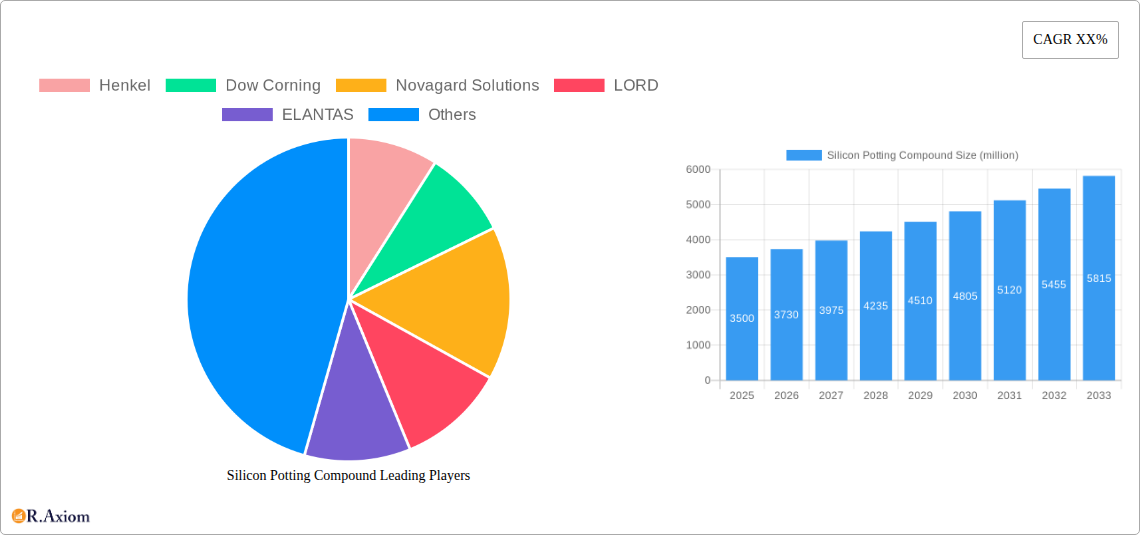
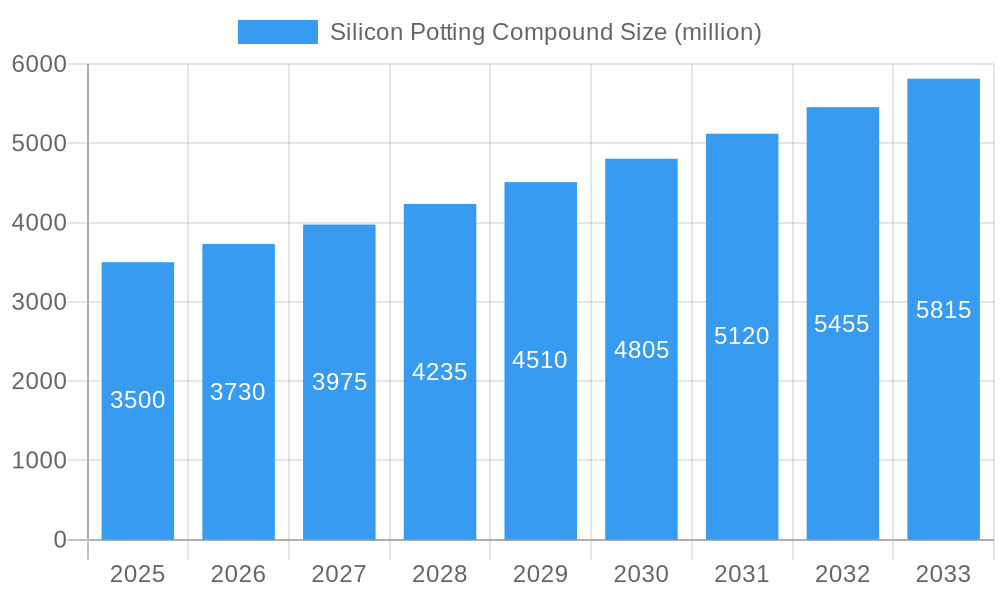
Silicon Potting Compound Market Size (In Billion)
Key market trends include the rising adoption of UV-curable silicon potting compounds, which enhance manufacturing efficiency through faster processing and reduced energy consumption. Concurrently, there is a notable emphasis on developing high-performance silicones with improved thermal conductivity and flame retardancy to meet advanced application specifications. Market restraints include raw material price volatility, impacting profit margins and stability. The availability of alternative encapsulation materials, while often less performant in critical applications, presents a competitive challenge in price-sensitive segments. Despite these challenges, the inherent superior properties of silicon potting compounds, including excellent dielectric strength, flexibility, and resistance to extreme temperatures and chemicals, reinforce their essential role across diverse high-growth industries.
Silicon Potting Compound Company Market Share
Silicon Potting Compound Market Concentration & Innovation
The global silicon potting compound market exhibits moderate to high concentration, with leading players like Henkel, Dow Corning, Novagard Solutions, LORD, ELANTAS, Master Bond, MG Chemicals, Dymax Corporation, Noelle Industries, Elkem ASA, Robnor ResinLab Ltd, and Huntsman International holding significant market shares. Innovation is a key differentiator, driven by the increasing demand for advanced protection in harsh environments across electronics, aerospace, and automotive sectors. Key innovation drivers include the development of faster curing times, enhanced thermal conductivity, improved electrical insulation properties, and greater environmental resistance. Regulatory frameworks, particularly concerning environmental compliance and material safety (e.g., REACH, RoHS), are increasingly shaping product development and material selection. Product substitutes, such as epoxy or polyurethane potting compounds, present a competitive challenge, but silicon's superior flexibility, temperature resistance, and UV stability often give it an edge. End-user trends are heavily influenced by miniaturization in electronics, the growing adoption of electric vehicles, and the stringent performance requirements in aerospace applications. Mergers and acquisitions (M&A) are notable, with estimated deal values in the hundreds of millions, aimed at expanding product portfolios, geographical reach, and technological capabilities. For instance, strategic acquisitions by larger chemical conglomerates seek to integrate specialized silicon potting compound expertise into their broader offerings, further consolidating market influence and fostering innovation through shared R&D resources.
Silicon Potting Compound Industry Trends & Insights
The silicon potting compound market is experiencing robust growth, driven by an escalating demand for advanced encapsulation solutions across a multitude of high-tech industries. The compound annual growth rate (CAGR) is projected to be approximately 7.5% during the forecast period of 2025–2033. This upward trajectory is primarily fueled by the relentless expansion of the electronics sector, where silicon potting compounds are indispensable for protecting sensitive components from moisture, vibration, thermal stress, and chemical ingress. The burgeoning automotive industry, particularly the accelerated adoption of electric vehicles (EVs) and advanced driver-assistance systems (ADAS), presents a significant growth avenue. EVs, with their complex power electronics and battery management systems, require robust encapsulation to ensure reliability and safety in demanding operating conditions. Aerospace and defense applications, characterized by extreme environmental conditions and stringent performance criteria, also contribute substantially to market penetration. The industrial segment, encompassing areas like renewable energy infrastructure and heavy machinery, further bolsters demand. Technological advancements are reshaping the market, with a growing emphasis on developing potting compounds with enhanced thermal management capabilities to address the heat dissipation challenges posed by increasingly powerful and compact electronic devices. The development of self-healing silicones and those with superior adhesion to a wider range of substrates are also key innovation areas. Consumer preferences are shifting towards longer product lifecycles and greater reliability, driving the adoption of premium potting solutions. Competitive dynamics are intense, with manufacturers focusing on product differentiation through specialized formulations, technical support, and sustainable manufacturing practices. The market penetration of silicon potting compounds is steadily increasing as industries recognize their long-term cost benefits and performance advantages over traditional encapsulation methods, especially in applications requiring high durability and resilience.
Dominant Markets & Segments in Silicon Potting Compound
The global silicon potting compound market is characterized by strong regional dominance and significant traction within specific application and product type segments.
Electronics Segment Dominance
- Key Drivers: Miniaturization of electronic devices, increasing complexity of printed circuit boards (PCBs), and the proliferation of Internet of Things (IoT) devices are driving demand. The need for enhanced protection against environmental factors like humidity, dust, and thermal fluctuations in consumer electronics, telecommunications equipment, and industrial control systems is paramount. The stringent reliability requirements in medical electronics and data centers further solidify this segment's dominance.
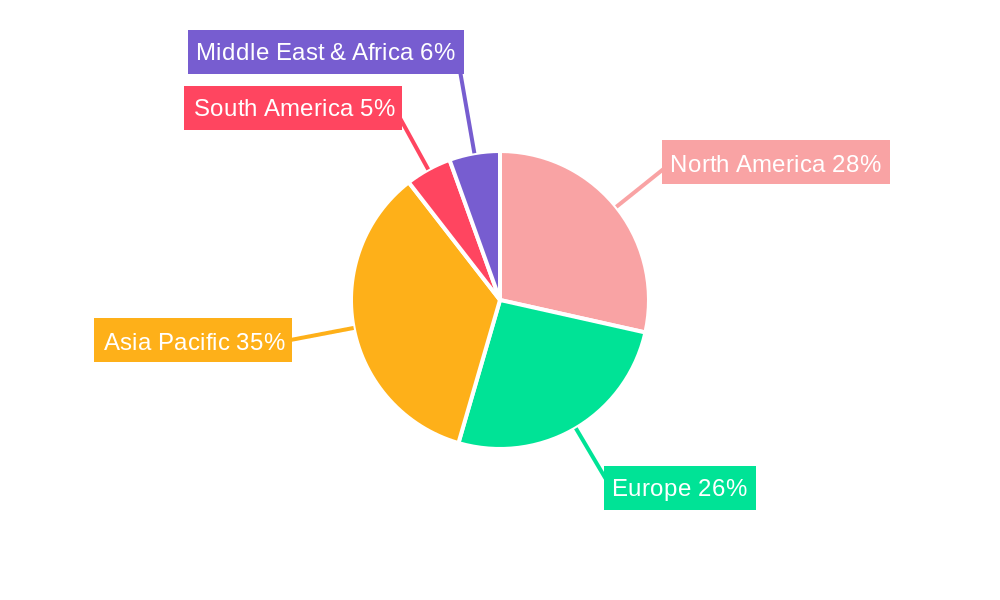
- Detailed Dominance Analysis: The electronics sector accounts for an estimated 45% of the total market share. The Asia-Pacific region, with its vast electronics manufacturing base, represents the largest geographical market for silicon potting compounds within this segment. Countries like China, South Korea, and Taiwan are major consumers due to their extensive production of smartphones, computers, and other electronic gadgets. The sheer volume of production and the constant innovation in electronic devices necessitate advanced encapsulation solutions, making silicon potting compounds a critical material.
Automotive Segment Growth
- Key Drivers: The exponential growth of electric vehicles (EVs) and the increasing integration of sophisticated electronic components in conventional vehicles are key drivers. Silicon potting compounds are crucial for protecting battery management systems, power inverters, sensors, and control units from vibration, thermal cycling, and moisture ingress in the harsh automotive environment.
- Detailed Dominance Analysis: The automotive segment is projected to grow at a CAGR of approximately 8.2% from 2025–2033, making it a rapidly expanding area. North America and Europe are leading this growth due to stricter automotive safety regulations and the aggressive push towards electrification. The increasing average number of electronic control units (ECUs) per vehicle and the evolving autonomous driving technologies are creating substantial demand for reliable potting solutions.
Aerospace & Industrial Segment Importance
- Key Drivers: The aerospace industry demands extremely high reliability and performance in extreme temperature ranges and high-stress environments, making silicon potting compounds essential for avionics, navigation systems, and communication equipment. The industrial segment benefits from the need for robust protection in power generation, heavy machinery, and automation equipment, where durability and resistance to harsh chemicals are crucial.
- Detailed Dominance Analysis: While smaller in volume compared to electronics, these segments represent high-value applications. The aerospace sector contributes an estimated 15% to the market share, with North America and Europe being key consumers. The industrial segment accounts for approximately 20% of the market share, with growing demand in emerging economies for infrastructure development and industrial automation.
Types: UV and Thermal Curing
- UV Curing: The UV segment is favored for applications requiring rapid processing times and low-temperature curing, such as in automated assembly lines for consumer electronics. Its quick cure cycles enhance manufacturing efficiency.
- Thermal Curing: Thermal cure silicon potting compounds are prevalent in applications demanding superior mechanical strength, chemical resistance, and high-temperature performance, commonly found in aerospace and heavy industrial equipment. Their versatility and robust properties make them indispensable.
Silicon Potting Compound Product Developments
Recent product developments in silicon potting compounds focus on enhanced performance and application-specific solutions. Innovations include the introduction of faster-curing formulations, improved thermal conductivity for better heat dissipation in advanced electronics, and enhanced flexibility for vibration dampening. Products offering superior adhesion to challenging substrates and greater resistance to extreme temperatures and chemicals are also emerging. These developments aim to meet the evolving needs of the electronics, aerospace, automotive, and industrial sectors, providing competitive advantages through increased reliability, extended product lifespan, and simplified manufacturing processes.
Report Scope & Segmentation Analysis
This report provides a comprehensive analysis of the global silicon potting compound market, segmented by Application and Type.
- Electronics: This segment, representing approximately 45% of the market, is driven by the demand for protective encapsulation in devices like smartphones, PCBs, and IoT components. Growth projections indicate a steady increase due to ongoing technological advancements.
- Aerospace: Accounting for around 15% of the market, this segment requires high-performance potting for avionics and critical systems. Stringent regulatory requirements and the need for extreme environmental resistance define its growth.
- Automotive: This segment is experiencing rapid growth, projected at approximately 8.2% CAGR, driven by the EV revolution and increasing electronic content in vehicles.
- Industrial: This segment contributes approximately 20% to the market, serving needs in power generation, automation, and heavy machinery where durability is key.
- Others: This segment encompasses niche applications and emerging sectors, contributing to the overall market diversification.
- UV Curing: Favored for speed and low-temperature processing in electronics manufacturing.
- Thermal Curing: Essential for applications requiring high mechanical strength and extreme temperature resistance, prevalent in aerospace and industrial settings.
Key Drivers of Silicon Potting Compound Growth
The growth of the silicon potting compound market is propelled by several key factors. The relentless advancement in the electronics industry, driven by miniaturization and the proliferation of IoT devices, necessitates robust protection solutions. The automotive sector's rapid electrification, with the increasing complexity of EV powertrains and battery systems, creates substantial demand. Furthermore, the aerospace and defense industries' stringent performance requirements for reliability in extreme conditions contribute significantly. Technological innovations leading to improved thermal management, faster curing, and enhanced flexibility are also crucial growth catalysts. Supportive government initiatives promoting advanced manufacturing and green technologies indirectly boost the market by encouraging the adoption of high-performance materials.
Challenges in the Silicon Potting Compound Sector
Despite robust growth, the silicon potting compound sector faces several challenges. Price volatility of raw materials, particularly silicon and its derivatives, can impact manufacturing costs and profit margins. Stringent environmental regulations and compliance requirements (e.g., VOC emissions, hazardous substance restrictions) necessitate ongoing R&D and can increase product development costs. Intense competition from alternative encapsulation materials like epoxies and polyurethanes, which may offer cost advantages in certain applications, poses a constant threat. Supply chain disruptions, exacerbated by global geopolitical events or natural disasters, can impact the availability and cost of key raw materials and finished products.
Emerging Opportunities in Silicon Potting Compound
Emerging opportunities for silicon potting compounds are abundant. The growth of 5G technology and advanced telecommunications infrastructure requires specialized potting solutions for high-frequency electronic components. The expansion of the renewable energy sector, particularly solar and wind power, creates demand for robust and weather-resistant encapsulation materials. The increasing adoption of advanced medical devices, demanding biocompatibility and high reliability, presents a lucrative niche. Furthermore, the development of sustainable and bio-based silicones aligns with growing environmental consciousness and can open new market segments.
Leading Players in the Silicon Potting Compound Market
Henkel Dow Corning Novagard Solutions LORD ELANTAS Master Bond MG Chemicals Dymax Corporation Noelle Industries Elkem ASA Robnor ResinLab Ltd Huntsman International
Key Developments in Silicon Potting Compound Industry
- 2023/09: Henkel launches a new line of fast-curing, thermally conductive silicones for EV battery applications.
- 2023/05: Dow Corning (a Dow company) announces expanded manufacturing capacity for specialized silicones to meet growing demand in the electronics sector.
- 2022/11: Novagard Solutions introduces a low-VOC, UV-curable silicon potting compound for rapid assembly of medical devices.
- 2022/07: LORD Corporation develops a high-performance, flame-retardant silicon potting compound for aerospace electronics.
- 2021/12: ELANTAS introduces a new series of silicon potting compounds with enhanced electrical insulation properties for high-voltage industrial applications.
- 2021/04: Master Bond unveils a new one-component, room-temperature vulcanizing (RTV) silicon potting compound with excellent adhesion to various plastics.
- 2020/10: Dymax Corporation expands its portfolio with a new rapid-cure, low-viscosity silicon potting compound for automated dispensing in electronics.
- 2020/03: Elkem ASA announces a strategic partnership to develop advanced silicone materials for the renewable energy sector.
- 2019/08: Robnor ResinLab Ltd launches a new range of halogen-free silicon potting compounds to meet stricter environmental regulations.
- 2019/01: Huntsman International acquires a company specializing in advanced silicone technologies, bolstering its position in the potting compound market.
Strategic Outlook for Silicon Potting Compound Market
The strategic outlook for the silicon potting compound market is exceptionally positive, driven by ongoing technological innovation and expanding application horizons. Key growth catalysts include the continued electrification of vehicles, the rapid expansion of 5G networks, and the increasing demand for reliable electronics in challenging environments such as aerospace and industrial automation. Manufacturers are strategically focusing on developing high-performance, specialized formulations, including those with superior thermal management, enhanced flexibility, and faster curing capabilities, to cater to evolving industry needs. Furthermore, sustainability is emerging as a critical strategic imperative, with opportunities for developing eco-friendly and bio-based silicon potting compounds gaining traction. Mergers, acquisitions, and strategic partnerships will continue to shape the market landscape, enabling companies to enhance their technological offerings and expand their global reach.
Silicon Potting Compound Segmentation
-
1. Application
- 1.1. Electronics
- 1.2. Aerospace
- 1.3. Automotive
- 1.4. Industrial
- 1.5. Others
-
2. Types
- 2.1. UV
- 2.2. Thermal
Silicon Potting Compound Segmentation By Geography
-
1. North America
- 1.1. United States
- 1.2. Canada
- 1.3. Mexico
-
2. South America
- 2.1. Brazil
- 2.2. Argentina
- 2.3. Rest of South America
-
3. Europe
- 3.1. United Kingdom
- 3.2. Germany
- 3.3. France
- 3.4. Italy
- 3.5. Spain
- 3.6. Russia
- 3.7. Benelux
- 3.8. Nordics
- 3.9. Rest of Europe
-
4. Middle East & Africa
- 4.1. Turkey
- 4.2. Israel
- 4.3. GCC
- 4.4. North Africa
- 4.5. South Africa
- 4.6. Rest of Middle East & Africa
-
5. Asia Pacific
- 5.1. China
- 5.2. India
- 5.3. Japan
- 5.4. South Korea
- 5.5. ASEAN
- 5.6. Oceania
- 5.7. Rest of Asia Pacific
Silicon Potting Compound Regional Market Share
Geographic Coverage of Silicon Potting Compound
Silicon Potting Compound REPORT HIGHLIGHTS
| Aspects | Details |
|---|---|
| Study Period | 2020-2034 |
| Base Year | 2025 |
| Estimated Year | 2026 |
| Forecast Period | 2026-2034 |
| Historical Period | 2020-2025 |
| Growth Rate | CAGR of 3.12% from 2020-2034 |
| Segmentation |
|
Table of Contents
- 1. Introduction
- 1.1. Research Scope
- 1.2. Market Segmentation
- 1.3. Research Methodology
- 1.4. Definitions and Assumptions
- 2. Executive Summary
- 2.1. Introduction
- 3. Market Dynamics
- 3.1. Introduction
- 3.2. Market Drivers
- 3.3. Market Restrains
- 3.4. Market Trends
- 4. Market Factor Analysis
- 4.1. Porters Five Forces
- 4.2. Supply/Value Chain
- 4.3. PESTEL analysis
- 4.4. Market Entropy
- 4.5. Patent/Trademark Analysis
- 5. Global Silicon Potting Compound Analysis, Insights and Forecast, 2020-2032
- 5.1. Market Analysis, Insights and Forecast - by Application
- 5.1.1. Electronics
- 5.1.2. Aerospace
- 5.1.3. Automotive
- 5.1.4. Industrial
- 5.1.5. Others
- 5.2. Market Analysis, Insights and Forecast - by Types
- 5.2.1. UV
- 5.2.2. Thermal
- 5.3. Market Analysis, Insights and Forecast - by Region
- 5.3.1. North America
- 5.3.2. South America
- 5.3.3. Europe
- 5.3.4. Middle East & Africa
- 5.3.5. Asia Pacific
- 5.1. Market Analysis, Insights and Forecast - by Application
- 6. North America Silicon Potting Compound Analysis, Insights and Forecast, 2020-2032
- 6.1. Market Analysis, Insights and Forecast - by Application
- 6.1.1. Electronics
- 6.1.2. Aerospace
- 6.1.3. Automotive
- 6.1.4. Industrial
- 6.1.5. Others
- 6.2. Market Analysis, Insights and Forecast - by Types
- 6.2.1. UV
- 6.2.2. Thermal
- 6.1. Market Analysis, Insights and Forecast - by Application
- 7. South America Silicon Potting Compound Analysis, Insights and Forecast, 2020-2032
- 7.1. Market Analysis, Insights and Forecast - by Application
- 7.1.1. Electronics
- 7.1.2. Aerospace
- 7.1.3. Automotive
- 7.1.4. Industrial
- 7.1.5. Others
- 7.2. Market Analysis, Insights and Forecast - by Types
- 7.2.1. UV
- 7.2.2. Thermal
- 7.1. Market Analysis, Insights and Forecast - by Application
- 8. Europe Silicon Potting Compound Analysis, Insights and Forecast, 2020-2032
- 8.1. Market Analysis, Insights and Forecast - by Application
- 8.1.1. Electronics
- 8.1.2. Aerospace
- 8.1.3. Automotive
- 8.1.4. Industrial
- 8.1.5. Others
- 8.2. Market Analysis, Insights and Forecast - by Types
- 8.2.1. UV
- 8.2.2. Thermal
- 8.1. Market Analysis, Insights and Forecast - by Application
- 9. Middle East & Africa Silicon Potting Compound Analysis, Insights and Forecast, 2020-2032
- 9.1. Market Analysis, Insights and Forecast - by Application
- 9.1.1. Electronics
- 9.1.2. Aerospace
- 9.1.3. Automotive
- 9.1.4. Industrial
- 9.1.5. Others
- 9.2. Market Analysis, Insights and Forecast - by Types
- 9.2.1. UV
- 9.2.2. Thermal
- 9.1. Market Analysis, Insights and Forecast - by Application
- 10. Asia Pacific Silicon Potting Compound Analysis, Insights and Forecast, 2020-2032
- 10.1. Market Analysis, Insights and Forecast - by Application
- 10.1.1. Electronics
- 10.1.2. Aerospace
- 10.1.3. Automotive
- 10.1.4. Industrial
- 10.1.5. Others
- 10.2. Market Analysis, Insights and Forecast - by Types
- 10.2.1. UV
- 10.2.2. Thermal
- 10.1. Market Analysis, Insights and Forecast - by Application
- 11. Competitive Analysis
- 11.1. Global Market Share Analysis 2025
- 11.2. Company Profiles
- 11.2.1 Henkel
- 11.2.1.1. Overview
- 11.2.1.2. Products
- 11.2.1.3. SWOT Analysis
- 11.2.1.4. Recent Developments
- 11.2.1.5. Financials (Based on Availability)
- 11.2.2 Dow Corning
- 11.2.2.1. Overview
- 11.2.2.2. Products
- 11.2.2.3. SWOT Analysis
- 11.2.2.4. Recent Developments
- 11.2.2.5. Financials (Based on Availability)
- 11.2.3 Novagard Solutions
- 11.2.3.1. Overview
- 11.2.3.2. Products
- 11.2.3.3. SWOT Analysis
- 11.2.3.4. Recent Developments
- 11.2.3.5. Financials (Based on Availability)
- 11.2.4 LORD
- 11.2.4.1. Overview
- 11.2.4.2. Products
- 11.2.4.3. SWOT Analysis
- 11.2.4.4. Recent Developments
- 11.2.4.5. Financials (Based on Availability)
- 11.2.5 ELANTAS
- 11.2.5.1. Overview
- 11.2.5.2. Products
- 11.2.5.3. SWOT Analysis
- 11.2.5.4. Recent Developments
- 11.2.5.5. Financials (Based on Availability)
- 11.2.6 Master Bond
- 11.2.6.1. Overview
- 11.2.6.2. Products
- 11.2.6.3. SWOT Analysis
- 11.2.6.4. Recent Developments
- 11.2.6.5. Financials (Based on Availability)
- 11.2.7 MG Chemicals
- 11.2.7.1. Overview
- 11.2.7.2. Products
- 11.2.7.3. SWOT Analysis
- 11.2.7.4. Recent Developments
- 11.2.7.5. Financials (Based on Availability)
- 11.2.8 Dymax Corporation
- 11.2.8.1. Overview
- 11.2.8.2. Products
- 11.2.8.3. SWOT Analysis
- 11.2.8.4. Recent Developments
- 11.2.8.5. Financials (Based on Availability)
- 11.2.9 Noelle Industries
- 11.2.9.1. Overview
- 11.2.9.2. Products
- 11.2.9.3. SWOT Analysis
- 11.2.9.4. Recent Developments
- 11.2.9.5. Financials (Based on Availability)
- 11.2.10 Elkem ASA
- 11.2.10.1. Overview
- 11.2.10.2. Products
- 11.2.10.3. SWOT Analysis
- 11.2.10.4. Recent Developments
- 11.2.10.5. Financials (Based on Availability)
- 11.2.11 Robnor ResinLab Ltd
- 11.2.11.1. Overview
- 11.2.11.2. Products
- 11.2.11.3. SWOT Analysis
- 11.2.11.4. Recent Developments
- 11.2.11.5. Financials (Based on Availability)
- 11.2.12 Huntsman International
- 11.2.12.1. Overview
- 11.2.12.2. Products
- 11.2.12.3. SWOT Analysis
- 11.2.12.4. Recent Developments
- 11.2.12.5. Financials (Based on Availability)
- 11.2.1 Henkel
List of Figures
- Figure 1: Global Silicon Potting Compound Revenue Breakdown (billion, %) by Region 2025 & 2033
- Figure 2: Global Silicon Potting Compound Volume Breakdown (K, %) by Region 2025 & 2033
- Figure 3: North America Silicon Potting Compound Revenue (billion), by Application 2025 & 2033
- Figure 4: North America Silicon Potting Compound Volume (K), by Application 2025 & 2033
- Figure 5: North America Silicon Potting Compound Revenue Share (%), by Application 2025 & 2033
- Figure 6: North America Silicon Potting Compound Volume Share (%), by Application 2025 & 2033
- Figure 7: North America Silicon Potting Compound Revenue (billion), by Types 2025 & 2033
- Figure 8: North America Silicon Potting Compound Volume (K), by Types 2025 & 2033
- Figure 9: North America Silicon Potting Compound Revenue Share (%), by Types 2025 & 2033
- Figure 10: North America Silicon Potting Compound Volume Share (%), by Types 2025 & 2033
- Figure 11: North America Silicon Potting Compound Revenue (billion), by Country 2025 & 2033
- Figure 12: North America Silicon Potting Compound Volume (K), by Country 2025 & 2033
- Figure 13: North America Silicon Potting Compound Revenue Share (%), by Country 2025 & 2033
- Figure 14: North America Silicon Potting Compound Volume Share (%), by Country 2025 & 2033
- Figure 15: South America Silicon Potting Compound Revenue (billion), by Application 2025 & 2033
- Figure 16: South America Silicon Potting Compound Volume (K), by Application 2025 & 2033
- Figure 17: South America Silicon Potting Compound Revenue Share (%), by Application 2025 & 2033
- Figure 18: South America Silicon Potting Compound Volume Share (%), by Application 2025 & 2033
- Figure 19: South America Silicon Potting Compound Revenue (billion), by Types 2025 & 2033
- Figure 20: South America Silicon Potting Compound Volume (K), by Types 2025 & 2033
- Figure 21: South America Silicon Potting Compound Revenue Share (%), by Types 2025 & 2033
- Figure 22: South America Silicon Potting Compound Volume Share (%), by Types 2025 & 2033
- Figure 23: South America Silicon Potting Compound Revenue (billion), by Country 2025 & 2033
- Figure 24: South America Silicon Potting Compound Volume (K), by Country 2025 & 2033
- Figure 25: South America Silicon Potting Compound Revenue Share (%), by Country 2025 & 2033
- Figure 26: South America Silicon Potting Compound Volume Share (%), by Country 2025 & 2033
- Figure 27: Europe Silicon Potting Compound Revenue (billion), by Application 2025 & 2033
- Figure 28: Europe Silicon Potting Compound Volume (K), by Application 2025 & 2033
- Figure 29: Europe Silicon Potting Compound Revenue Share (%), by Application 2025 & 2033
- Figure 30: Europe Silicon Potting Compound Volume Share (%), by Application 2025 & 2033
- Figure 31: Europe Silicon Potting Compound Revenue (billion), by Types 2025 & 2033
- Figure 32: Europe Silicon Potting Compound Volume (K), by Types 2025 & 2033
- Figure 33: Europe Silicon Potting Compound Revenue Share (%), by Types 2025 & 2033
- Figure 34: Europe Silicon Potting Compound Volume Share (%), by Types 2025 & 2033
- Figure 35: Europe Silicon Potting Compound Revenue (billion), by Country 2025 & 2033
- Figure 36: Europe Silicon Potting Compound Volume (K), by Country 2025 & 2033
- Figure 37: Europe Silicon Potting Compound Revenue Share (%), by Country 2025 & 2033
- Figure 38: Europe Silicon Potting Compound Volume Share (%), by Country 2025 & 2033
- Figure 39: Middle East & Africa Silicon Potting Compound Revenue (billion), by Application 2025 & 2033
- Figure 40: Middle East & Africa Silicon Potting Compound Volume (K), by Application 2025 & 2033
- Figure 41: Middle East & Africa Silicon Potting Compound Revenue Share (%), by Application 2025 & 2033
- Figure 42: Middle East & Africa Silicon Potting Compound Volume Share (%), by Application 2025 & 2033
- Figure 43: Middle East & Africa Silicon Potting Compound Revenue (billion), by Types 2025 & 2033
- Figure 44: Middle East & Africa Silicon Potting Compound Volume (K), by Types 2025 & 2033
- Figure 45: Middle East & Africa Silicon Potting Compound Revenue Share (%), by Types 2025 & 2033
- Figure 46: Middle East & Africa Silicon Potting Compound Volume Share (%), by Types 2025 & 2033
- Figure 47: Middle East & Africa Silicon Potting Compound Revenue (billion), by Country 2025 & 2033
- Figure 48: Middle East & Africa Silicon Potting Compound Volume (K), by Country 2025 & 2033
- Figure 49: Middle East & Africa Silicon Potting Compound Revenue Share (%), by Country 2025 & 2033
- Figure 50: Middle East & Africa Silicon Potting Compound Volume Share (%), by Country 2025 & 2033
- Figure 51: Asia Pacific Silicon Potting Compound Revenue (billion), by Application 2025 & 2033
- Figure 52: Asia Pacific Silicon Potting Compound Volume (K), by Application 2025 & 2033
- Figure 53: Asia Pacific Silicon Potting Compound Revenue Share (%), by Application 2025 & 2033
- Figure 54: Asia Pacific Silicon Potting Compound Volume Share (%), by Application 2025 & 2033
- Figure 55: Asia Pacific Silicon Potting Compound Revenue (billion), by Types 2025 & 2033
- Figure 56: Asia Pacific Silicon Potting Compound Volume (K), by Types 2025 & 2033
- Figure 57: Asia Pacific Silicon Potting Compound Revenue Share (%), by Types 2025 & 2033
- Figure 58: Asia Pacific Silicon Potting Compound Volume Share (%), by Types 2025 & 2033
- Figure 59: Asia Pacific Silicon Potting Compound Revenue (billion), by Country 2025 & 2033
- Figure 60: Asia Pacific Silicon Potting Compound Volume (K), by Country 2025 & 2033
- Figure 61: Asia Pacific Silicon Potting Compound Revenue Share (%), by Country 2025 & 2033
- Figure 62: Asia Pacific Silicon Potting Compound Volume Share (%), by Country 2025 & 2033
List of Tables
- Table 1: Global Silicon Potting Compound Revenue billion Forecast, by Application 2020 & 2033
- Table 2: Global Silicon Potting Compound Volume K Forecast, by Application 2020 & 2033
- Table 3: Global Silicon Potting Compound Revenue billion Forecast, by Types 2020 & 2033
- Table 4: Global Silicon Potting Compound Volume K Forecast, by Types 2020 & 2033
- Table 5: Global Silicon Potting Compound Revenue billion Forecast, by Region 2020 & 2033
- Table 6: Global Silicon Potting Compound Volume K Forecast, by Region 2020 & 2033
- Table 7: Global Silicon Potting Compound Revenue billion Forecast, by Application 2020 & 2033
- Table 8: Global Silicon Potting Compound Volume K Forecast, by Application 2020 & 2033
- Table 9: Global Silicon Potting Compound Revenue billion Forecast, by Types 2020 & 2033
- Table 10: Global Silicon Potting Compound Volume K Forecast, by Types 2020 & 2033
- Table 11: Global Silicon Potting Compound Revenue billion Forecast, by Country 2020 & 2033
- Table 12: Global Silicon Potting Compound Volume K Forecast, by Country 2020 & 2033
- Table 13: United States Silicon Potting Compound Revenue (billion) Forecast, by Application 2020 & 2033
- Table 14: United States Silicon Potting Compound Volume (K) Forecast, by Application 2020 & 2033
- Table 15: Canada Silicon Potting Compound Revenue (billion) Forecast, by Application 2020 & 2033
- Table 16: Canada Silicon Potting Compound Volume (K) Forecast, by Application 2020 & 2033
- Table 17: Mexico Silicon Potting Compound Revenue (billion) Forecast, by Application 2020 & 2033
- Table 18: Mexico Silicon Potting Compound Volume (K) Forecast, by Application 2020 & 2033
- Table 19: Global Silicon Potting Compound Revenue billion Forecast, by Application 2020 & 2033
- Table 20: Global Silicon Potting Compound Volume K Forecast, by Application 2020 & 2033
- Table 21: Global Silicon Potting Compound Revenue billion Forecast, by Types 2020 & 2033
- Table 22: Global Silicon Potting Compound Volume K Forecast, by Types 2020 & 2033
- Table 23: Global Silicon Potting Compound Revenue billion Forecast, by Country 2020 & 2033
- Table 24: Global Silicon Potting Compound Volume K Forecast, by Country 2020 & 2033
- Table 25: Brazil Silicon Potting Compound Revenue (billion) Forecast, by Application 2020 & 2033
- Table 26: Brazil Silicon Potting Compound Volume (K) Forecast, by Application 2020 & 2033
- Table 27: Argentina Silicon Potting Compound Revenue (billion) Forecast, by Application 2020 & 2033
- Table 28: Argentina Silicon Potting Compound Volume (K) Forecast, by Application 2020 & 2033
- Table 29: Rest of South America Silicon Potting Compound Revenue (billion) Forecast, by Application 2020 & 2033
- Table 30: Rest of South America Silicon Potting Compound Volume (K) Forecast, by Application 2020 & 2033
- Table 31: Global Silicon Potting Compound Revenue billion Forecast, by Application 2020 & 2033
- Table 32: Global Silicon Potting Compound Volume K Forecast, by Application 2020 & 2033
- Table 33: Global Silicon Potting Compound Revenue billion Forecast, by Types 2020 & 2033
- Table 34: Global Silicon Potting Compound Volume K Forecast, by Types 2020 & 2033
- Table 35: Global Silicon Potting Compound Revenue billion Forecast, by Country 2020 & 2033
- Table 36: Global Silicon Potting Compound Volume K Forecast, by Country 2020 & 2033
- Table 37: United Kingdom Silicon Potting Compound Revenue (billion) Forecast, by Application 2020 & 2033
- Table 38: United Kingdom Silicon Potting Compound Volume (K) Forecast, by Application 2020 & 2033
- Table 39: Germany Silicon Potting Compound Revenue (billion) Forecast, by Application 2020 & 2033
- Table 40: Germany Silicon Potting Compound Volume (K) Forecast, by Application 2020 & 2033
- Table 41: France Silicon Potting Compound Revenue (billion) Forecast, by Application 2020 & 2033
- Table 42: France Silicon Potting Compound Volume (K) Forecast, by Application 2020 & 2033
- Table 43: Italy Silicon Potting Compound Revenue (billion) Forecast, by Application 2020 & 2033
- Table 44: Italy Silicon Potting Compound Volume (K) Forecast, by Application 2020 & 2033
- Table 45: Spain Silicon Potting Compound Revenue (billion) Forecast, by Application 2020 & 2033
- Table 46: Spain Silicon Potting Compound Volume (K) Forecast, by Application 2020 & 2033
- Table 47: Russia Silicon Potting Compound Revenue (billion) Forecast, by Application 2020 & 2033
- Table 48: Russia Silicon Potting Compound Volume (K) Forecast, by Application 2020 & 2033
- Table 49: Benelux Silicon Potting Compound Revenue (billion) Forecast, by Application 2020 & 2033
- Table 50: Benelux Silicon Potting Compound Volume (K) Forecast, by Application 2020 & 2033
- Table 51: Nordics Silicon Potting Compound Revenue (billion) Forecast, by Application 2020 & 2033
- Table 52: Nordics Silicon Potting Compound Volume (K) Forecast, by Application 2020 & 2033
- Table 53: Rest of Europe Silicon Potting Compound Revenue (billion) Forecast, by Application 2020 & 2033
- Table 54: Rest of Europe Silicon Potting Compound Volume (K) Forecast, by Application 2020 & 2033
- Table 55: Global Silicon Potting Compound Revenue billion Forecast, by Application 2020 & 2033
- Table 56: Global Silicon Potting Compound Volume K Forecast, by Application 2020 & 2033
- Table 57: Global Silicon Potting Compound Revenue billion Forecast, by Types 2020 & 2033
- Table 58: Global Silicon Potting Compound Volume K Forecast, by Types 2020 & 2033
- Table 59: Global Silicon Potting Compound Revenue billion Forecast, by Country 2020 & 2033
- Table 60: Global Silicon Potting Compound Volume K Forecast, by Country 2020 & 2033
- Table 61: Turkey Silicon Potting Compound Revenue (billion) Forecast, by Application 2020 & 2033
- Table 62: Turkey Silicon Potting Compound Volume (K) Forecast, by Application 2020 & 2033
- Table 63: Israel Silicon Potting Compound Revenue (billion) Forecast, by Application 2020 & 2033
- Table 64: Israel Silicon Potting Compound Volume (K) Forecast, by Application 2020 & 2033
- Table 65: GCC Silicon Potting Compound Revenue (billion) Forecast, by Application 2020 & 2033
- Table 66: GCC Silicon Potting Compound Volume (K) Forecast, by Application 2020 & 2033
- Table 67: North Africa Silicon Potting Compound Revenue (billion) Forecast, by Application 2020 & 2033
- Table 68: North Africa Silicon Potting Compound Volume (K) Forecast, by Application 2020 & 2033
- Table 69: South Africa Silicon Potting Compound Revenue (billion) Forecast, by Application 2020 & 2033
- Table 70: South Africa Silicon Potting Compound Volume (K) Forecast, by Application 2020 & 2033
- Table 71: Rest of Middle East & Africa Silicon Potting Compound Revenue (billion) Forecast, by Application 2020 & 2033
- Table 72: Rest of Middle East & Africa Silicon Potting Compound Volume (K) Forecast, by Application 2020 & 2033
- Table 73: Global Silicon Potting Compound Revenue billion Forecast, by Application 2020 & 2033
- Table 74: Global Silicon Potting Compound Volume K Forecast, by Application 2020 & 2033
- Table 75: Global Silicon Potting Compound Revenue billion Forecast, by Types 2020 & 2033
- Table 76: Global Silicon Potting Compound Volume K Forecast, by Types 2020 & 2033
- Table 77: Global Silicon Potting Compound Revenue billion Forecast, by Country 2020 & 2033
- Table 78: Global Silicon Potting Compound Volume K Forecast, by Country 2020 & 2033
- Table 79: China Silicon Potting Compound Revenue (billion) Forecast, by Application 2020 & 2033
- Table 80: China Silicon Potting Compound Volume (K) Forecast, by Application 2020 & 2033
- Table 81: India Silicon Potting Compound Revenue (billion) Forecast, by Application 2020 & 2033
- Table 82: India Silicon Potting Compound Volume (K) Forecast, by Application 2020 & 2033
- Table 83: Japan Silicon Potting Compound Revenue (billion) Forecast, by Application 2020 & 2033
- Table 84: Japan Silicon Potting Compound Volume (K) Forecast, by Application 2020 & 2033
- Table 85: South Korea Silicon Potting Compound Revenue (billion) Forecast, by Application 2020 & 2033
- Table 86: South Korea Silicon Potting Compound Volume (K) Forecast, by Application 2020 & 2033
- Table 87: ASEAN Silicon Potting Compound Revenue (billion) Forecast, by Application 2020 & 2033
- Table 88: ASEAN Silicon Potting Compound Volume (K) Forecast, by Application 2020 & 2033
- Table 89: Oceania Silicon Potting Compound Revenue (billion) Forecast, by Application 2020 & 2033
- Table 90: Oceania Silicon Potting Compound Volume (K) Forecast, by Application 2020 & 2033
- Table 91: Rest of Asia Pacific Silicon Potting Compound Revenue (billion) Forecast, by Application 2020 & 2033
- Table 92: Rest of Asia Pacific Silicon Potting Compound Volume (K) Forecast, by Application 2020 & 2033
Frequently Asked Questions
1. What is the projected Compound Annual Growth Rate (CAGR) of the Silicon Potting Compound?
The projected CAGR is approximately 3.12%.
2. Which companies are prominent players in the Silicon Potting Compound?
Key companies in the market include Henkel, Dow Corning, Novagard Solutions, LORD, ELANTAS, Master Bond, MG Chemicals, Dymax Corporation, Noelle Industries, Elkem ASA, Robnor ResinLab Ltd, Huntsman International.
3. What are the main segments of the Silicon Potting Compound?
The market segments include Application, Types.
4. Can you provide details about the market size?
The market size is estimated to be USD 33.15 billion as of 2022.
5. What are some drivers contributing to market growth?
N/A
6. What are the notable trends driving market growth?
N/A
7. Are there any restraints impacting market growth?
N/A
8. Can you provide examples of recent developments in the market?
N/A
9. What pricing options are available for accessing the report?
Pricing options include single-user, multi-user, and enterprise licenses priced at USD 3350.00, USD 5025.00, and USD 6700.00 respectively.
10. Is the market size provided in terms of value or volume?
The market size is provided in terms of value, measured in billion and volume, measured in K.
11. Are there any specific market keywords associated with the report?
Yes, the market keyword associated with the report is "Silicon Potting Compound," which aids in identifying and referencing the specific market segment covered.
12. How do I determine which pricing option suits my needs best?
The pricing options vary based on user requirements and access needs. Individual users may opt for single-user licenses, while businesses requiring broader access may choose multi-user or enterprise licenses for cost-effective access to the report.
13. Are there any additional resources or data provided in the Silicon Potting Compound report?
While the report offers comprehensive insights, it's advisable to review the specific contents or supplementary materials provided to ascertain if additional resources or data are available.
14. How can I stay updated on further developments or reports in the Silicon Potting Compound?
To stay informed about further developments, trends, and reports in the Silicon Potting Compound, consider subscribing to industry newsletters, following relevant companies and organizations, or regularly checking reputable industry news sources and publications.
Methodology
Step 1 - Identification of Relevant Samples Size from Population Database


Step 2 - Approaches for Defining Global Market Size (Value, Volume* & Price*)

Note*: In applicable scenarios
Step 3 - Data Sources
Primary Research
- Web Analytics
- Survey Reports
- Research Institute
- Latest Research Reports
- Opinion Leaders
Secondary Research
- Annual Reports
- White Paper
- Latest Press Release
- Industry Association
- Paid Database
- Investor Presentations

Step 4 - Data Triangulation
Involves using different sources of information in order to increase the validity of a study
These sources are likely to be stakeholders in a program - participants, other researchers, program staff, other community members, and so on.
Then we put all data in single framework & apply various statistical tools to find out the dynamic on the market.
During the analysis stage, feedback from the stakeholder groups would be compared to determine areas of agreement as well as areas of divergence