

Key Insights
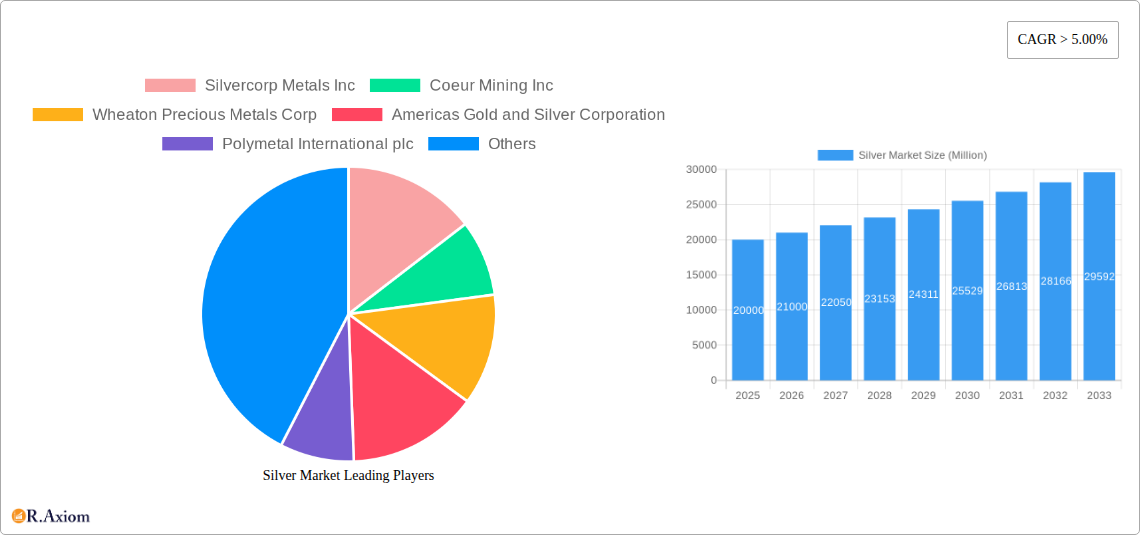
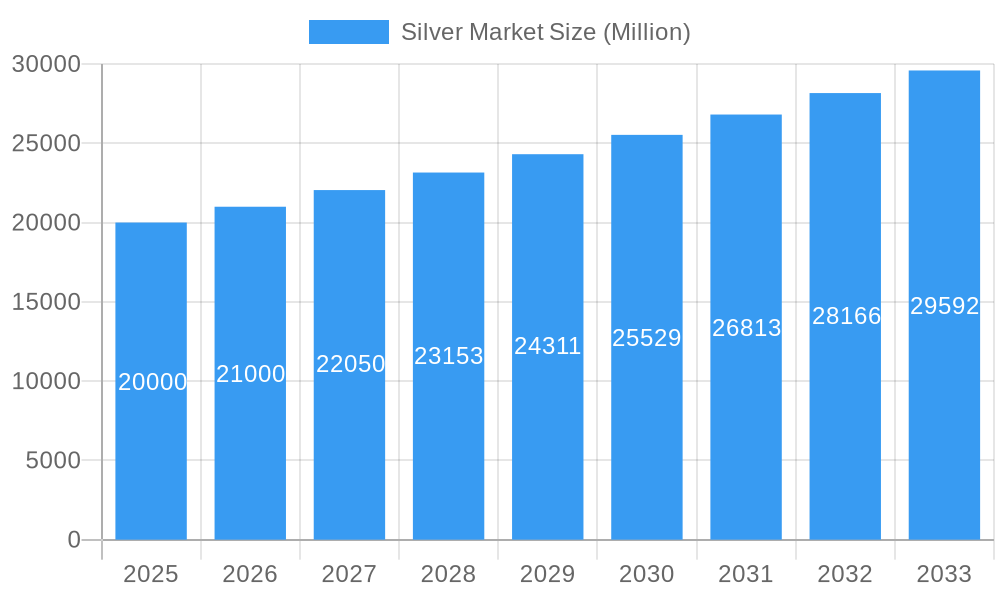
The global silver market, currently valued at approximately $XX million (estimated based on provided CAGR and market trends), exhibits robust growth potential, projected to maintain a Compound Annual Growth Rate (CAGR) exceeding 5% from 2025 to 2033. This expansion is fueled by several key drivers. The increasing demand from the electronics and electrical sectors, driven by the proliferation of smartphones, renewable energy technologies (solar panels), and electric vehicles, significantly contributes to silver's consumption. Furthermore, the jewelry and silverware sector remains a consistent consumer, while investment demand in physical silver bars fluctuates but remains a notable factor influencing overall market dynamics. Growth in the pharmaceutical industry, utilizing silver's antimicrobial properties, also provides a steady stream of demand. However, market growth is not without its challenges. Fluctuations in silver prices influenced by global economic conditions and supply chain vulnerabilities represent significant constraints. The successful navigation of these challenges will be pivotal in sustaining the market's projected growth trajectory.
Silver Market Market Size (In Billion)
Segment-wise analysis reveals a diverse market landscape. Fine silver, sterling silver, and argentium silver dominate the types segment, catering to diverse applications. The application segment shows the highest demand from physical investment (bars), electrical and electronics, followed by jewelry and silverware. Geographical analysis indicates a strong presence across North America, Europe, and Asia-Pacific, with China, India, and the United States emerging as key players. The competitive landscape is characterized by a mix of established mining companies like Silvercorp Metals Inc., Coeur Mining Inc., and Fresnillo plc, alongside smaller, specialized producers. The next decade will likely witness increased competition, driven by technological advancements in silver extraction and processing and the exploration of sustainable mining practices.
Silver Market Company Market Share
Silver Market: A Comprehensive Report (2019-2033)
This in-depth report provides a comprehensive analysis of the global silver market, covering historical data (2019-2024), the base year (2025), and forecasts until 2033. It delves into market segmentation, competitive dynamics, key drivers and challenges, and emerging opportunities, providing actionable insights for industry stakeholders. The report utilizes data from various sources and expert analysis to offer a holistic view of the market's evolution and future trajectory. The total market value is projected to reach xx Million by 2033.
Silver Market Market Concentration & Innovation
The silver market exhibits a moderately concentrated landscape, with a few major players holding significant market share. However, the presence of numerous smaller players ensures competitiveness. Innovation is driven by advancements in extraction technologies, improved refining processes, and the exploration of new applications for silver. Regulatory frameworks vary across regions, influencing production costs and environmental considerations. Substitute materials, such as copper and aluminum, pose a competitive threat in certain applications, while end-user trends towards sustainable and ethically sourced materials are creating new market niches.
- Market Concentration: The top 5 players account for approximately xx% of the global market share in 2025.
- M&A Activity: Significant M&A activity has been observed, with deal values exceeding xx Million in the past five years. The Pan American Silver Corp's acquisition of Yamana Gold, valued at USD 4.8 Billion in March 2023, exemplifies this trend.
- Innovation Drivers: Focus on automation in mining, nanotechnology applications, and development of recycled silver sources.
- Regulatory Landscape: Stringent environmental regulations impact mining operations and require companies to invest in sustainable practices.
Silver Market Industry Trends & Insights
The silver market is experiencing steady growth, driven by increasing demand from diverse sectors. The Compound Annual Growth Rate (CAGR) is projected to be xx% during the forecast period (2025-2033). Technological disruptions are transforming mining and refining processes, increasing efficiency and reducing costs. Consumer preferences for sustainable and ethically sourced silver are influencing the supply chain. Competitive dynamics are characterized by price fluctuations, technological advancements, and mergers and acquisitions. Market penetration of silver in emerging applications like electronics and pharmaceuticals is gradually increasing.
Dominant Markets & Segments in Silver Market
- Leading Region: The Americas, particularly Mexico and Peru, remain dominant due to significant silver reserves and established mining infrastructure.
- Dominant Types: Fine silver dominates the market due to its versatility and purity, followed by sterling silver and coin silver. Other types represent a smaller segment with specialized applications.
- Leading Applications: The physical investment segment (bars and coins) and the electrical and electronics sector are the leading applications of silver, accounting for the largest market share. Jewelry and silverware remain consistent high-volume applications.
Key Drivers:
- Economic Growth: Growing economies, particularly in Asia, drive increased demand for silver in various applications.
- Technological Advancements: Developments in electronics and renewable energy sectors enhance silver's usage.
- Government Policies: Supportive policies promoting sustainable mining and investments in infrastructure contribute to market growth.
Detailed dominance analysis reveals that the Americas benefit from established mining practices, vast reserves and favourable government policies. The dominance of fine silver is due to its superior properties in various applications, whilst the physical investment segment is driven by investor confidence and diversification strategies.
Silver Market Product Developments
Significant advancements in silver extraction, refining, and nanotechnology are shaping product innovation. New applications are emerging in solar energy, medical devices, and water purification. Companies are focusing on creating specialized silver alloys and formulations to improve functionality and performance in various sectors. The emphasis is on sustainability and responsible sourcing, aligning with growing consumer preference.
Report Scope & Segmentation Analysis
This report segments the silver market based on type (Fine Silver, Sterling Silver, Argentium Silver, Coin Silver, Other Types) and application (Physical Investment (bars), Electrical and Electronics, Photographic Films, Brazing Alloys, Jewelry and silverware, Pharmaceuticals, Other Applications). Each segment is analyzed individually, providing growth projections, market sizes, and competitive landscapes. For example, the Fine Silver segment is expected to witness a CAGR of xx% driven by its extensive use in electronics and investment. Similarly, the Jewelry and silverware segment shows xx% CAGR fuelled by growing demand from developing economies.
Key Drivers of Silver Market Growth
The silver market growth is fueled by several factors: increasing demand from the electronics and electrical sectors, growing investment in precious metals, the rising adoption of silver nanoparticles in various industrial applications, and technological innovations in silver extraction and processing. Government policies supporting mining and sustainable practices also contribute.
Challenges in the Silver Market Sector
The silver market faces challenges including price volatility influenced by macroeconomic factors, environmental regulations impacting mining operations, and supply chain complexities related to sourcing and processing. Competition from substitute materials and ethical sourcing concerns present further challenges. These factors can impact production costs and profitability.
Emerging Opportunities in Silver Market
Emerging opportunities include expanding applications in renewable energy (solar panels), advanced medical technologies (antimicrobial coatings), and water purification. Growth in emerging markets and increasing demand for sustainable and ethically sourced silver offer significant potential. Nanotechnology advancements are also opening up new areas of application.
Leading Players in the Silver Market Market
- Silvercorp Metals Inc
- Coeur Mining Inc
- Wheaton Precious Metals Corp
- Americas Gold and Silver Corporation
- Polymetal International plc
- Hindustan Zinc
- Avino Silver & Gold Mines Ltd
- MAG Silver Corp
- Fresnillo plc
- Industrias Peñoles
- Hecla Mining Company
- IMPACT Silver Corp
- Honey Badger Silver Inc
- Fortuna Silver Mines Inc
- Orla Mining Ltd
- First Majestic Silver Corp
- Royal Gold Inc
- Compañía de Minas Buenaventura S A A
- Pan American Silver Corp
Key Developments in Silver Market Industry
- March 2023: Pan American Silver Corp announced the USD 4.8 billion acquisition of all the issued and outstanding common shares of Yamana Gold, significantly expanding its silver reserves and production capacity.
- April 2023: Impact Silver Corp. completed the acquisition of the Plomosas zinc-lead-silver mine in Mexico for USD 6 million, boosting its silver production portfolio.
Strategic Outlook for Silver Market Market
The silver market is poised for continued growth, driven by robust demand across diverse sectors. Emerging technologies and increasing investment in renewable energy will further stimulate demand. Companies focusing on sustainable practices and innovative product development are well-positioned to capitalize on the market's future potential. The ongoing focus on technological advancements in extraction, refining, and application development will continue to drive growth and innovation within the sector.
Silver Market Segmentation
-
1. Type
- 1.1. Fine Silver
- 1.2. Sterling Silver
- 1.3. Argentium Silver
- 1.4. Coin Silver
- 1.5. Other Types
-
2. Application
- 2.1. Physical Investment (bars)
- 2.2. Electrical and Electronics
- 2.3. Photographic Films
- 2.4. Brazing Alloys
- 2.5. Jewelry and silverware
- 2.6. Pharmaceuticals
- 2.7. Other Applications
Silver Market Segmentation By Geography
- 1. India
- 2. China
- 3. Japan
- 4. South Korea
-
5. Rest of Asia Pacific
- 5.1. North America
- 6. United States
- 7. Canada
-
8. Mexico
- 8.1. Europe
- 9. Germany
- 10. United Kingdom
- 11. Italy
- 12. France
-
13. Rest of Europe
- 13.1. South America
- 14. Brazil
- 15. Argentina
-
16. Rest of South America
- 16.1. Middle East and Africa
- 17. Saudi Arabia
- 18. South Africa
- 19. Rest of Middle East and Africa
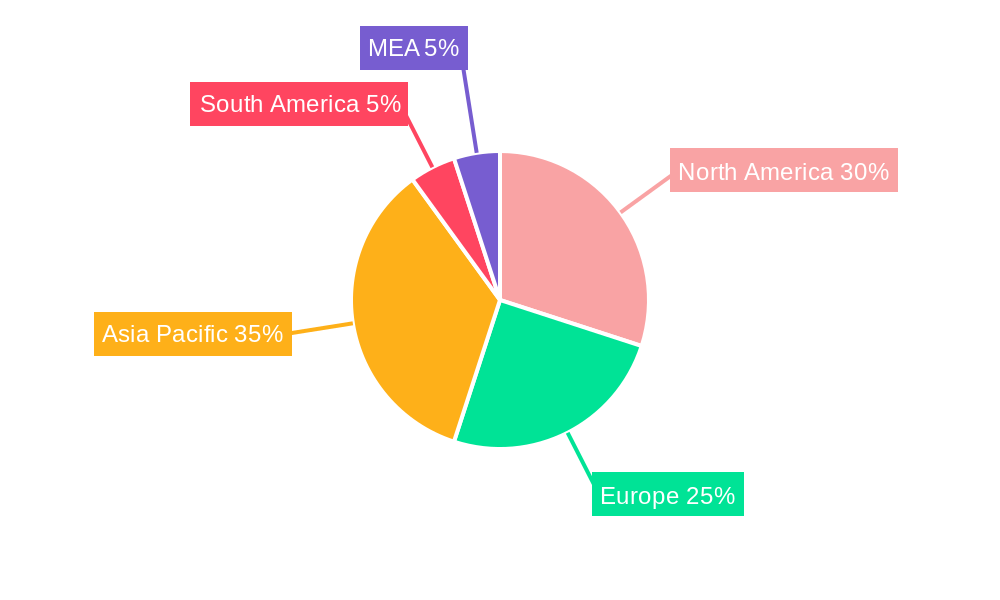
Silver Market Regional Market Share
Geographic Coverage of Silver Market
Silver Market REPORT HIGHLIGHTS
| Aspects | Details |
|---|---|
| Study Period | 2020-2034 |
| Base Year | 2025 |
| Estimated Year | 2026 |
| Forecast Period | 2026-2034 |
| Historical Period | 2020-2025 |
| Growth Rate | CAGR of 6.6% from 2020-2034 |
| Segmentation |
|
Table of Contents
- 1. Introduction
- 1.1. Research Scope
- 1.2. Market Segmentation
- 1.3. Research Objective
- 1.4. Definitions and Assumptions
- 2. Executive Summary
- 2.1. Market Snapshot
- 3. Market Dynamics
- 3.1. Market Drivers
- 3.2. Market Restrains
- 3.3. Market Trends
- 3.4. Market Opportunities
- 4. Market Factor Analysis
- 4.1. Porters Five Forces
- 4.1.1. Bargaining Power of Suppliers
- 4.1.2. Bargaining Power of Buyers
- 4.1.3. Threat of New Entrants
- 4.1.4. Threat of Substitutes
- 4.1.5. Competitive Rivalry
- 4.2. PESTEL analysis
- 4.3. BCG Analysis
- 4.3.1. Stars (High Growth, High Market Share)
- 4.3.2. Cash Cows (Low Growth, High Market Share)
- 4.3.3. Question Mark (High Growth, Low Market Share)
- 4.3.4. Dogs (Low Growth, Low Market Share)
- 4.4. Ansoff Matrix Analysis
- 4.5. Supply Chain Analysis
- 4.6. Regulatory Landscape
- 4.7. Current Market Potential and Opportunity Assessment (TAM–SAM–SOM Framework)
- 4.8. RAX Analyst Note
- 4.1. Porters Five Forces
- 5. Market Analysis, Insights and Forecast 2021-2033
- 5.1. Market Analysis, Insights and Forecast - by Type
- 5.1.1. Fine Silver
- 5.1.2. Sterling Silver
- 5.1.3. Argentium Silver
- 5.1.4. Coin Silver
- 5.1.5. Other Types
- 5.2. Market Analysis, Insights and Forecast - by Application
- 5.2.1. Physical Investment (bars)
- 5.2.2. Electrical and Electronics
- 5.2.3. Photographic Films
- 5.2.4. Brazing Alloys
- 5.2.5. Jewelry and silverware
- 5.2.6. Pharmaceuticals
- 5.2.7. Other Applications
- 5.3. Market Analysis, Insights and Forecast - by Region
- 5.3.1. India
- 5.3.2. China
- 5.3.3. Japan
- 5.3.4. South Korea
- 5.3.5. Rest of Asia Pacific
- 5.3.6. United States
- 5.3.7. Canada
- 5.3.8. Mexico
- 5.3.9. Germany
- 5.3.10. United Kingdom
- 5.3.11. Italy
- 5.3.12. France
- 5.3.13. Rest of Europe
- 5.3.14. Brazil
- 5.3.15. Argentina
- 5.3.16. Rest of South America
- 5.3.17. Saudi Arabia
- 5.3.18. South Africa
- 5.3.19. Rest of Middle East and Africa
- 5.1. Market Analysis, Insights and Forecast - by Type
- 6. Global Silver Market Analysis, Insights and Forecast, 2021-2033
- 6.1. Market Analysis, Insights and Forecast - by Type
- 6.1.1. Fine Silver
- 6.1.2. Sterling Silver
- 6.1.3. Argentium Silver
- 6.1.4. Coin Silver
- 6.1.5. Other Types
- 6.2. Market Analysis, Insights and Forecast - by Application
- 6.2.1. Physical Investment (bars)
- 6.2.2. Electrical and Electronics
- 6.2.3. Photographic Films
- 6.2.4. Brazing Alloys
- 6.2.5. Jewelry and silverware
- 6.2.6. Pharmaceuticals
- 6.2.7. Other Applications
- 6.1. Market Analysis, Insights and Forecast - by Type
- 7. India Silver Market Analysis, Insights and Forecast, 2020-2032
- 7.1. Market Analysis, Insights and Forecast - by Type
- 7.1.1. Fine Silver
- 7.1.2. Sterling Silver
- 7.1.3. Argentium Silver
- 7.1.4. Coin Silver
- 7.1.5. Other Types
- 7.2. Market Analysis, Insights and Forecast - by Application
- 7.2.1. Physical Investment (bars)
- 7.2.2. Electrical and Electronics
- 7.2.3. Photographic Films
- 7.2.4. Brazing Alloys
- 7.2.5. Jewelry and silverware
- 7.2.6. Pharmaceuticals
- 7.2.7. Other Applications
- 7.1. Market Analysis, Insights and Forecast - by Type
- 8. China Silver Market Analysis, Insights and Forecast, 2020-2032
- 8.1. Market Analysis, Insights and Forecast - by Type
- 8.1.1. Fine Silver
- 8.1.2. Sterling Silver
- 8.1.3. Argentium Silver
- 8.1.4. Coin Silver
- 8.1.5. Other Types
- 8.2. Market Analysis, Insights and Forecast - by Application
- 8.2.1. Physical Investment (bars)
- 8.2.2. Electrical and Electronics
- 8.2.3. Photographic Films
- 8.2.4. Brazing Alloys
- 8.2.5. Jewelry and silverware
- 8.2.6. Pharmaceuticals
- 8.2.7. Other Applications
- 8.1. Market Analysis, Insights and Forecast - by Type
- 9. Japan Silver Market Analysis, Insights and Forecast, 2020-2032
- 9.1. Market Analysis, Insights and Forecast - by Type
- 9.1.1. Fine Silver
- 9.1.2. Sterling Silver
- 9.1.3. Argentium Silver
- 9.1.4. Coin Silver
- 9.1.5. Other Types
- 9.2. Market Analysis, Insights and Forecast - by Application
- 9.2.1. Physical Investment (bars)
- 9.2.2. Electrical and Electronics
- 9.2.3. Photographic Films
- 9.2.4. Brazing Alloys
- 9.2.5. Jewelry and silverware
- 9.2.6. Pharmaceuticals
- 9.2.7. Other Applications
- 9.1. Market Analysis, Insights and Forecast - by Type
- 10. South Korea Silver Market Analysis, Insights and Forecast, 2020-2032
- 10.1. Market Analysis, Insights and Forecast - by Type
- 10.1.1. Fine Silver
- 10.1.2. Sterling Silver
- 10.1.3. Argentium Silver
- 10.1.4. Coin Silver
- 10.1.5. Other Types
- 10.2. Market Analysis, Insights and Forecast - by Application
- 10.2.1. Physical Investment (bars)
- 10.2.2. Electrical and Electronics
- 10.2.3. Photographic Films
- 10.2.4. Brazing Alloys
- 10.2.5. Jewelry and silverware
- 10.2.6. Pharmaceuticals
- 10.2.7. Other Applications
- 10.1. Market Analysis, Insights and Forecast - by Type
- 11. Rest of Asia Pacific Silver Market Analysis, Insights and Forecast, 2020-2032
- 11.1. Market Analysis, Insights and Forecast - by Type
- 11.1.1. Fine Silver
- 11.1.2. Sterling Silver
- 11.1.3. Argentium Silver
- 11.1.4. Coin Silver
- 11.1.5. Other Types
- 11.2. Market Analysis, Insights and Forecast - by Application
- 11.2.1. Physical Investment (bars)
- 11.2.2. Electrical and Electronics
- 11.2.3. Photographic Films
- 11.2.4. Brazing Alloys
- 11.2.5. Jewelry and silverware
- 11.2.6. Pharmaceuticals
- 11.2.7. Other Applications
- 11.1. Market Analysis, Insights and Forecast - by Type
- 12. United States Silver Market Analysis, Insights and Forecast, 2020-2032
- 12.1. Market Analysis, Insights and Forecast - by Type
- 12.1.1. Fine Silver
- 12.1.2. Sterling Silver
- 12.1.3. Argentium Silver
- 12.1.4. Coin Silver
- 12.1.5. Other Types
- 12.2. Market Analysis, Insights and Forecast - by Application
- 12.2.1. Physical Investment (bars)
- 12.2.2. Electrical and Electronics
- 12.2.3. Photographic Films
- 12.2.4. Brazing Alloys
- 12.2.5. Jewelry and silverware
- 12.2.6. Pharmaceuticals
- 12.2.7. Other Applications
- 12.1. Market Analysis, Insights and Forecast - by Type
- 13. Canada Silver Market Analysis, Insights and Forecast, 2020-2032
- 13.1. Market Analysis, Insights and Forecast - by Type
- 13.1.1. Fine Silver
- 13.1.2. Sterling Silver
- 13.1.3. Argentium Silver
- 13.1.4. Coin Silver
- 13.1.5. Other Types
- 13.2. Market Analysis, Insights and Forecast - by Application
- 13.2.1. Physical Investment (bars)
- 13.2.2. Electrical and Electronics
- 13.2.3. Photographic Films
- 13.2.4. Brazing Alloys
- 13.2.5. Jewelry and silverware
- 13.2.6. Pharmaceuticals
- 13.2.7. Other Applications
- 13.1. Market Analysis, Insights and Forecast - by Type
- 14. Mexico Silver Market Analysis, Insights and Forecast, 2020-2032
- 14.1. Market Analysis, Insights and Forecast - by Type
- 14.1.1. Fine Silver
- 14.1.2. Sterling Silver
- 14.1.3. Argentium Silver
- 14.1.4. Coin Silver
- 14.1.5. Other Types
- 14.2. Market Analysis, Insights and Forecast - by Application
- 14.2.1. Physical Investment (bars)
- 14.2.2. Electrical and Electronics
- 14.2.3. Photographic Films
- 14.2.4. Brazing Alloys
- 14.2.5. Jewelry and silverware
- 14.2.6. Pharmaceuticals
- 14.2.7. Other Applications
- 14.1. Market Analysis, Insights and Forecast - by Type
- 15. Germany Silver Market Analysis, Insights and Forecast, 2020-2032
- 15.1. Market Analysis, Insights and Forecast - by Type
- 15.1.1. Fine Silver
- 15.1.2. Sterling Silver
- 15.1.3. Argentium Silver
- 15.1.4. Coin Silver
- 15.1.5. Other Types
- 15.2. Market Analysis, Insights and Forecast - by Application
- 15.2.1. Physical Investment (bars)
- 15.2.2. Electrical and Electronics
- 15.2.3. Photographic Films
- 15.2.4. Brazing Alloys
- 15.2.5. Jewelry and silverware
- 15.2.6. Pharmaceuticals
- 15.2.7. Other Applications
- 15.1. Market Analysis, Insights and Forecast - by Type
- 16. United Kingdom Silver Market Analysis, Insights and Forecast, 2020-2032
- 16.1. Market Analysis, Insights and Forecast - by Type
- 16.1.1. Fine Silver
- 16.1.2. Sterling Silver
- 16.1.3. Argentium Silver
- 16.1.4. Coin Silver
- 16.1.5. Other Types
- 16.2. Market Analysis, Insights and Forecast - by Application
- 16.2.1. Physical Investment (bars)
- 16.2.2. Electrical and Electronics
- 16.2.3. Photographic Films
- 16.2.4. Brazing Alloys
- 16.2.5. Jewelry and silverware
- 16.2.6. Pharmaceuticals
- 16.2.7. Other Applications
- 16.1. Market Analysis, Insights and Forecast - by Type
- 17. Italy Silver Market Analysis, Insights and Forecast, 2020-2032
- 17.1. Market Analysis, Insights and Forecast - by Type
- 17.1.1. Fine Silver
- 17.1.2. Sterling Silver
- 17.1.3. Argentium Silver
- 17.1.4. Coin Silver
- 17.1.5. Other Types
- 17.2. Market Analysis, Insights and Forecast - by Application
- 17.2.1. Physical Investment (bars)
- 17.2.2. Electrical and Electronics
- 17.2.3. Photographic Films
- 17.2.4. Brazing Alloys
- 17.2.5. Jewelry and silverware
- 17.2.6. Pharmaceuticals
- 17.2.7. Other Applications
- 17.1. Market Analysis, Insights and Forecast - by Type
- 18. France Silver Market Analysis, Insights and Forecast, 2020-2032
- 18.1. Market Analysis, Insights and Forecast - by Type
- 18.1.1. Fine Silver
- 18.1.2. Sterling Silver
- 18.1.3. Argentium Silver
- 18.1.4. Coin Silver
- 18.1.5. Other Types
- 18.2. Market Analysis, Insights and Forecast - by Application
- 18.2.1. Physical Investment (bars)
- 18.2.2. Electrical and Electronics
- 18.2.3. Photographic Films
- 18.2.4. Brazing Alloys
- 18.2.5. Jewelry and silverware
- 18.2.6. Pharmaceuticals
- 18.2.7. Other Applications
- 18.1. Market Analysis, Insights and Forecast - by Type
- 19. Rest of Europe Silver Market Analysis, Insights and Forecast, 2020-2032
- 19.1. Market Analysis, Insights and Forecast - by Type
- 19.1.1. Fine Silver
- 19.1.2. Sterling Silver
- 19.1.3. Argentium Silver
- 19.1.4. Coin Silver
- 19.1.5. Other Types
- 19.2. Market Analysis, Insights and Forecast - by Application
- 19.2.1. Physical Investment (bars)
- 19.2.2. Electrical and Electronics
- 19.2.3. Photographic Films
- 19.2.4. Brazing Alloys
- 19.2.5. Jewelry and silverware
- 19.2.6. Pharmaceuticals
- 19.2.7. Other Applications
- 19.1. Market Analysis, Insights and Forecast - by Type
- 20. Brazil Silver Market Analysis, Insights and Forecast, 2020-2032
- 20.1. Market Analysis, Insights and Forecast - by Type
- 20.1.1. Fine Silver
- 20.1.2. Sterling Silver
- 20.1.3. Argentium Silver
- 20.1.4. Coin Silver
- 20.1.5. Other Types
- 20.2. Market Analysis, Insights and Forecast - by Application
- 20.2.1. Physical Investment (bars)
- 20.2.2. Electrical and Electronics
- 20.2.3. Photographic Films
- 20.2.4. Brazing Alloys
- 20.2.5. Jewelry and silverware
- 20.2.6. Pharmaceuticals
- 20.2.7. Other Applications
- 20.1. Market Analysis, Insights and Forecast - by Type
- 21. Argentina Silver Market Analysis, Insights and Forecast, 2020-2032
- 21.1. Market Analysis, Insights and Forecast - by Type
- 21.1.1. Fine Silver
- 21.1.2. Sterling Silver
- 21.1.3. Argentium Silver
- 21.1.4. Coin Silver
- 21.1.5. Other Types
- 21.2. Market Analysis, Insights and Forecast - by Application
- 21.2.1. Physical Investment (bars)
- 21.2.2. Electrical and Electronics
- 21.2.3. Photographic Films
- 21.2.4. Brazing Alloys
- 21.2.5. Jewelry and silverware
- 21.2.6. Pharmaceuticals
- 21.2.7. Other Applications
- 21.1. Market Analysis, Insights and Forecast - by Type
- 22. Rest of South America Silver Market Analysis, Insights and Forecast, 2020-2032
- 22.1. Market Analysis, Insights and Forecast - by Type
- 22.1.1. Fine Silver
- 22.1.2. Sterling Silver
- 22.1.3. Argentium Silver
- 22.1.4. Coin Silver
- 22.1.5. Other Types
- 22.2. Market Analysis, Insights and Forecast - by Application
- 22.2.1. Physical Investment (bars)
- 22.2.2. Electrical and Electronics
- 22.2.3. Photographic Films
- 22.2.4. Brazing Alloys
- 22.2.5. Jewelry and silverware
- 22.2.6. Pharmaceuticals
- 22.2.7. Other Applications
- 22.1. Market Analysis, Insights and Forecast - by Type
- 23. Saudi Arabia Silver Market Analysis, Insights and Forecast, 2020-2032
- 23.1. Market Analysis, Insights and Forecast - by Type
- 23.1.1. Fine Silver
- 23.1.2. Sterling Silver
- 23.1.3. Argentium Silver
- 23.1.4. Coin Silver
- 23.1.5. Other Types
- 23.2. Market Analysis, Insights and Forecast - by Application
- 23.2.1. Physical Investment (bars)
- 23.2.2. Electrical and Electronics
- 23.2.3. Photographic Films
- 23.2.4. Brazing Alloys
- 23.2.5. Jewelry and silverware
- 23.2.6. Pharmaceuticals
- 23.2.7. Other Applications
- 23.1. Market Analysis, Insights and Forecast - by Type
- 24. South Africa Silver Market Analysis, Insights and Forecast, 2020-2032
- 24.1. Market Analysis, Insights and Forecast - by Type
- 24.1.1. Fine Silver
- 24.1.2. Sterling Silver
- 24.1.3. Argentium Silver
- 24.1.4. Coin Silver
- 24.1.5. Other Types
- 24.2. Market Analysis, Insights and Forecast - by Application
- 24.2.1. Physical Investment (bars)
- 24.2.2. Electrical and Electronics
- 24.2.3. Photographic Films
- 24.2.4. Brazing Alloys
- 24.2.5. Jewelry and silverware
- 24.2.6. Pharmaceuticals
- 24.2.7. Other Applications
- 24.1. Market Analysis, Insights and Forecast - by Type
- 25. Rest of Middle East and Africa Silver Market Analysis, Insights and Forecast, 2020-2032
- 25.1. Market Analysis, Insights and Forecast - by Type
- 25.1.1. Fine Silver
- 25.1.2. Sterling Silver
- 25.1.3. Argentium Silver
- 25.1.4. Coin Silver
- 25.1.5. Other Types
- 25.2. Market Analysis, Insights and Forecast - by Application
- 25.2.1. Physical Investment (bars)
- 25.2.2. Electrical and Electronics
- 25.2.3. Photographic Films
- 25.2.4. Brazing Alloys
- 25.2.5. Jewelry and silverware
- 25.2.6. Pharmaceuticals
- 25.2.7. Other Applications
- 25.1. Market Analysis, Insights and Forecast - by Type
- 26. Competitive Analysis
- 26.1. Company Profiles
- 26.1.1 Silvercorp Metals Inc
- 26.1.1.1. Company Overview
- 26.1.1.2. Products
- 26.1.1.3. Company Financials
- 26.1.1.4. SWOT Analysis
- 26.1.2 Coeur Mining Inc
- 26.1.2.1. Company Overview
- 26.1.2.2. Products
- 26.1.2.3. Company Financials
- 26.1.2.4. SWOT Analysis
- 26.1.3 Wheaton Precious Metals Corp
- 26.1.3.1. Company Overview
- 26.1.3.2. Products
- 26.1.3.3. Company Financials
- 26.1.3.4. SWOT Analysis
- 26.1.4 Americas Gold and Silver Corporation
- 26.1.4.1. Company Overview
- 26.1.4.2. Products
- 26.1.4.3. Company Financials
- 26.1.4.4. SWOT Analysis
- 26.1.5 Polymetal International plc
- 26.1.5.1. Company Overview
- 26.1.5.2. Products
- 26.1.5.3. Company Financials
- 26.1.5.4. SWOT Analysis
- 26.1.6 Hindustan Zinc
- 26.1.6.1. Company Overview
- 26.1.6.2. Products
- 26.1.6.3. Company Financials
- 26.1.6.4. SWOT Analysis
- 26.1.7 Avino Silver & Gold Mines Ltd
- 26.1.7.1. Company Overview
- 26.1.7.2. Products
- 26.1.7.3. Company Financials
- 26.1.7.4. SWOT Analysis
- 26.1.8 MAG Silver Corp
- 26.1.8.1. Company Overview
- 26.1.8.2. Products
- 26.1.8.3. Company Financials
- 26.1.8.4. SWOT Analysis
- 26.1.9 Fresnillo plc
- 26.1.9.1. Company Overview
- 26.1.9.2. Products
- 26.1.9.3. Company Financials
- 26.1.9.4. SWOT Analysis
- 26.1.10 Industrias Peñoles
- 26.1.10.1. Company Overview
- 26.1.10.2. Products
- 26.1.10.3. Company Financials
- 26.1.10.4. SWOT Analysis
- 26.1.11 Hecla Mining Company
- 26.1.11.1. Company Overview
- 26.1.11.2. Products
- 26.1.11.3. Company Financials
- 26.1.11.4. SWOT Analysis
- 26.1.12 IMPACT Silver Corp
- 26.1.12.1. Company Overview
- 26.1.12.2. Products
- 26.1.12.3. Company Financials
- 26.1.12.4. SWOT Analysis
- 26.1.13 Honey Badger Silver Inc
- 26.1.13.1. Company Overview
- 26.1.13.2. Products
- 26.1.13.3. Company Financials
- 26.1.13.4. SWOT Analysis
- 26.1.14 Fortuna Silver Mines Inc
- 26.1.14.1. Company Overview
- 26.1.14.2. Products
- 26.1.14.3. Company Financials
- 26.1.14.4. SWOT Analysis
- 26.1.15 Orla Mining Ltd
- 26.1.15.1. Company Overview
- 26.1.15.2. Products
- 26.1.15.3. Company Financials
- 26.1.15.4. SWOT Analysis
- 26.1.16 First Majestic Silver Corp
- 26.1.16.1. Company Overview
- 26.1.16.2. Products
- 26.1.16.3. Company Financials
- 26.1.16.4. SWOT Analysis
- 26.1.17 Royal Gold Inc
- 26.1.17.1. Company Overview
- 26.1.17.2. Products
- 26.1.17.3. Company Financials
- 26.1.17.4. SWOT Analysis
- 26.1.18 Compañía de Minas Buenaventura S A A
- 26.1.18.1. Company Overview
- 26.1.18.2. Products
- 26.1.18.3. Company Financials
- 26.1.18.4. SWOT Analysis
- 26.1.19 Pan American Silver Corp
- 26.1.19.1. Company Overview
- 26.1.19.2. Products
- 26.1.19.3. Company Financials
- 26.1.19.4. SWOT Analysis
- 26.1.1 Silvercorp Metals Inc
- 26.2. Market Entropy
- 26.2.1 Company's Key Areas Served
- 26.2.2 Recent Developments
- 26.3. Company Market Share Analysis 2025
- 26.3.1 Top 5 Companies Market Share Analysis
- 26.3.2 Top 3 Companies Market Share Analysis
- 26.4. List of Potential Customers
- 27. Research Methodology
List of Figures
- Figure 1: Global Silver Market Revenue Breakdown (billion, %) by Region 2025 & 2033
- Figure 2: Global Silver Market Volume Breakdown (K Tons, %) by Region 2025 & 2033
- Figure 3: India Silver Market Revenue (billion), by Type 2025 & 2033
- Figure 4: India Silver Market Volume (K Tons), by Type 2025 & 2033
- Figure 5: India Silver Market Revenue Share (%), by Type 2025 & 2033
- Figure 6: India Silver Market Volume Share (%), by Type 2025 & 2033
- Figure 7: India Silver Market Revenue (billion), by Application 2025 & 2033
- Figure 8: India Silver Market Volume (K Tons), by Application 2025 & 2033
- Figure 9: India Silver Market Revenue Share (%), by Application 2025 & 2033
- Figure 10: India Silver Market Volume Share (%), by Application 2025 & 2033
- Figure 11: India Silver Market Revenue (billion), by Country 2025 & 2033
- Figure 12: India Silver Market Volume (K Tons), by Country 2025 & 2033
- Figure 13: India Silver Market Revenue Share (%), by Country 2025 & 2033
- Figure 14: India Silver Market Volume Share (%), by Country 2025 & 2033
- Figure 15: China Silver Market Revenue (billion), by Type 2025 & 2033
- Figure 16: China Silver Market Volume (K Tons), by Type 2025 & 2033
- Figure 17: China Silver Market Revenue Share (%), by Type 2025 & 2033
- Figure 18: China Silver Market Volume Share (%), by Type 2025 & 2033
- Figure 19: China Silver Market Revenue (billion), by Application 2025 & 2033
- Figure 20: China Silver Market Volume (K Tons), by Application 2025 & 2033
- Figure 21: China Silver Market Revenue Share (%), by Application 2025 & 2033
- Figure 22: China Silver Market Volume Share (%), by Application 2025 & 2033
- Figure 23: China Silver Market Revenue (billion), by Country 2025 & 2033
- Figure 24: China Silver Market Volume (K Tons), by Country 2025 & 2033
- Figure 25: China Silver Market Revenue Share (%), by Country 2025 & 2033
- Figure 26: China Silver Market Volume Share (%), by Country 2025 & 2033
- Figure 27: Japan Silver Market Revenue (billion), by Type 2025 & 2033
- Figure 28: Japan Silver Market Volume (K Tons), by Type 2025 & 2033
- Figure 29: Japan Silver Market Revenue Share (%), by Type 2025 & 2033
- Figure 30: Japan Silver Market Volume Share (%), by Type 2025 & 2033
- Figure 31: Japan Silver Market Revenue (billion), by Application 2025 & 2033
- Figure 32: Japan Silver Market Volume (K Tons), by Application 2025 & 2033
- Figure 33: Japan Silver Market Revenue Share (%), by Application 2025 & 2033
- Figure 34: Japan Silver Market Volume Share (%), by Application 2025 & 2033
- Figure 35: Japan Silver Market Revenue (billion), by Country 2025 & 2033
- Figure 36: Japan Silver Market Volume (K Tons), by Country 2025 & 2033
- Figure 37: Japan Silver Market Revenue Share (%), by Country 2025 & 2033
- Figure 38: Japan Silver Market Volume Share (%), by Country 2025 & 2033
- Figure 39: South Korea Silver Market Revenue (billion), by Type 2025 & 2033
- Figure 40: South Korea Silver Market Volume (K Tons), by Type 2025 & 2033
- Figure 41: South Korea Silver Market Revenue Share (%), by Type 2025 & 2033
- Figure 42: South Korea Silver Market Volume Share (%), by Type 2025 & 2033
- Figure 43: South Korea Silver Market Revenue (billion), by Application 2025 & 2033
- Figure 44: South Korea Silver Market Volume (K Tons), by Application 2025 & 2033
- Figure 45: South Korea Silver Market Revenue Share (%), by Application 2025 & 2033
- Figure 46: South Korea Silver Market Volume Share (%), by Application 2025 & 2033
- Figure 47: South Korea Silver Market Revenue (billion), by Country 2025 & 2033
- Figure 48: South Korea Silver Market Volume (K Tons), by Country 2025 & 2033
- Figure 49: South Korea Silver Market Revenue Share (%), by Country 2025 & 2033
- Figure 50: South Korea Silver Market Volume Share (%), by Country 2025 & 2033
- Figure 51: Rest of Asia Pacific Silver Market Revenue (billion), by Type 2025 & 2033
- Figure 52: Rest of Asia Pacific Silver Market Volume (K Tons), by Type 2025 & 2033
- Figure 53: Rest of Asia Pacific Silver Market Revenue Share (%), by Type 2025 & 2033
- Figure 54: Rest of Asia Pacific Silver Market Volume Share (%), by Type 2025 & 2033
- Figure 55: Rest of Asia Pacific Silver Market Revenue (billion), by Application 2025 & 2033
- Figure 56: Rest of Asia Pacific Silver Market Volume (K Tons), by Application 2025 & 2033
- Figure 57: Rest of Asia Pacific Silver Market Revenue Share (%), by Application 2025 & 2033
- Figure 58: Rest of Asia Pacific Silver Market Volume Share (%), by Application 2025 & 2033
- Figure 59: Rest of Asia Pacific Silver Market Revenue (billion), by Country 2025 & 2033
- Figure 60: Rest of Asia Pacific Silver Market Volume (K Tons), by Country 2025 & 2033
- Figure 61: Rest of Asia Pacific Silver Market Revenue Share (%), by Country 2025 & 2033
- Figure 62: Rest of Asia Pacific Silver Market Volume Share (%), by Country 2025 & 2033
- Figure 63: United States Silver Market Revenue (billion), by Type 2025 & 2033
- Figure 64: United States Silver Market Volume (K Tons), by Type 2025 & 2033
- Figure 65: United States Silver Market Revenue Share (%), by Type 2025 & 2033
- Figure 66: United States Silver Market Volume Share (%), by Type 2025 & 2033
- Figure 67: United States Silver Market Revenue (billion), by Application 2025 & 2033
- Figure 68: United States Silver Market Volume (K Tons), by Application 2025 & 2033
- Figure 69: United States Silver Market Revenue Share (%), by Application 2025 & 2033
- Figure 70: United States Silver Market Volume Share (%), by Application 2025 & 2033
- Figure 71: United States Silver Market Revenue (billion), by Country 2025 & 2033
- Figure 72: United States Silver Market Volume (K Tons), by Country 2025 & 2033
- Figure 73: United States Silver Market Revenue Share (%), by Country 2025 & 2033
- Figure 74: United States Silver Market Volume Share (%), by Country 2025 & 2033
- Figure 75: Canada Silver Market Revenue (billion), by Type 2025 & 2033
- Figure 76: Canada Silver Market Volume (K Tons), by Type 2025 & 2033
- Figure 77: Canada Silver Market Revenue Share (%), by Type 2025 & 2033
- Figure 78: Canada Silver Market Volume Share (%), by Type 2025 & 2033
- Figure 79: Canada Silver Market Revenue (billion), by Application 2025 & 2033
- Figure 80: Canada Silver Market Volume (K Tons), by Application 2025 & 2033
- Figure 81: Canada Silver Market Revenue Share (%), by Application 2025 & 2033
- Figure 82: Canada Silver Market Volume Share (%), by Application 2025 & 2033
- Figure 83: Canada Silver Market Revenue (billion), by Country 2025 & 2033
- Figure 84: Canada Silver Market Volume (K Tons), by Country 2025 & 2033
- Figure 85: Canada Silver Market Revenue Share (%), by Country 2025 & 2033
- Figure 86: Canada Silver Market Volume Share (%), by Country 2025 & 2033
- Figure 87: Mexico Silver Market Revenue (billion), by Type 2025 & 2033
- Figure 88: Mexico Silver Market Volume (K Tons), by Type 2025 & 2033
- Figure 89: Mexico Silver Market Revenue Share (%), by Type 2025 & 2033
- Figure 90: Mexico Silver Market Volume Share (%), by Type 2025 & 2033
- Figure 91: Mexico Silver Market Revenue (billion), by Application 2025 & 2033
- Figure 92: Mexico Silver Market Volume (K Tons), by Application 2025 & 2033
- Figure 93: Mexico Silver Market Revenue Share (%), by Application 2025 & 2033
- Figure 94: Mexico Silver Market Volume Share (%), by Application 2025 & 2033
- Figure 95: Mexico Silver Market Revenue (billion), by Country 2025 & 2033
- Figure 96: Mexico Silver Market Volume (K Tons), by Country 2025 & 2033
- Figure 97: Mexico Silver Market Revenue Share (%), by Country 2025 & 2033
- Figure 98: Mexico Silver Market Volume Share (%), by Country 2025 & 2033
- Figure 99: Germany Silver Market Revenue (billion), by Type 2025 & 2033
- Figure 100: Germany Silver Market Volume (K Tons), by Type 2025 & 2033
- Figure 101: Germany Silver Market Revenue Share (%), by Type 2025 & 2033
- Figure 102: Germany Silver Market Volume Share (%), by Type 2025 & 2033
- Figure 103: Germany Silver Market Revenue (billion), by Application 2025 & 2033
- Figure 104: Germany Silver Market Volume (K Tons), by Application 2025 & 2033
- Figure 105: Germany Silver Market Revenue Share (%), by Application 2025 & 2033
- Figure 106: Germany Silver Market Volume Share (%), by Application 2025 & 2033
- Figure 107: Germany Silver Market Revenue (billion), by Country 2025 & 2033
- Figure 108: Germany Silver Market Volume (K Tons), by Country 2025 & 2033
- Figure 109: Germany Silver Market Revenue Share (%), by Country 2025 & 2033
- Figure 110: Germany Silver Market Volume Share (%), by Country 2025 & 2033
- Figure 111: United Kingdom Silver Market Revenue (billion), by Type 2025 & 2033
- Figure 112: United Kingdom Silver Market Volume (K Tons), by Type 2025 & 2033
- Figure 113: United Kingdom Silver Market Revenue Share (%), by Type 2025 & 2033
- Figure 114: United Kingdom Silver Market Volume Share (%), by Type 2025 & 2033
- Figure 115: United Kingdom Silver Market Revenue (billion), by Application 2025 & 2033
- Figure 116: United Kingdom Silver Market Volume (K Tons), by Application 2025 & 2033
- Figure 117: United Kingdom Silver Market Revenue Share (%), by Application 2025 & 2033
- Figure 118: United Kingdom Silver Market Volume Share (%), by Application 2025 & 2033
- Figure 119: United Kingdom Silver Market Revenue (billion), by Country 2025 & 2033
- Figure 120: United Kingdom Silver Market Volume (K Tons), by Country 2025 & 2033
- Figure 121: United Kingdom Silver Market Revenue Share (%), by Country 2025 & 2033
- Figure 122: United Kingdom Silver Market Volume Share (%), by Country 2025 & 2033
- Figure 123: Italy Silver Market Revenue (billion), by Type 2025 & 2033
- Figure 124: Italy Silver Market Volume (K Tons), by Type 2025 & 2033
- Figure 125: Italy Silver Market Revenue Share (%), by Type 2025 & 2033
- Figure 126: Italy Silver Market Volume Share (%), by Type 2025 & 2033
- Figure 127: Italy Silver Market Revenue (billion), by Application 2025 & 2033
- Figure 128: Italy Silver Market Volume (K Tons), by Application 2025 & 2033
- Figure 129: Italy Silver Market Revenue Share (%), by Application 2025 & 2033
- Figure 130: Italy Silver Market Volume Share (%), by Application 2025 & 2033
- Figure 131: Italy Silver Market Revenue (billion), by Country 2025 & 2033
- Figure 132: Italy Silver Market Volume (K Tons), by Country 2025 & 2033
- Figure 133: Italy Silver Market Revenue Share (%), by Country 2025 & 2033
- Figure 134: Italy Silver Market Volume Share (%), by Country 2025 & 2033
- Figure 135: France Silver Market Revenue (billion), by Type 2025 & 2033
- Figure 136: France Silver Market Volume (K Tons), by Type 2025 & 2033
- Figure 137: France Silver Market Revenue Share (%), by Type 2025 & 2033
- Figure 138: France Silver Market Volume Share (%), by Type 2025 & 2033
- Figure 139: France Silver Market Revenue (billion), by Application 2025 & 2033
- Figure 140: France Silver Market Volume (K Tons), by Application 2025 & 2033
- Figure 141: France Silver Market Revenue Share (%), by Application 2025 & 2033
- Figure 142: France Silver Market Volume Share (%), by Application 2025 & 2033
- Figure 143: France Silver Market Revenue (billion), by Country 2025 & 2033
- Figure 144: France Silver Market Volume (K Tons), by Country 2025 & 2033
- Figure 145: France Silver Market Revenue Share (%), by Country 2025 & 2033
- Figure 146: France Silver Market Volume Share (%), by Country 2025 & 2033
- Figure 147: Rest of Europe Silver Market Revenue (billion), by Type 2025 & 2033
- Figure 148: Rest of Europe Silver Market Volume (K Tons), by Type 2025 & 2033
- Figure 149: Rest of Europe Silver Market Revenue Share (%), by Type 2025 & 2033
- Figure 150: Rest of Europe Silver Market Volume Share (%), by Type 2025 & 2033
- Figure 151: Rest of Europe Silver Market Revenue (billion), by Application 2025 & 2033
- Figure 152: Rest of Europe Silver Market Volume (K Tons), by Application 2025 & 2033
- Figure 153: Rest of Europe Silver Market Revenue Share (%), by Application 2025 & 2033
- Figure 154: Rest of Europe Silver Market Volume Share (%), by Application 2025 & 2033
- Figure 155: Rest of Europe Silver Market Revenue (billion), by Country 2025 & 2033
- Figure 156: Rest of Europe Silver Market Volume (K Tons), by Country 2025 & 2033
- Figure 157: Rest of Europe Silver Market Revenue Share (%), by Country 2025 & 2033
- Figure 158: Rest of Europe Silver Market Volume Share (%), by Country 2025 & 2033
- Figure 159: Brazil Silver Market Revenue (billion), by Type 2025 & 2033
- Figure 160: Brazil Silver Market Volume (K Tons), by Type 2025 & 2033
- Figure 161: Brazil Silver Market Revenue Share (%), by Type 2025 & 2033
- Figure 162: Brazil Silver Market Volume Share (%), by Type 2025 & 2033
- Figure 163: Brazil Silver Market Revenue (billion), by Application 2025 & 2033
- Figure 164: Brazil Silver Market Volume (K Tons), by Application 2025 & 2033
- Figure 165: Brazil Silver Market Revenue Share (%), by Application 2025 & 2033
- Figure 166: Brazil Silver Market Volume Share (%), by Application 2025 & 2033
- Figure 167: Brazil Silver Market Revenue (billion), by Country 2025 & 2033
- Figure 168: Brazil Silver Market Volume (K Tons), by Country 2025 & 2033
- Figure 169: Brazil Silver Market Revenue Share (%), by Country 2025 & 2033
- Figure 170: Brazil Silver Market Volume Share (%), by Country 2025 & 2033
- Figure 171: Argentina Silver Market Revenue (billion), by Type 2025 & 2033
- Figure 172: Argentina Silver Market Volume (K Tons), by Type 2025 & 2033
- Figure 173: Argentina Silver Market Revenue Share (%), by Type 2025 & 2033
- Figure 174: Argentina Silver Market Volume Share (%), by Type 2025 & 2033
- Figure 175: Argentina Silver Market Revenue (billion), by Application 2025 & 2033
- Figure 176: Argentina Silver Market Volume (K Tons), by Application 2025 & 2033
- Figure 177: Argentina Silver Market Revenue Share (%), by Application 2025 & 2033
- Figure 178: Argentina Silver Market Volume Share (%), by Application 2025 & 2033
- Figure 179: Argentina Silver Market Revenue (billion), by Country 2025 & 2033
- Figure 180: Argentina Silver Market Volume (K Tons), by Country 2025 & 2033
- Figure 181: Argentina Silver Market Revenue Share (%), by Country 2025 & 2033
- Figure 182: Argentina Silver Market Volume Share (%), by Country 2025 & 2033
- Figure 183: Rest of South America Silver Market Revenue (billion), by Type 2025 & 2033
- Figure 184: Rest of South America Silver Market Volume (K Tons), by Type 2025 & 2033
- Figure 185: Rest of South America Silver Market Revenue Share (%), by Type 2025 & 2033
- Figure 186: Rest of South America Silver Market Volume Share (%), by Type 2025 & 2033
- Figure 187: Rest of South America Silver Market Revenue (billion), by Application 2025 & 2033
- Figure 188: Rest of South America Silver Market Volume (K Tons), by Application 2025 & 2033
- Figure 189: Rest of South America Silver Market Revenue Share (%), by Application 2025 & 2033
- Figure 190: Rest of South America Silver Market Volume Share (%), by Application 2025 & 2033
- Figure 191: Rest of South America Silver Market Revenue (billion), by Country 2025 & 2033
- Figure 192: Rest of South America Silver Market Volume (K Tons), by Country 2025 & 2033
- Figure 193: Rest of South America Silver Market Revenue Share (%), by Country 2025 & 2033
- Figure 194: Rest of South America Silver Market Volume Share (%), by Country 2025 & 2033
- Figure 195: Saudi Arabia Silver Market Revenue (billion), by Type 2025 & 2033
- Figure 196: Saudi Arabia Silver Market Volume (K Tons), by Type 2025 & 2033
- Figure 197: Saudi Arabia Silver Market Revenue Share (%), by Type 2025 & 2033
- Figure 198: Saudi Arabia Silver Market Volume Share (%), by Type 2025 & 2033
- Figure 199: Saudi Arabia Silver Market Revenue (billion), by Application 2025 & 2033
- Figure 200: Saudi Arabia Silver Market Volume (K Tons), by Application 2025 & 2033
- Figure 201: Saudi Arabia Silver Market Revenue Share (%), by Application 2025 & 2033
- Figure 202: Saudi Arabia Silver Market Volume Share (%), by Application 2025 & 2033
- Figure 203: Saudi Arabia Silver Market Revenue (billion), by Country 2025 & 2033
- Figure 204: Saudi Arabia Silver Market Volume (K Tons), by Country 2025 & 2033
- Figure 205: Saudi Arabia Silver Market Revenue Share (%), by Country 2025 & 2033
- Figure 206: Saudi Arabia Silver Market Volume Share (%), by Country 2025 & 2033
- Figure 207: South Africa Silver Market Revenue (billion), by Type 2025 & 2033
- Figure 208: South Africa Silver Market Volume (K Tons), by Type 2025 & 2033
- Figure 209: South Africa Silver Market Revenue Share (%), by Type 2025 & 2033
- Figure 210: South Africa Silver Market Volume Share (%), by Type 2025 & 2033
- Figure 211: South Africa Silver Market Revenue (billion), by Application 2025 & 2033
- Figure 212: South Africa Silver Market Volume (K Tons), by Application 2025 & 2033
- Figure 213: South Africa Silver Market Revenue Share (%), by Application 2025 & 2033
- Figure 214: South Africa Silver Market Volume Share (%), by Application 2025 & 2033
- Figure 215: South Africa Silver Market Revenue (billion), by Country 2025 & 2033
- Figure 216: South Africa Silver Market Volume (K Tons), by Country 2025 & 2033
- Figure 217: South Africa Silver Market Revenue Share (%), by Country 2025 & 2033
- Figure 218: South Africa Silver Market Volume Share (%), by Country 2025 & 2033
- Figure 219: Rest of Middle East and Africa Silver Market Revenue (billion), by Type 2025 & 2033
- Figure 220: Rest of Middle East and Africa Silver Market Volume (K Tons), by Type 2025 & 2033
- Figure 221: Rest of Middle East and Africa Silver Market Revenue Share (%), by Type 2025 & 2033
- Figure 222: Rest of Middle East and Africa Silver Market Volume Share (%), by Type 2025 & 2033
- Figure 223: Rest of Middle East and Africa Silver Market Revenue (billion), by Application 2025 & 2033
- Figure 224: Rest of Middle East and Africa Silver Market Volume (K Tons), by Application 2025 & 2033
- Figure 225: Rest of Middle East and Africa Silver Market Revenue Share (%), by Application 2025 & 2033
- Figure 226: Rest of Middle East and Africa Silver Market Volume Share (%), by Application 2025 & 2033
- Figure 227: Rest of Middle East and Africa Silver Market Revenue (billion), by Country 2025 & 2033
- Figure 228: Rest of Middle East and Africa Silver Market Volume (K Tons), by Country 2025 & 2033
- Figure 229: Rest of Middle East and Africa Silver Market Revenue Share (%), by Country 2025 & 2033
- Figure 230: Rest of Middle East and Africa Silver Market Volume Share (%), by Country 2025 & 2033
List of Tables
- Table 1: Global Silver Market Revenue billion Forecast, by Type 2020 & 2033
- Table 2: Global Silver Market Volume K Tons Forecast, by Type 2020 & 2033
- Table 3: Global Silver Market Revenue billion Forecast, by Application 2020 & 2033
- Table 4: Global Silver Market Volume K Tons Forecast, by Application 2020 & 2033
- Table 5: Global Silver Market Revenue billion Forecast, by Region 2020 & 2033
- Table 6: Global Silver Market Volume K Tons Forecast, by Region 2020 & 2033
- Table 7: Global Silver Market Revenue billion Forecast, by Type 2020 & 2033
- Table 8: Global Silver Market Volume K Tons Forecast, by Type 2020 & 2033
- Table 9: Global Silver Market Revenue billion Forecast, by Application 2020 & 2033
- Table 10: Global Silver Market Volume K Tons Forecast, by Application 2020 & 2033
- Table 11: Global Silver Market Revenue billion Forecast, by Country 2020 & 2033
- Table 12: Global Silver Market Volume K Tons Forecast, by Country 2020 & 2033
- Table 13: Global Silver Market Revenue billion Forecast, by Type 2020 & 2033
- Table 14: Global Silver Market Volume K Tons Forecast, by Type 2020 & 2033
- Table 15: Global Silver Market Revenue billion Forecast, by Application 2020 & 2033
- Table 16: Global Silver Market Volume K Tons Forecast, by Application 2020 & 2033
- Table 17: Global Silver Market Revenue billion Forecast, by Country 2020 & 2033
- Table 18: Global Silver Market Volume K Tons Forecast, by Country 2020 & 2033
- Table 19: Global Silver Market Revenue billion Forecast, by Type 2020 & 2033
- Table 20: Global Silver Market Volume K Tons Forecast, by Type 2020 & 2033
- Table 21: Global Silver Market Revenue billion Forecast, by Application 2020 & 2033
- Table 22: Global Silver Market Volume K Tons Forecast, by Application 2020 & 2033
- Table 23: Global Silver Market Revenue billion Forecast, by Country 2020 & 2033
- Table 24: Global Silver Market Volume K Tons Forecast, by Country 2020 & 2033
- Table 25: Global Silver Market Revenue billion Forecast, by Type 2020 & 2033
- Table 26: Global Silver Market Volume K Tons Forecast, by Type 2020 & 2033
- Table 27: Global Silver Market Revenue billion Forecast, by Application 2020 & 2033
- Table 28: Global Silver Market Volume K Tons Forecast, by Application 2020 & 2033
- Table 29: Global Silver Market Revenue billion Forecast, by Country 2020 & 2033
- Table 30: Global Silver Market Volume K Tons Forecast, by Country 2020 & 2033
- Table 31: Global Silver Market Revenue billion Forecast, by Type 2020 & 2033
- Table 32: Global Silver Market Volume K Tons Forecast, by Type 2020 & 2033
- Table 33: Global Silver Market Revenue billion Forecast, by Application 2020 & 2033
- Table 34: Global Silver Market Volume K Tons Forecast, by Application 2020 & 2033
- Table 35: Global Silver Market Revenue billion Forecast, by Country 2020 & 2033
- Table 36: Global Silver Market Volume K Tons Forecast, by Country 2020 & 2033
- Table 37: North America Silver Market Revenue (billion) Forecast, by Application 2020 & 2033
- Table 38: North America Silver Market Volume (K Tons) Forecast, by Application 2020 & 2033
- Table 39: Global Silver Market Revenue billion Forecast, by Type 2020 & 2033
- Table 40: Global Silver Market Volume K Tons Forecast, by Type 2020 & 2033
- Table 41: Global Silver Market Revenue billion Forecast, by Application 2020 & 2033
- Table 42: Global Silver Market Volume K Tons Forecast, by Application 2020 & 2033
- Table 43: Global Silver Market Revenue billion Forecast, by Country 2020 & 2033
- Table 44: Global Silver Market Volume K Tons Forecast, by Country 2020 & 2033
- Table 45: Global Silver Market Revenue billion Forecast, by Type 2020 & 2033
- Table 46: Global Silver Market Volume K Tons Forecast, by Type 2020 & 2033
- Table 47: Global Silver Market Revenue billion Forecast, by Application 2020 & 2033
- Table 48: Global Silver Market Volume K Tons Forecast, by Application 2020 & 2033
- Table 49: Global Silver Market Revenue billion Forecast, by Country 2020 & 2033
- Table 50: Global Silver Market Volume K Tons Forecast, by Country 2020 & 2033
- Table 51: Global Silver Market Revenue billion Forecast, by Type 2020 & 2033
- Table 52: Global Silver Market Volume K Tons Forecast, by Type 2020 & 2033
- Table 53: Global Silver Market Revenue billion Forecast, by Application 2020 & 2033
- Table 54: Global Silver Market Volume K Tons Forecast, by Application 2020 & 2033
- Table 55: Global Silver Market Revenue billion Forecast, by Country 2020 & 2033
- Table 56: Global Silver Market Volume K Tons Forecast, by Country 2020 & 2033
- Table 57: Europe Silver Market Revenue (billion) Forecast, by Application 2020 & 2033
- Table 58: Europe Silver Market Volume (K Tons) Forecast, by Application 2020 & 2033
- Table 59: Global Silver Market Revenue billion Forecast, by Type 2020 & 2033
- Table 60: Global Silver Market Volume K Tons Forecast, by Type 2020 & 2033
- Table 61: Global Silver Market Revenue billion Forecast, by Application 2020 & 2033
- Table 62: Global Silver Market Volume K Tons Forecast, by Application 2020 & 2033
- Table 63: Global Silver Market Revenue billion Forecast, by Country 2020 & 2033
- Table 64: Global Silver Market Volume K Tons Forecast, by Country 2020 & 2033
- Table 65: Global Silver Market Revenue billion Forecast, by Type 2020 & 2033
- Table 66: Global Silver Market Volume K Tons Forecast, by Type 2020 & 2033
- Table 67: Global Silver Market Revenue billion Forecast, by Application 2020 & 2033
- Table 68: Global Silver Market Volume K Tons Forecast, by Application 2020 & 2033
- Table 69: Global Silver Market Revenue billion Forecast, by Country 2020 & 2033
- Table 70: Global Silver Market Volume K Tons Forecast, by Country 2020 & 2033
- Table 71: Global Silver Market Revenue billion Forecast, by Type 2020 & 2033
- Table 72: Global Silver Market Volume K Tons Forecast, by Type 2020 & 2033
- Table 73: Global Silver Market Revenue billion Forecast, by Application 2020 & 2033
- Table 74: Global Silver Market Volume K Tons Forecast, by Application 2020 & 2033
- Table 75: Global Silver Market Revenue billion Forecast, by Country 2020 & 2033
- Table 76: Global Silver Market Volume K Tons Forecast, by Country 2020 & 2033
- Table 77: Global Silver Market Revenue billion Forecast, by Type 2020 & 2033
- Table 78: Global Silver Market Volume K Tons Forecast, by Type 2020 & 2033
- Table 79: Global Silver Market Revenue billion Forecast, by Application 2020 & 2033
- Table 80: Global Silver Market Volume K Tons Forecast, by Application 2020 & 2033
- Table 81: Global Silver Market Revenue billion Forecast, by Country 2020 & 2033
- Table 82: Global Silver Market Volume K Tons Forecast, by Country 2020 & 2033
- Table 83: Global Silver Market Revenue billion Forecast, by Type 2020 & 2033
- Table 84: Global Silver Market Volume K Tons Forecast, by Type 2020 & 2033
- Table 85: Global Silver Market Revenue billion Forecast, by Application 2020 & 2033
- Table 86: Global Silver Market Volume K Tons Forecast, by Application 2020 & 2033
- Table 87: Global Silver Market Revenue billion Forecast, by Country 2020 & 2033
- Table 88: Global Silver Market Volume K Tons Forecast, by Country 2020 & 2033
- Table 89: South America Silver Market Revenue (billion) Forecast, by Application 2020 & 2033
- Table 90: South America Silver Market Volume (K Tons) Forecast, by Application 2020 & 2033
- Table 91: Global Silver Market Revenue billion Forecast, by Type 2020 & 2033
- Table 92: Global Silver Market Volume K Tons Forecast, by Type 2020 & 2033
- Table 93: Global Silver Market Revenue billion Forecast, by Application 2020 & 2033
- Table 94: Global Silver Market Volume K Tons Forecast, by Application 2020 & 2033
- Table 95: Global Silver Market Revenue billion Forecast, by Country 2020 & 2033
- Table 96: Global Silver Market Volume K Tons Forecast, by Country 2020 & 2033
- Table 97: Global Silver Market Revenue billion Forecast, by Type 2020 & 2033
- Table 98: Global Silver Market Volume K Tons Forecast, by Type 2020 & 2033
- Table 99: Global Silver Market Revenue billion Forecast, by Application 2020 & 2033
- Table 100: Global Silver Market Volume K Tons Forecast, by Application 2020 & 2033
- Table 101: Global Silver Market Revenue billion Forecast, by Country 2020 & 2033
- Table 102: Global Silver Market Volume K Tons Forecast, by Country 2020 & 2033
- Table 103: Global Silver Market Revenue billion Forecast, by Type 2020 & 2033
- Table 104: Global Silver Market Volume K Tons Forecast, by Type 2020 & 2033
- Table 105: Global Silver Market Revenue billion Forecast, by Application 2020 & 2033
- Table 106: Global Silver Market Volume K Tons Forecast, by Application 2020 & 2033
- Table 107: Global Silver Market Revenue billion Forecast, by Country 2020 & 2033
- Table 108: Global Silver Market Volume K Tons Forecast, by Country 2020 & 2033
- Table 109: Middle East and Africa Silver Market Revenue (billion) Forecast, by Application 2020 & 2033
- Table 110: Middle East and Africa Silver Market Volume (K Tons) Forecast, by Application 2020 & 2033
- Table 111: Global Silver Market Revenue billion Forecast, by Type 2020 & 2033
- Table 112: Global Silver Market Volume K Tons Forecast, by Type 2020 & 2033
- Table 113: Global Silver Market Revenue billion Forecast, by Application 2020 & 2033
- Table 114: Global Silver Market Volume K Tons Forecast, by Application 2020 & 2033
- Table 115: Global Silver Market Revenue billion Forecast, by Country 2020 & 2033
- Table 116: Global Silver Market Volume K Tons Forecast, by Country 2020 & 2033
- Table 117: Global Silver Market Revenue billion Forecast, by Type 2020 & 2033
- Table 118: Global Silver Market Volume K Tons Forecast, by Type 2020 & 2033
- Table 119: Global Silver Market Revenue billion Forecast, by Application 2020 & 2033
- Table 120: Global Silver Market Volume K Tons Forecast, by Application 2020 & 2033
- Table 121: Global Silver Market Revenue billion Forecast, by Country 2020 & 2033
- Table 122: Global Silver Market Volume K Tons Forecast, by Country 2020 & 2033
- Table 123: Global Silver Market Revenue billion Forecast, by Type 2020 & 2033
- Table 124: Global Silver Market Volume K Tons Forecast, by Type 2020 & 2033
- Table 125: Global Silver Market Revenue billion Forecast, by Application 2020 & 2033
- Table 126: Global Silver Market Volume K Tons Forecast, by Application 2020 & 2033
- Table 127: Global Silver Market Revenue billion Forecast, by Country 2020 & 2033
- Table 128: Global Silver Market Volume K Tons Forecast, by Country 2020 & 2033
Frequently Asked Questions
1. What is the projected Compound Annual Growth Rate (CAGR) of the Silver Market?
The projected CAGR is approximately 6.6%.
2. Which companies are prominent players in the Silver Market?
Key companies in the market include Silvercorp Metals Inc, Coeur Mining Inc, Wheaton Precious Metals Corp, Americas Gold and Silver Corporation, Polymetal International plc, Hindustan Zinc, Avino Silver & Gold Mines Ltd, MAG Silver Corp, Fresnillo plc, Industrias Peñoles, Hecla Mining Company, IMPACT Silver Corp, Honey Badger Silver Inc, Fortuna Silver Mines Inc, Orla Mining Ltd, First Majestic Silver Corp, Royal Gold Inc, Compañía de Minas Buenaventura S A A, Pan American Silver Corp.
3. What are the main segments of the Silver Market?
The market segments include Type, Application.
4. Can you provide details about the market size?
The market size is estimated to be USD 565.08 billion as of 2022.
5. What are some drivers contributing to market growth?
Increasing Demand for Silver in Industrial and Electrical Applications; Rising Demand for Silver in Jewelry and Silverware.
6. What are the notable trends driving market growth?
Electrical and Electronics Application to Dominate.
7. Are there any restraints impacting market growth?
Stringent Regulations on the Production and Consumption of Silver due to Health-Related Issues.
8. Can you provide examples of recent developments in the market?
April 2023: Impact Silver Corp. announced the completion of the share purchase and sale agreement with Consolidated Zinc Limited of Australia, the purchase of all outstanding shares of its subsidiary, Minera Latin America Zinc S.A.P.I de C.V., which holds a 100% interest in the high-grade, Plomosas zinc-lead-silver mine in the state of Chihuahua, northern Mexico. The agreement consists of a total price of USD 6 million out of which USD 3 million is to be given in cash and the balance in the form of IMPACT shares.
9. What pricing options are available for accessing the report?
Pricing options include single-user, multi-user, and enterprise licenses priced at USD 4750, USD 5250, and USD 8750 respectively.
10. Is the market size provided in terms of value or volume?
The market size is provided in terms of value, measured in billion and volume, measured in K Tons.
11. Are there any specific market keywords associated with the report?
Yes, the market keyword associated with the report is "Silver Market," which aids in identifying and referencing the specific market segment covered.
12. How do I determine which pricing option suits my needs best?
The pricing options vary based on user requirements and access needs. Individual users may opt for single-user licenses, while businesses requiring broader access may choose multi-user or enterprise licenses for cost-effective access to the report.
13. Are there any additional resources or data provided in the Silver Market report?
While the report offers comprehensive insights, it's advisable to review the specific contents or supplementary materials provided to ascertain if additional resources or data are available.
14. How can I stay updated on further developments or reports in the Silver Market?
To stay informed about further developments, trends, and reports in the Silver Market, consider subscribing to industry newsletters, following relevant companies and organizations, or regularly checking reputable industry news sources and publications.
Methodology
Step 1 - Identification of Relevant Samples Size from Population Database


Step 2 - Approaches for Defining Global Market Size (Value, Volume* & Price*)

Note*: In applicable scenarios
Step 3 - Data Sources
Primary Research
- Web Analytics
- Survey Reports
- Research Institute
- Latest Research Reports
- Opinion Leaders
Secondary Research
- Annual Reports
- White Paper
- Latest Press Release
- Industry Association
- Paid Database
- Investor Presentations

Step 4 - Data Triangulation
Involves using different sources of information in order to increase the validity of a study
These sources are likely to be stakeholders in a program - participants, other researchers, program staff, other community members, and so on.
Then we put all data in single framework & apply various statistical tools to find out the dynamic on the market.
During the analysis stage, feedback from the stakeholder groups would be compared to determine areas of agreement as well as areas of divergence