Key Insights
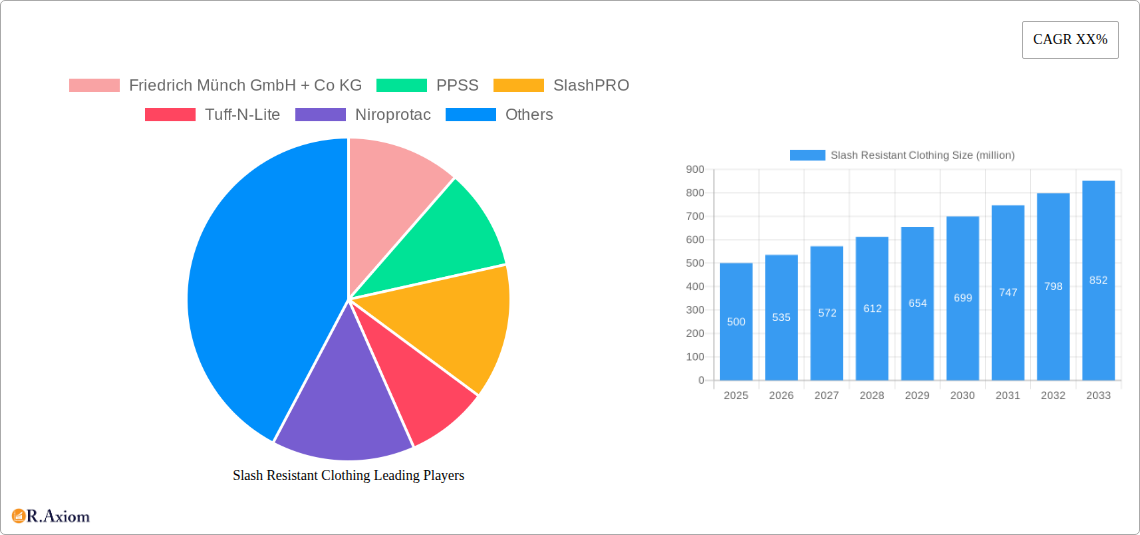
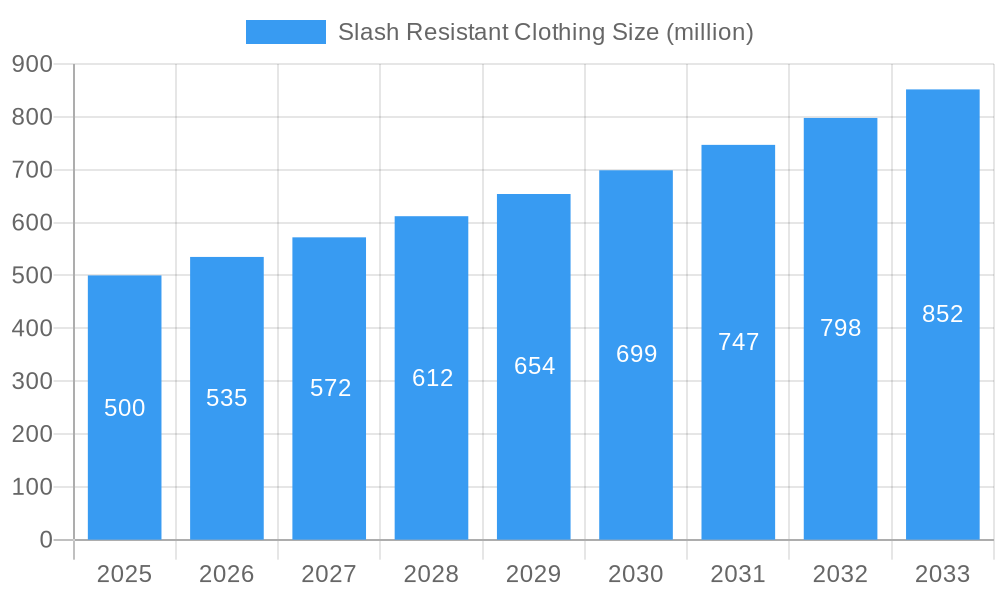
The global slash-resistant clothing market is poised for significant expansion, driven by heightened safety awareness across high-risk industries such as law enforcement, emergency services, and food processing. Advancements in material technology, yielding lighter and more effective protective garments, are further stimulating demand. We project the market size to reach $11.53 billion by 2025, with a projected Compound Annual Growth Rate (CAGR) of 5.48% through 2033. Key growth drivers include the increasing adoption of protective apparel and ongoing innovation in high-performance materials. Leading companies like Friedrich Münch GmbH + Co KG and PPSS are instrumental in this evolution. While initial costs may present a challenge, the long-term benefits of injury prevention justify the investment. Market segmentation spans material types (e.g., Kevlar, Dyneema), garment types (e.g., vests, gloves, aprons), and end-user industries. North America and Europe currently lead the market, with Asia-Pacific anticipated to experience substantial growth due to industrialization and evolving safety regulations.
Slash Resistant Clothing Market Size (In Billion)
The competitive environment features both established leaders and agile new entrants. Established brands leverage brand recognition and robust distribution, while newer companies focus on innovation and specialized market segments. Future market expansion hinges on sustained technological progress, new market penetration, and addressing user demands for comfort and cost-effectiveness. The development of lighter, more breathable, and highly protective materials will be critical. Evolving workplace safety regulations are also expected to positively influence market trajectory. The industry is set for continued growth, propelled by the imperative for enhanced protection and ongoing advancements in personal protective equipment (PPE) material science.
Slash Resistant Clothing Company Market Share
Slash Resistant Clothing Market: A Comprehensive Report (2019-2033)
This comprehensive report provides an in-depth analysis of the global slash resistant clothing market, offering valuable insights for industry stakeholders, investors, and businesses seeking to navigate this dynamic sector. The study covers the period from 2019 to 2033, with a focus on the 2025-2033 forecast period. The report utilizes a robust methodology incorporating market sizing, segmentation analysis, competitive landscape assessment, and trend forecasting, generating actionable insights based on a detailed examination of market dynamics and future projections. The total market value is estimated at $XX million in 2025 and is projected to reach $XX million by 2033, exhibiting a CAGR of XX%.
Slash Resistant Clothing Market Concentration & Innovation
This section analyzes the market concentration, innovation landscape, regulatory environment, and competitive dynamics within the slash resistant clothing market. The report examines the market share held by key players such as Friedrich Münch GmbH + Co KG, PPSS, SlashPRO, Tuff-N-Lite, Niroprotac, Oroel, EDC Protection, Body Armor, MTP, Kozane, Stomex, Magid, Granberg AS, and Ansell. We assess the level of market concentration, identifying any dominant players and analyzing their strategies.
- Market Share Analysis: The report details the market share of major players, revealing the extent of market fragmentation or dominance. For example, in 2025, it is estimated that the top three players (e.g., PPSS, SlashPRO, and Friedrich Münch GmbH + Co KG) hold approximately xx% of the global market.
- Innovation Drivers: Analysis includes factors driving innovation, such as advancements in materials science (e.g., development of more flexible and lightweight slash-resistant fabrics), evolving end-user needs, and regulatory pressures.
- Regulatory Framework: A comprehensive review of relevant safety regulations and standards impacting the design, manufacturing, and sale of slash resistant clothing is provided. This includes a geographical analysis of varying regulations.
- Product Substitutes: The report assesses potential substitutes and their impact on market share and pricing.
- M&A Activities: The report analyzes recent mergers and acquisitions (M&A) within the industry, including deal values (e.g., a $XX million acquisition of Company X by Company Y in 2023). This identifies strategic investment trends and consolidation in the market.
Slash Resistant Clothing Industry Trends & Insights
This section delves into the key trends shaping the slash resistant clothing market. We examine market growth drivers, technological advancements, shifting consumer preferences, and competitive dynamics. This analysis will cover the historical period (2019-2024) and project future trends (2025-2033).
The market's growth is driven by several factors, including the increasing demand for personal safety equipment across various sectors (law enforcement, security, healthcare), the rising awareness of workplace safety, and technological improvements in materials science that lead to lighter and more comfortable slash-resistant garments. Furthermore, the report will identify and analyze emerging trends, such as the integration of smart technologies into slash-resistant clothing, and the growth of e-commerce channels for sales. The estimated CAGR for the forecast period is XX%, reflecting the strong growth potential within this market. Market penetration in key segments will also be explored, indicating the percentage of target markets currently using slash-resistant apparel and projections for future adoption. Competitive dynamics are evaluated through analysis of market strategies employed by leading players including pricing, product differentiation, and marketing.
Dominant Markets & Segments in Slash Resistant Clothing
This section identifies the leading regions, countries, and segments within the slash resistant clothing market. We provide a detailed dominance analysis for the leading segment, outlining the factors contributing to its success.
- Dominant Region/Country: [Detailed analysis of the dominant region/country, highlighting specific factors like economic development, regulatory environment, and consumer behavior. For example, North America might be highlighted due to strong demand from law enforcement agencies.]
- Key Drivers of Dominance:
- Strong Economic Growth: [Examples of economic policies promoting safety and security investments.]
- Favorable Regulatory Landscape: [Discussion of specific regulations or standards that drive market adoption.]
- High Awareness of Personal Safety: [Analysis of cultural or societal factors driving demand for safety apparel.]
- Robust Infrastructure: [Examples of infrastructure factors supporting the market, like efficient supply chains.]
Slash Resistant Clothing Product Developments
This section summarizes recent innovations in slash-resistant clothing. New materials, improved designs, and enhanced functionalities are driving the evolution of the product landscape. For example, the development of lighter, more flexible materials allows for increased comfort and agility without compromising protection. The integration of smart technologies, such as GPS tracking or body-worn cameras, is another significant trend expanding the applications of slash resistant clothing. This section also highlights how these product innovations are shaping competitive advantages, enabling companies to offer differentiated products that meet evolving customer needs and safety requirements.
Report Scope & Segmentation Analysis
The report segments the slash-resistant clothing market based on factors like material type (e.g., Kevlar, Dyneema), end-user industry (e.g., law enforcement, security, healthcare), product type (e.g., vests, jackets, pants), and region. Each segment's size and growth potential are analyzed individually, revealing specific opportunities and challenges within each sub-market. Growth projections for each segment will be included, along with an assessment of competitive dynamics and market share distribution.
Material Type: [Analysis of different material types and their respective market shares.] End-User Industry: [Analysis of different end-user industries and their market shares. E.g., the growth rate of law enforcement-specific clothing might be higher than other sectors.] Product Type: [Analysis of different product types and their market shares.] Region: [Analysis of regional differences in market size and growth potential.]
Key Drivers of Slash Resistant Clothing Growth
Several factors contribute to the growth of the slash resistant clothing market. These include technological advancements in material science, leading to lighter, more comfortable, and more effective protective apparel. Strong economic growth in certain regions, particularly those experiencing increasing demand for safety and security measures, also fuels market growth. Additionally, stringent government regulations mandating personal protective equipment (PPE) in specific industries drive demand and innovation.
Challenges in the Slash Resistant Clothing Sector
The slash resistant clothing sector faces various challenges. These include the high cost of materials and manufacturing, impacting the affordability and accessibility of this equipment, particularly in developing economies. Supply chain disruptions can also affect production and availability. Intense competition among established players and the entry of new market participants create pressure on pricing and profitability. Regulatory compliance requirements, which vary by region and industry, add complexity and cost. These challenges vary in significance based on the product type, end-user industry and region.
Emerging Opportunities in Slash Resistant Clothing
Despite challenges, significant opportunities exist within the slash resistant clothing market. The integration of smart technologies into these garments opens new avenues for product development and increased functionality. Expanding into new markets, particularly those with growing demand for safety and security solutions, provides significant potential for growth. Customization and personalization options cater to a wider range of customer needs, particularly in specialized applications. Focusing on sustainability and eco-friendly materials can tap into an expanding environmentally-conscious market.
Key Developments in Slash Resistant Clothing Industry
- [Month, Year]: Launch of a new lightweight slash-resistant fabric by Company X.
- [Month, Year]: Acquisition of Company Y by Company Z, expanding market reach and product portfolio.
- [Month, Year]: Introduction of a new standard for slash-resistant clothing in Region A.
- [Month, Year]: Significant investment in R&D for improved slash-resistant materials by Company W.
Strategic Outlook for Slash Resistant Clothing Market
The future of the slash-resistant clothing market appears promising, driven by continued technological advancements, increasing demand for personal safety equipment, and the expansion of target markets. The integration of smart technologies and the development of sustainable, eco-friendly materials present significant opportunities. Strategic partnerships, investments in R&D, and a focus on innovative product development will be crucial for companies seeking to capture a significant share of this growing market. The market is projected to witness strong growth in the coming years, with significant potential for expansion in emerging markets and specialized applications.
Slash Resistant Clothing Segmentation
-
1. Application
- 1.1. Military
- 1.2. Law Enforcement
- 1.3. Safety
- 1.4. Industry and Manufacturing
- 1.5. Others
-
2. Types
- 2.1. Jacket
- 2.2. Coveralls
- 2.3. Others
Slash Resistant Clothing Segmentation By Geography
-
1. North America
- 1.1. United States
- 1.2. Canada
- 1.3. Mexico
-
2. South America
- 2.1. Brazil
- 2.2. Argentina
- 2.3. Rest of South America
-
3. Europe
- 3.1. United Kingdom
- 3.2. Germany
- 3.3. France
- 3.4. Italy
- 3.5. Spain
- 3.6. Russia
- 3.7. Benelux
- 3.8. Nordics
- 3.9. Rest of Europe
-
4. Middle East & Africa
- 4.1. Turkey
- 4.2. Israel
- 4.3. GCC
- 4.4. North Africa
- 4.5. South Africa
- 4.6. Rest of Middle East & Africa
-
5. Asia Pacific
- 5.1. China
- 5.2. India
- 5.3. Japan
- 5.4. South Korea
- 5.5. ASEAN
- 5.6. Oceania
- 5.7. Rest of Asia Pacific

Slash Resistant Clothing Regional Market Share
Geographic Coverage of Slash Resistant Clothing
Slash Resistant Clothing REPORT HIGHLIGHTS
| Aspects | Details |
|---|---|
| Study Period | 2020-2034 |
| Base Year | 2025 |
| Estimated Year | 2026 |
| Forecast Period | 2026-2034 |
| Historical Period | 2020-2025 |
| Growth Rate | CAGR of 5.48% from 2020-2034 |
| Segmentation |
|
Table of Contents
- 1. Introduction
- 1.1. Research Scope
- 1.2. Market Segmentation
- 1.3. Research Objective
- 1.4. Definitions and Assumptions
- 2. Executive Summary
- 2.1. Market Snapshot
- 3. Market Dynamics
- 3.1. Market Drivers
- 3.2. Market Restrains
- 3.3. Market Trends
- 3.4. Market Opportunities
- 4. Market Factor Analysis
- 4.1. Porters Five Forces
- 4.1.1. Bargaining Power of Suppliers
- 4.1.2. Bargaining Power of Buyers
- 4.1.3. Threat of New Entrants
- 4.1.4. Threat of Substitutes
- 4.1.5. Competitive Rivalry
- 4.2. PESTEL analysis
- 4.3. BCG Analysis
- 4.3.1. Stars (High Growth, High Market Share)
- 4.3.2. Cash Cows (Low Growth, High Market Share)
- 4.3.3. Question Mark (High Growth, Low Market Share)
- 4.3.4. Dogs (Low Growth, Low Market Share)
- 4.4. Ansoff Matrix Analysis
- 4.5. Supply Chain Analysis
- 4.6. Regulatory Landscape
- 4.7. Current Market Potential and Opportunity Assessment (TAM–SAM–SOM Framework)
- 4.8. RAX Analyst Note
- 4.1. Porters Five Forces
- 5. Market Analysis, Insights and Forecast 2021-2033
- 5.1. Market Analysis, Insights and Forecast - by Application
- 5.1.1. Military
- 5.1.2. Law Enforcement
- 5.1.3. Safety
- 5.1.4. Industry and Manufacturing
- 5.1.5. Others
- 5.2. Market Analysis, Insights and Forecast - by Types
- 5.2.1. Jacket
- 5.2.2. Coveralls
- 5.2.3. Others
- 5.3. Market Analysis, Insights and Forecast - by Region
- 5.3.1. North America
- 5.3.2. South America
- 5.3.3. Europe
- 5.3.4. Middle East & Africa
- 5.3.5. Asia Pacific
- 5.1. Market Analysis, Insights and Forecast - by Application
- 6. Global Slash Resistant Clothing Analysis, Insights and Forecast, 2021-2033
- 6.1. Market Analysis, Insights and Forecast - by Application
- 6.1.1. Military
- 6.1.2. Law Enforcement
- 6.1.3. Safety
- 6.1.4. Industry and Manufacturing
- 6.1.5. Others
- 6.2. Market Analysis, Insights and Forecast - by Types
- 6.2.1. Jacket
- 6.2.2. Coveralls
- 6.2.3. Others
- 6.1. Market Analysis, Insights and Forecast - by Application
- 7. North America Slash Resistant Clothing Analysis, Insights and Forecast, 2020-2032
- 7.1. Market Analysis, Insights and Forecast - by Application
- 7.1.1. Military
- 7.1.2. Law Enforcement
- 7.1.3. Safety
- 7.1.4. Industry and Manufacturing
- 7.1.5. Others
- 7.2. Market Analysis, Insights and Forecast - by Types
- 7.2.1. Jacket
- 7.2.2. Coveralls
- 7.2.3. Others
- 7.1. Market Analysis, Insights and Forecast - by Application
- 8. South America Slash Resistant Clothing Analysis, Insights and Forecast, 2020-2032
- 8.1. Market Analysis, Insights and Forecast - by Application
- 8.1.1. Military
- 8.1.2. Law Enforcement
- 8.1.3. Safety
- 8.1.4. Industry and Manufacturing
- 8.1.5. Others
- 8.2. Market Analysis, Insights and Forecast - by Types
- 8.2.1. Jacket
- 8.2.2. Coveralls
- 8.2.3. Others
- 8.1. Market Analysis, Insights and Forecast - by Application
- 9. Europe Slash Resistant Clothing Analysis, Insights and Forecast, 2020-2032
- 9.1. Market Analysis, Insights and Forecast - by Application
- 9.1.1. Military
- 9.1.2. Law Enforcement
- 9.1.3. Safety
- 9.1.4. Industry and Manufacturing
- 9.1.5. Others
- 9.2. Market Analysis, Insights and Forecast - by Types
- 9.2.1. Jacket
- 9.2.2. Coveralls
- 9.2.3. Others
- 9.1. Market Analysis, Insights and Forecast - by Application
- 10. Middle East & Africa Slash Resistant Clothing Analysis, Insights and Forecast, 2020-2032
- 10.1. Market Analysis, Insights and Forecast - by Application
- 10.1.1. Military
- 10.1.2. Law Enforcement
- 10.1.3. Safety
- 10.1.4. Industry and Manufacturing
- 10.1.5. Others
- 10.2. Market Analysis, Insights and Forecast - by Types
- 10.2.1. Jacket
- 10.2.2. Coveralls
- 10.2.3. Others
- 10.1. Market Analysis, Insights and Forecast - by Application
- 11. Asia Pacific Slash Resistant Clothing Analysis, Insights and Forecast, 2020-2032
- 11.1. Market Analysis, Insights and Forecast - by Application
- 11.1.1. Military
- 11.1.2. Law Enforcement
- 11.1.3. Safety
- 11.1.4. Industry and Manufacturing
- 11.1.5. Others
- 11.2. Market Analysis, Insights and Forecast - by Types
- 11.2.1. Jacket
- 11.2.2. Coveralls
- 11.2.3. Others
- 11.1. Market Analysis, Insights and Forecast - by Application
- 12. Competitive Analysis
- 12.1. Company Profiles
- 12.1.1 Friedrich Münch GmbH + Co KG
- 12.1.1.1. Company Overview
- 12.1.1.2. Products
- 12.1.1.3. Company Financials
- 12.1.1.4. SWOT Analysis
- 12.1.2 PPSS
- 12.1.2.1. Company Overview
- 12.1.2.2. Products
- 12.1.2.3. Company Financials
- 12.1.2.4. SWOT Analysis
- 12.1.3 SlashPRO
- 12.1.3.1. Company Overview
- 12.1.3.2. Products
- 12.1.3.3. Company Financials
- 12.1.3.4. SWOT Analysis
- 12.1.4 Tuff-N-Lite
- 12.1.4.1. Company Overview
- 12.1.4.2. Products
- 12.1.4.3. Company Financials
- 12.1.4.4. SWOT Analysis
- 12.1.5 Niroprotac
- 12.1.5.1. Company Overview
- 12.1.5.2. Products
- 12.1.5.3. Company Financials
- 12.1.5.4. SWOT Analysis
- 12.1.6 Oroel
- 12.1.6.1. Company Overview
- 12.1.6.2. Products
- 12.1.6.3. Company Financials
- 12.1.6.4. SWOT Analysis
- 12.1.7 EDC Protection
- 12.1.7.1. Company Overview
- 12.1.7.2. Products
- 12.1.7.3. Company Financials
- 12.1.7.4. SWOT Analysis
- 12.1.8 Body Armor
- 12.1.8.1. Company Overview
- 12.1.8.2. Products
- 12.1.8.3. Company Financials
- 12.1.8.4. SWOT Analysis
- 12.1.9 MTP
- 12.1.9.1. Company Overview
- 12.1.9.2. Products
- 12.1.9.3. Company Financials
- 12.1.9.4. SWOT Analysis
- 12.1.10 Kozane
- 12.1.10.1. Company Overview
- 12.1.10.2. Products
- 12.1.10.3. Company Financials
- 12.1.10.4. SWOT Analysis
- 12.1.11 Stomex
- 12.1.11.1. Company Overview
- 12.1.11.2. Products
- 12.1.11.3. Company Financials
- 12.1.11.4. SWOT Analysis
- 12.1.12 Magid
- 12.1.12.1. Company Overview
- 12.1.12.2. Products
- 12.1.12.3. Company Financials
- 12.1.12.4. SWOT Analysis
- 12.1.13 Granberg AS
- 12.1.13.1. Company Overview
- 12.1.13.2. Products
- 12.1.13.3. Company Financials
- 12.1.13.4. SWOT Analysis
- 12.1.14 Ansell
- 12.1.14.1. Company Overview
- 12.1.14.2. Products
- 12.1.14.3. Company Financials
- 12.1.14.4. SWOT Analysis
- 12.1.1 Friedrich Münch GmbH + Co KG
- 12.2. Market Entropy
- 12.2.1 Company's Key Areas Served
- 12.2.2 Recent Developments
- 12.3. Company Market Share Analysis 2025
- 12.3.1 Top 5 Companies Market Share Analysis
- 12.3.2 Top 3 Companies Market Share Analysis
- 12.4. List of Potential Customers
- 13. Research Methodology
List of Figures
- Figure 1: Global Slash Resistant Clothing Revenue Breakdown (billion, %) by Region 2025 & 2033
- Figure 2: Global Slash Resistant Clothing Volume Breakdown (K, %) by Region 2025 & 2033
- Figure 3: North America Slash Resistant Clothing Revenue (billion), by Application 2025 & 2033
- Figure 4: North America Slash Resistant Clothing Volume (K), by Application 2025 & 2033
- Figure 5: North America Slash Resistant Clothing Revenue Share (%), by Application 2025 & 2033
- Figure 6: North America Slash Resistant Clothing Volume Share (%), by Application 2025 & 2033
- Figure 7: North America Slash Resistant Clothing Revenue (billion), by Types 2025 & 2033
- Figure 8: North America Slash Resistant Clothing Volume (K), by Types 2025 & 2033
- Figure 9: North America Slash Resistant Clothing Revenue Share (%), by Types 2025 & 2033
- Figure 10: North America Slash Resistant Clothing Volume Share (%), by Types 2025 & 2033
- Figure 11: North America Slash Resistant Clothing Revenue (billion), by Country 2025 & 2033
- Figure 12: North America Slash Resistant Clothing Volume (K), by Country 2025 & 2033
- Figure 13: North America Slash Resistant Clothing Revenue Share (%), by Country 2025 & 2033
- Figure 14: North America Slash Resistant Clothing Volume Share (%), by Country 2025 & 2033
- Figure 15: South America Slash Resistant Clothing Revenue (billion), by Application 2025 & 2033
- Figure 16: South America Slash Resistant Clothing Volume (K), by Application 2025 & 2033
- Figure 17: South America Slash Resistant Clothing Revenue Share (%), by Application 2025 & 2033
- Figure 18: South America Slash Resistant Clothing Volume Share (%), by Application 2025 & 2033
- Figure 19: South America Slash Resistant Clothing Revenue (billion), by Types 2025 & 2033
- Figure 20: South America Slash Resistant Clothing Volume (K), by Types 2025 & 2033
- Figure 21: South America Slash Resistant Clothing Revenue Share (%), by Types 2025 & 2033
- Figure 22: South America Slash Resistant Clothing Volume Share (%), by Types 2025 & 2033
- Figure 23: South America Slash Resistant Clothing Revenue (billion), by Country 2025 & 2033
- Figure 24: South America Slash Resistant Clothing Volume (K), by Country 2025 & 2033
- Figure 25: South America Slash Resistant Clothing Revenue Share (%), by Country 2025 & 2033
- Figure 26: South America Slash Resistant Clothing Volume Share (%), by Country 2025 & 2033
- Figure 27: Europe Slash Resistant Clothing Revenue (billion), by Application 2025 & 2033
- Figure 28: Europe Slash Resistant Clothing Volume (K), by Application 2025 & 2033
- Figure 29: Europe Slash Resistant Clothing Revenue Share (%), by Application 2025 & 2033
- Figure 30: Europe Slash Resistant Clothing Volume Share (%), by Application 2025 & 2033
- Figure 31: Europe Slash Resistant Clothing Revenue (billion), by Types 2025 & 2033
- Figure 32: Europe Slash Resistant Clothing Volume (K), by Types 2025 & 2033
- Figure 33: Europe Slash Resistant Clothing Revenue Share (%), by Types 2025 & 2033
- Figure 34: Europe Slash Resistant Clothing Volume Share (%), by Types 2025 & 2033
- Figure 35: Europe Slash Resistant Clothing Revenue (billion), by Country 2025 & 2033
- Figure 36: Europe Slash Resistant Clothing Volume (K), by Country 2025 & 2033
- Figure 37: Europe Slash Resistant Clothing Revenue Share (%), by Country 2025 & 2033
- Figure 38: Europe Slash Resistant Clothing Volume Share (%), by Country 2025 & 2033
- Figure 39: Middle East & Africa Slash Resistant Clothing Revenue (billion), by Application 2025 & 2033
- Figure 40: Middle East & Africa Slash Resistant Clothing Volume (K), by Application 2025 & 2033
- Figure 41: Middle East & Africa Slash Resistant Clothing Revenue Share (%), by Application 2025 & 2033
- Figure 42: Middle East & Africa Slash Resistant Clothing Volume Share (%), by Application 2025 & 2033
- Figure 43: Middle East & Africa Slash Resistant Clothing Revenue (billion), by Types 2025 & 2033
- Figure 44: Middle East & Africa Slash Resistant Clothing Volume (K), by Types 2025 & 2033
- Figure 45: Middle East & Africa Slash Resistant Clothing Revenue Share (%), by Types 2025 & 2033
- Figure 46: Middle East & Africa Slash Resistant Clothing Volume Share (%), by Types 2025 & 2033
- Figure 47: Middle East & Africa Slash Resistant Clothing Revenue (billion), by Country 2025 & 2033
- Figure 48: Middle East & Africa Slash Resistant Clothing Volume (K), by Country 2025 & 2033
- Figure 49: Middle East & Africa Slash Resistant Clothing Revenue Share (%), by Country 2025 & 2033
- Figure 50: Middle East & Africa Slash Resistant Clothing Volume Share (%), by Country 2025 & 2033
- Figure 51: Asia Pacific Slash Resistant Clothing Revenue (billion), by Application 2025 & 2033
- Figure 52: Asia Pacific Slash Resistant Clothing Volume (K), by Application 2025 & 2033
- Figure 53: Asia Pacific Slash Resistant Clothing Revenue Share (%), by Application 2025 & 2033
- Figure 54: Asia Pacific Slash Resistant Clothing Volume Share (%), by Application 2025 & 2033
- Figure 55: Asia Pacific Slash Resistant Clothing Revenue (billion), by Types 2025 & 2033
- Figure 56: Asia Pacific Slash Resistant Clothing Volume (K), by Types 2025 & 2033
- Figure 57: Asia Pacific Slash Resistant Clothing Revenue Share (%), by Types 2025 & 2033
- Figure 58: Asia Pacific Slash Resistant Clothing Volume Share (%), by Types 2025 & 2033
- Figure 59: Asia Pacific Slash Resistant Clothing Revenue (billion), by Country 2025 & 2033
- Figure 60: Asia Pacific Slash Resistant Clothing Volume (K), by Country 2025 & 2033
- Figure 61: Asia Pacific Slash Resistant Clothing Revenue Share (%), by Country 2025 & 2033
- Figure 62: Asia Pacific Slash Resistant Clothing Volume Share (%), by Country 2025 & 2033
List of Tables
- Table 1: Global Slash Resistant Clothing Revenue billion Forecast, by Application 2020 & 2033
- Table 2: Global Slash Resistant Clothing Volume K Forecast, by Application 2020 & 2033
- Table 3: Global Slash Resistant Clothing Revenue billion Forecast, by Types 2020 & 2033
- Table 4: Global Slash Resistant Clothing Volume K Forecast, by Types 2020 & 2033
- Table 5: Global Slash Resistant Clothing Revenue billion Forecast, by Region 2020 & 2033
- Table 6: Global Slash Resistant Clothing Volume K Forecast, by Region 2020 & 2033
- Table 7: Global Slash Resistant Clothing Revenue billion Forecast, by Application 2020 & 2033
- Table 8: Global Slash Resistant Clothing Volume K Forecast, by Application 2020 & 2033
- Table 9: Global Slash Resistant Clothing Revenue billion Forecast, by Types 2020 & 2033
- Table 10: Global Slash Resistant Clothing Volume K Forecast, by Types 2020 & 2033
- Table 11: Global Slash Resistant Clothing Revenue billion Forecast, by Country 2020 & 2033
- Table 12: Global Slash Resistant Clothing Volume K Forecast, by Country 2020 & 2033
- Table 13: United States Slash Resistant Clothing Revenue (billion) Forecast, by Application 2020 & 2033
- Table 14: United States Slash Resistant Clothing Volume (K) Forecast, by Application 2020 & 2033
- Table 15: Canada Slash Resistant Clothing Revenue (billion) Forecast, by Application 2020 & 2033
- Table 16: Canada Slash Resistant Clothing Volume (K) Forecast, by Application 2020 & 2033
- Table 17: Mexico Slash Resistant Clothing Revenue (billion) Forecast, by Application 2020 & 2033
- Table 18: Mexico Slash Resistant Clothing Volume (K) Forecast, by Application 2020 & 2033
- Table 19: Global Slash Resistant Clothing Revenue billion Forecast, by Application 2020 & 2033
- Table 20: Global Slash Resistant Clothing Volume K Forecast, by Application 2020 & 2033
- Table 21: Global Slash Resistant Clothing Revenue billion Forecast, by Types 2020 & 2033
- Table 22: Global Slash Resistant Clothing Volume K Forecast, by Types 2020 & 2033
- Table 23: Global Slash Resistant Clothing Revenue billion Forecast, by Country 2020 & 2033
- Table 24: Global Slash Resistant Clothing Volume K Forecast, by Country 2020 & 2033
- Table 25: Brazil Slash Resistant Clothing Revenue (billion) Forecast, by Application 2020 & 2033
- Table 26: Brazil Slash Resistant Clothing Volume (K) Forecast, by Application 2020 & 2033
- Table 27: Argentina Slash Resistant Clothing Revenue (billion) Forecast, by Application 2020 & 2033
- Table 28: Argentina Slash Resistant Clothing Volume (K) Forecast, by Application 2020 & 2033
- Table 29: Rest of South America Slash Resistant Clothing Revenue (billion) Forecast, by Application 2020 & 2033
- Table 30: Rest of South America Slash Resistant Clothing Volume (K) Forecast, by Application 2020 & 2033
- Table 31: Global Slash Resistant Clothing Revenue billion Forecast, by Application 2020 & 2033
- Table 32: Global Slash Resistant Clothing Volume K Forecast, by Application 2020 & 2033
- Table 33: Global Slash Resistant Clothing Revenue billion Forecast, by Types 2020 & 2033
- Table 34: Global Slash Resistant Clothing Volume K Forecast, by Types 2020 & 2033
- Table 35: Global Slash Resistant Clothing Revenue billion Forecast, by Country 2020 & 2033
- Table 36: Global Slash Resistant Clothing Volume K Forecast, by Country 2020 & 2033
- Table 37: United Kingdom Slash Resistant Clothing Revenue (billion) Forecast, by Application 2020 & 2033
- Table 38: United Kingdom Slash Resistant Clothing Volume (K) Forecast, by Application 2020 & 2033
- Table 39: Germany Slash Resistant Clothing Revenue (billion) Forecast, by Application 2020 & 2033
- Table 40: Germany Slash Resistant Clothing Volume (K) Forecast, by Application 2020 & 2033
- Table 41: France Slash Resistant Clothing Revenue (billion) Forecast, by Application 2020 & 2033
- Table 42: France Slash Resistant Clothing Volume (K) Forecast, by Application 2020 & 2033
- Table 43: Italy Slash Resistant Clothing Revenue (billion) Forecast, by Application 2020 & 2033
- Table 44: Italy Slash Resistant Clothing Volume (K) Forecast, by Application 2020 & 2033
- Table 45: Spain Slash Resistant Clothing Revenue (billion) Forecast, by Application 2020 & 2033
- Table 46: Spain Slash Resistant Clothing Volume (K) Forecast, by Application 2020 & 2033
- Table 47: Russia Slash Resistant Clothing Revenue (billion) Forecast, by Application 2020 & 2033
- Table 48: Russia Slash Resistant Clothing Volume (K) Forecast, by Application 2020 & 2033
- Table 49: Benelux Slash Resistant Clothing Revenue (billion) Forecast, by Application 2020 & 2033
- Table 50: Benelux Slash Resistant Clothing Volume (K) Forecast, by Application 2020 & 2033
- Table 51: Nordics Slash Resistant Clothing Revenue (billion) Forecast, by Application 2020 & 2033
- Table 52: Nordics Slash Resistant Clothing Volume (K) Forecast, by Application 2020 & 2033
- Table 53: Rest of Europe Slash Resistant Clothing Revenue (billion) Forecast, by Application 2020 & 2033
- Table 54: Rest of Europe Slash Resistant Clothing Volume (K) Forecast, by Application 2020 & 2033
- Table 55: Global Slash Resistant Clothing Revenue billion Forecast, by Application 2020 & 2033
- Table 56: Global Slash Resistant Clothing Volume K Forecast, by Application 2020 & 2033
- Table 57: Global Slash Resistant Clothing Revenue billion Forecast, by Types 2020 & 2033
- Table 58: Global Slash Resistant Clothing Volume K Forecast, by Types 2020 & 2033
- Table 59: Global Slash Resistant Clothing Revenue billion Forecast, by Country 2020 & 2033
- Table 60: Global Slash Resistant Clothing Volume K Forecast, by Country 2020 & 2033
- Table 61: Turkey Slash Resistant Clothing Revenue (billion) Forecast, by Application 2020 & 2033
- Table 62: Turkey Slash Resistant Clothing Volume (K) Forecast, by Application 2020 & 2033
- Table 63: Israel Slash Resistant Clothing Revenue (billion) Forecast, by Application 2020 & 2033
- Table 64: Israel Slash Resistant Clothing Volume (K) Forecast, by Application 2020 & 2033
- Table 65: GCC Slash Resistant Clothing Revenue (billion) Forecast, by Application 2020 & 2033
- Table 66: GCC Slash Resistant Clothing Volume (K) Forecast, by Application 2020 & 2033
- Table 67: North Africa Slash Resistant Clothing Revenue (billion) Forecast, by Application 2020 & 2033
- Table 68: North Africa Slash Resistant Clothing Volume (K) Forecast, by Application 2020 & 2033
- Table 69: South Africa Slash Resistant Clothing Revenue (billion) Forecast, by Application 2020 & 2033
- Table 70: South Africa Slash Resistant Clothing Volume (K) Forecast, by Application 2020 & 2033
- Table 71: Rest of Middle East & Africa Slash Resistant Clothing Revenue (billion) Forecast, by Application 2020 & 2033
- Table 72: Rest of Middle East & Africa Slash Resistant Clothing Volume (K) Forecast, by Application 2020 & 2033
- Table 73: Global Slash Resistant Clothing Revenue billion Forecast, by Application 2020 & 2033
- Table 74: Global Slash Resistant Clothing Volume K Forecast, by Application 2020 & 2033
- Table 75: Global Slash Resistant Clothing Revenue billion Forecast, by Types 2020 & 2033
- Table 76: Global Slash Resistant Clothing Volume K Forecast, by Types 2020 & 2033
- Table 77: Global Slash Resistant Clothing Revenue billion Forecast, by Country 2020 & 2033
- Table 78: Global Slash Resistant Clothing Volume K Forecast, by Country 2020 & 2033
- Table 79: China Slash Resistant Clothing Revenue (billion) Forecast, by Application 2020 & 2033
- Table 80: China Slash Resistant Clothing Volume (K) Forecast, by Application 2020 & 2033
- Table 81: India Slash Resistant Clothing Revenue (billion) Forecast, by Application 2020 & 2033
- Table 82: India Slash Resistant Clothing Volume (K) Forecast, by Application 2020 & 2033
- Table 83: Japan Slash Resistant Clothing Revenue (billion) Forecast, by Application 2020 & 2033
- Table 84: Japan Slash Resistant Clothing Volume (K) Forecast, by Application 2020 & 2033
- Table 85: South Korea Slash Resistant Clothing Revenue (billion) Forecast, by Application 2020 & 2033
- Table 86: South Korea Slash Resistant Clothing Volume (K) Forecast, by Application 2020 & 2033
- Table 87: ASEAN Slash Resistant Clothing Revenue (billion) Forecast, by Application 2020 & 2033
- Table 88: ASEAN Slash Resistant Clothing Volume (K) Forecast, by Application 2020 & 2033
- Table 89: Oceania Slash Resistant Clothing Revenue (billion) Forecast, by Application 2020 & 2033
- Table 90: Oceania Slash Resistant Clothing Volume (K) Forecast, by Application 2020 & 2033
- Table 91: Rest of Asia Pacific Slash Resistant Clothing Revenue (billion) Forecast, by Application 2020 & 2033
- Table 92: Rest of Asia Pacific Slash Resistant Clothing Volume (K) Forecast, by Application 2020 & 2033
Frequently Asked Questions
1. What is the projected Compound Annual Growth Rate (CAGR) of the Slash Resistant Clothing?
The projected CAGR is approximately 5.48%.
2. Which companies are prominent players in the Slash Resistant Clothing?
Key companies in the market include Friedrich Münch GmbH + Co KG, PPSS, SlashPRO, Tuff-N-Lite, Niroprotac, Oroel, EDC Protection, Body Armor, MTP, Kozane, Stomex, Magid, Granberg AS, Ansell.
3. What are the main segments of the Slash Resistant Clothing?
The market segments include Application, Types.
4. Can you provide details about the market size?
The market size is estimated to be USD 11.53 billion as of 2022.
5. What are some drivers contributing to market growth?
N/A
6. What are the notable trends driving market growth?
N/A
7. Are there any restraints impacting market growth?
N/A
8. Can you provide examples of recent developments in the market?
N/A
9. What pricing options are available for accessing the report?
Pricing options include single-user, multi-user, and enterprise licenses priced at USD 3350.00, USD 5025.00, and USD 6700.00 respectively.
10. Is the market size provided in terms of value or volume?
The market size is provided in terms of value, measured in billion and volume, measured in K.
11. Are there any specific market keywords associated with the report?
Yes, the market keyword associated with the report is "Slash Resistant Clothing," which aids in identifying and referencing the specific market segment covered.
12. How do I determine which pricing option suits my needs best?
The pricing options vary based on user requirements and access needs. Individual users may opt for single-user licenses, while businesses requiring broader access may choose multi-user or enterprise licenses for cost-effective access to the report.
13. Are there any additional resources or data provided in the Slash Resistant Clothing report?
While the report offers comprehensive insights, it's advisable to review the specific contents or supplementary materials provided to ascertain if additional resources or data are available.
14. How can I stay updated on further developments or reports in the Slash Resistant Clothing?
To stay informed about further developments, trends, and reports in the Slash Resistant Clothing, consider subscribing to industry newsletters, following relevant companies and organizations, or regularly checking reputable industry news sources and publications.
Methodology
Step 1 - Identification of Relevant Samples Size from Population Database


Step 2 - Approaches for Defining Global Market Size (Value, Volume* & Price*)

Note*: In applicable scenarios
Step 3 - Data Sources
Primary Research
- Web Analytics
- Survey Reports
- Research Institute
- Latest Research Reports
- Opinion Leaders
Secondary Research
- Annual Reports
- White Paper
- Latest Press Release
- Industry Association
- Paid Database
- Investor Presentations

Step 4 - Data Triangulation
Involves using different sources of information in order to increase the validity of a study
These sources are likely to be stakeholders in a program - participants, other researchers, program staff, other community members, and so on.
Then we put all data in single framework & apply various statistical tools to find out the dynamic on the market.
During the analysis stage, feedback from the stakeholder groups would be compared to determine areas of agreement as well as areas of divergence

