

Key Insights
The global smart cash register market is poised for significant expansion, fueled by the increasing integration of digital technologies within the retail landscape. Key drivers include the growing preference for cashless transactions, the imperative for streamlined inventory management, and the demand for real-time business intelligence. Smart cash registers are instrumental in boosting operational efficiency, minimizing errors, and elevating the customer experience across businesses of all scales. The market is segmented by critical features such as touchscreen interfaces, integrated payment solutions, and cloud connectivity; deployment models including cloud-based and on-premise options; and diverse end-user industries like restaurants, retail establishments, and grocery outlets. Leading innovators such as Toshiba, NCR, and Diebold Nixdorf are strategically investing in research and development to advance their offerings and maintain market leadership. A notable trend is the escalating demand for cloud-based smart cash registers, attributed to their inherent scalability, accessibility, and cost-effectiveness. The incorporation of advanced functionalities, including customer relationship management (CRM) systems and loyalty programs, further amplifies the value proposition of these solutions.
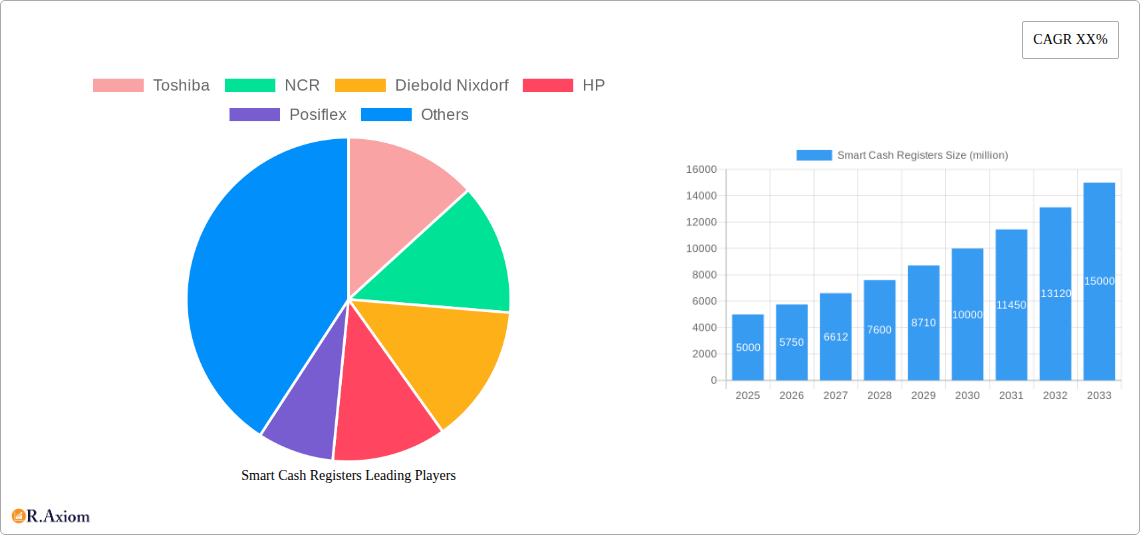
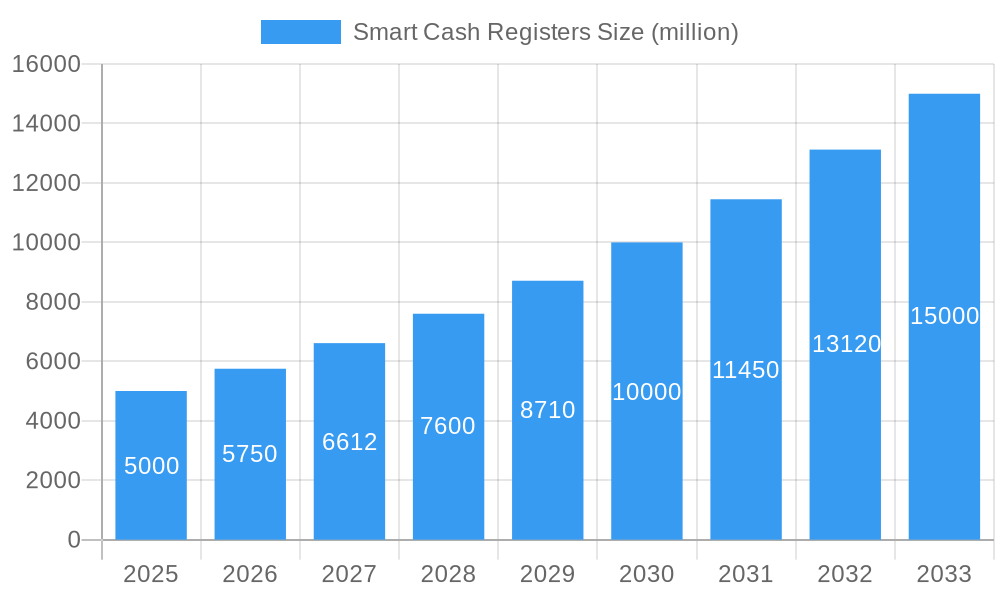
Smart Cash Registers Market Size (In Billion)
While the market outlook is predominantly positive, certain challenges warrant consideration. The substantial upfront investment costs and the prerequisite for reliable internet connectivity in specific geographies may present adoption hurdles, particularly for smaller enterprises. Furthermore, the intricate process of integrating smart cash registers with existing point-of-sale (POS) systems, coupled with the ongoing need for software updates and maintenance, represents potential obstacles. Nevertheless, the substantial long-term advantages of enhanced operational efficiency and superior data analytics capabilities are anticipated to outweigh these challenges, ensuring sustained market growth.
Smart Cash Registers Company Market Share
We project the market size to reach $2561 million in 2025, with a compound annual growth rate (CAGR) of 1.5% from the 2025 base year to 2033. This forecast is informed by a comprehensive analysis of publicly available data, industry reports, and expert insights, meticulously considering prevailing market dynamics and competitive landscapes.
This in-depth report delivers a thorough examination of the global smart cash register market, offering crucial intelligence for industry stakeholders, investors, and businesses aiming to navigate this evolving sector. The analysis spans the period from 2019 to 2033, with a 2025 base year and a forecast period extending to 2033. Leveraging extensive primary and secondary research, this study provides a robust and accurate representation of market trends and future projections. All monetary values are presented in millions.
Smart Cash Registers Market Concentration & Innovation
This section analyzes the competitive landscape of the smart cash registers market, examining market concentration, innovation drivers, regulatory impacts, substitute products, end-user trends, and merger & acquisition (M&A) activity.
The market is moderately concentrated, with key players such as Toshiba, NCR, and Diebold Nixdorf holding significant market share. However, smaller players continue to innovate and challenge the established giants. The estimated market share for the top 5 players in 2025 is approximately 60%, indicating opportunities for both consolidation and new entrants. M&A activity has been moderate over the historical period (2019-2024), with total deal values exceeding $XX million. Key innovation drivers include the integration of cloud computing, advanced analytics, and improved security features. Regulatory frameworks related to data privacy and security are playing an increasingly important role in shaping market dynamics. The emergence of mobile point-of-sale (mPOS) systems and other alternative payment solutions represents a key substitute for traditional smart cash registers.
- Market Concentration: High, with xx% market share held by top 5 players in 2025.
- Innovation Drivers: Cloud computing, AI, enhanced security.
- Regulatory Frameworks: Data privacy regulations significantly influencing market dynamics.
- M&A Activity: Total deal value exceeded $XX million during 2019-2024.
- End-user Trends: Increasing demand for integrated systems and enhanced data analytics capabilities.
Smart Cash Registers Industry Trends & Insights
This section delves into the key trends shaping the smart cash registers market. The market exhibits robust growth, driven by the increasing adoption of digital technologies in the retail and hospitality sectors. Technological advancements, such as the integration of AI and IoT, are creating new opportunities for enhanced efficiency and customer experience. Consumer preferences are shifting towards faster and more convenient checkout experiences, leading to higher demand for streamlined and user-friendly smart cash registers. The competitive landscape is characterized by intense innovation and ongoing efforts to differentiate product offerings. The Compound Annual Growth Rate (CAGR) for the smart cash registers market is estimated to be xx% during the forecast period (2025-2033). Market penetration is expected to reach xx% by 2033.
Dominant Markets & Segments in Smart Cash Registers
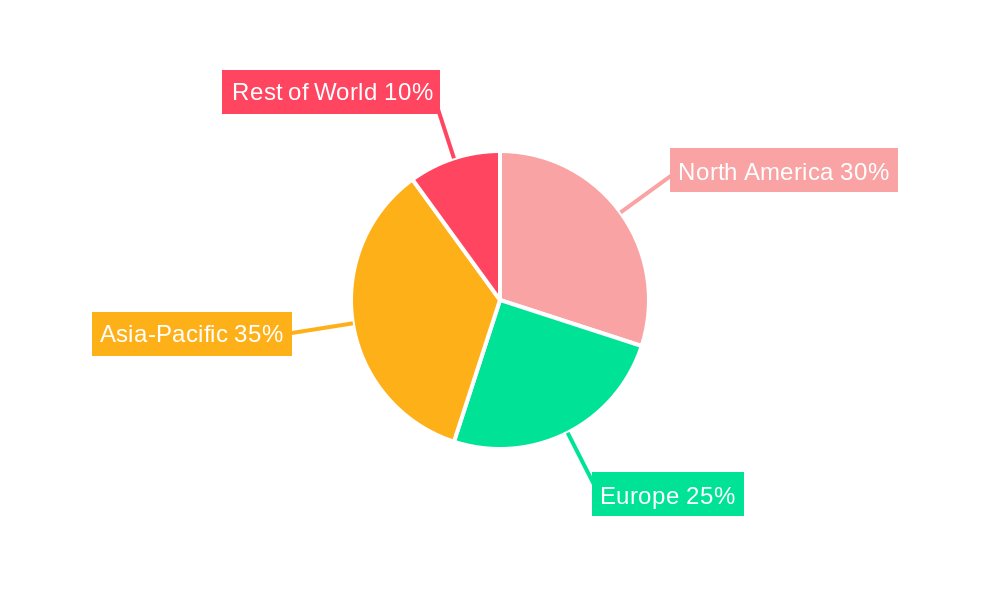
This section identifies the leading geographical regions and market segments within the smart cash registers market. The North American region is currently the dominant market, driven by factors such as high retail density, strong technological adoption, and advanced infrastructure.
- Key Drivers in North America:
- Strong retail sector.
- High technology adoption rate.
- Developed infrastructure.
- Supportive regulatory environment.
- Dominance Analysis: North America maintains a significant market share, fueled by high consumer spending and technological advancements. However, growth in Asia-Pacific and other emerging economies is expected to accelerate, driven by increasing urbanization and a growing middle class.
Smart Cash Registers Product Developments
Recent product innovations focus on enhanced features like touchscreen interfaces, integrated payment processing, inventory management capabilities, and seamless integration with other business systems. These advancements aim to improve operational efficiency and provide richer customer data for improved decision-making. The market is seeing a trend toward cloud-based solutions that offer scalability, accessibility, and reduced IT infrastructure costs. This enhances competitive advantage by simplifying updates, data analytics, and customer service.
Report Scope & Segmentation Analysis
This report segments the smart cash registers market based on several key factors, including product type (e.g., cloud-based, on-premise), application (e.g., retail, restaurants), and geography. Each segment exhibits unique growth characteristics and competitive dynamics. Specific growth projections and market size estimations are available for each segment within the full report. The competitive dynamics vary across segments, influenced by factors such as technological maturity and market concentration.
Key Drivers of Smart Cash Registers Growth
The growth of the smart cash register market is propelled by several key factors. Technological advancements, such as AI-powered features and improved connectivity, enhance efficiency and data analytics capabilities. The increasing demand for improved customer experiences and streamlined operations drives adoption across various industries. Favorable government policies and initiatives promoting digitalization further contribute to market expansion.
Challenges in the Smart Cash Registers Sector
The smart cash registers sector faces several challenges. High initial investment costs for businesses can hinder widespread adoption, particularly among smaller enterprises. Maintaining data security and ensuring compliance with stringent privacy regulations are ongoing concerns. The competitive landscape necessitates continuous innovation and adaptation to retain market share. Supply chain disruptions can affect product availability and increase costs.
Emerging Opportunities in Smart Cash Registers
The smart cash registers market presents several promising opportunities. Expanding into emerging markets with high growth potential represents a key avenue for growth. Developing innovative features that address specific industry needs, such as customized reporting and advanced analytics, creates new avenues for differentiation. Exploring partnerships with complementary technology providers can unlock new opportunities for market expansion.
Key Developments in Smart Cash Registers Industry
- 2023 Q4: NCR launched a new cloud-based smart cash register with advanced analytics capabilities.
- 2022 Q3: Toshiba and Partner announced a strategic partnership to expand their reach in the Asian market.
- 2021 Q1: Diebold Nixdorf acquired a smaller competitor, expanding its product portfolio. (Further details on acquisitions and product launches would be included in the full report)
Strategic Outlook for Smart Cash Registers Market
The smart cash registers market is poised for continued growth, driven by factors such as rising digitalization across industries and increasing adoption of innovative payment solutions. Opportunities exist in expanding into new markets, developing enhanced features, and forging strategic partnerships. The market is expected to witness further consolidation, with larger players acquiring smaller competitors to gain market share and expand their product offerings. Continuous innovation in areas such as AI and IoT will be crucial for success in this dynamic sector.
Smart Cash Registers Segmentation
-
1. Application
- 1.1. Retailing
- 1.2. Catering
- 1.3. Entertainment
- 1.4. Others
-
2. Types
- 2.1. Single Screen
- 2.2. Double Screen
Smart Cash Registers Segmentation By Geography
-
1. North America
- 1.1. United States
- 1.2. Canada
- 1.3. Mexico
-
2. South America
- 2.1. Brazil
- 2.2. Argentina
- 2.3. Rest of South America
-
3. Europe
- 3.1. United Kingdom
- 3.2. Germany
- 3.3. France
- 3.4. Italy
- 3.5. Spain
- 3.6. Russia
- 3.7. Benelux
- 3.8. Nordics
- 3.9. Rest of Europe
-
4. Middle East & Africa
- 4.1. Turkey
- 4.2. Israel
- 4.3. GCC
- 4.4. North Africa
- 4.5. South Africa
- 4.6. Rest of Middle East & Africa
-
5. Asia Pacific
- 5.1. China
- 5.2. India
- 5.3. Japan
- 5.4. South Korea
- 5.5. ASEAN
- 5.6. Oceania
- 5.7. Rest of Asia Pacific
Smart Cash Registers Regional Market Share
Geographic Coverage of Smart Cash Registers
Smart Cash Registers REPORT HIGHLIGHTS
| Aspects | Details |
|---|---|
| Study Period | 2020-2034 |
| Base Year | 2025 |
| Estimated Year | 2026 |
| Forecast Period | 2026-2034 |
| Historical Period | 2020-2025 |
| Growth Rate | CAGR of 1.5% from 2020-2034 |
| Segmentation |
|
Table of Contents
- 1. Introduction
- 1.1. Research Scope
- 1.2. Market Segmentation
- 1.3. Research Methodology
- 1.4. Definitions and Assumptions
- 2. Executive Summary
- 2.1. Introduction
- 3. Market Dynamics
- 3.1. Introduction
- 3.2. Market Drivers
- 3.3. Market Restrains
- 3.4. Market Trends
- 4. Market Factor Analysis
- 4.1. Porters Five Forces
- 4.2. Supply/Value Chain
- 4.3. PESTEL analysis
- 4.4. Market Entropy
- 4.5. Patent/Trademark Analysis
- 5. Global Smart Cash Registers Analysis, Insights and Forecast, 2020-2032
- 5.1. Market Analysis, Insights and Forecast - by Application
- 5.1.1. Retailing
- 5.1.2. Catering
- 5.1.3. Entertainment
- 5.1.4. Others
- 5.2. Market Analysis, Insights and Forecast - by Types
- 5.2.1. Single Screen
- 5.2.2. Double Screen
- 5.3. Market Analysis, Insights and Forecast - by Region
- 5.3.1. North America
- 5.3.2. South America
- 5.3.3. Europe
- 5.3.4. Middle East & Africa
- 5.3.5. Asia Pacific
- 5.1. Market Analysis, Insights and Forecast - by Application
- 6. North America Smart Cash Registers Analysis, Insights and Forecast, 2020-2032
- 6.1. Market Analysis, Insights and Forecast - by Application
- 6.1.1. Retailing
- 6.1.2. Catering
- 6.1.3. Entertainment
- 6.1.4. Others
- 6.2. Market Analysis, Insights and Forecast - by Types
- 6.2.1. Single Screen
- 6.2.2. Double Screen
- 6.1. Market Analysis, Insights and Forecast - by Application
- 7. South America Smart Cash Registers Analysis, Insights and Forecast, 2020-2032
- 7.1. Market Analysis, Insights and Forecast - by Application
- 7.1.1. Retailing
- 7.1.2. Catering
- 7.1.3. Entertainment
- 7.1.4. Others
- 7.2. Market Analysis, Insights and Forecast - by Types
- 7.2.1. Single Screen
- 7.2.2. Double Screen
- 7.1. Market Analysis, Insights and Forecast - by Application
- 8. Europe Smart Cash Registers Analysis, Insights and Forecast, 2020-2032
- 8.1. Market Analysis, Insights and Forecast - by Application
- 8.1.1. Retailing
- 8.1.2. Catering
- 8.1.3. Entertainment
- 8.1.4. Others
- 8.2. Market Analysis, Insights and Forecast - by Types
- 8.2.1. Single Screen
- 8.2.2. Double Screen
- 8.1. Market Analysis, Insights and Forecast - by Application
- 9. Middle East & Africa Smart Cash Registers Analysis, Insights and Forecast, 2020-2032
- 9.1. Market Analysis, Insights and Forecast - by Application
- 9.1.1. Retailing
- 9.1.2. Catering
- 9.1.3. Entertainment
- 9.1.4. Others
- 9.2. Market Analysis, Insights and Forecast - by Types
- 9.2.1. Single Screen
- 9.2.2. Double Screen
- 9.1. Market Analysis, Insights and Forecast - by Application
- 10. Asia Pacific Smart Cash Registers Analysis, Insights and Forecast, 2020-2032
- 10.1. Market Analysis, Insights and Forecast - by Application
- 10.1.1. Retailing
- 10.1.2. Catering
- 10.1.3. Entertainment
- 10.1.4. Others
- 10.2. Market Analysis, Insights and Forecast - by Types
- 10.2.1. Single Screen
- 10.2.2. Double Screen
- 10.1. Market Analysis, Insights and Forecast - by Application
- 11. Competitive Analysis
- 11.1. Global Market Share Analysis 2025
- 11.2. Company Profiles
- 11.2.1 Toshiba
- 11.2.1.1. Overview
- 11.2.1.2. Products
- 11.2.1.3. SWOT Analysis
- 11.2.1.4. Recent Developments
- 11.2.1.5. Financials (Based on Availability)
- 11.2.2 NCR
- 11.2.2.1. Overview
- 11.2.2.2. Products
- 11.2.2.3. SWOT Analysis
- 11.2.2.4. Recent Developments
- 11.2.2.5. Financials (Based on Availability)
- 11.2.3 Diebold Nixdorf
- 11.2.3.1. Overview
- 11.2.3.2. Products
- 11.2.3.3. SWOT Analysis
- 11.2.3.4. Recent Developments
- 11.2.3.5. Financials (Based on Availability)
- 11.2.4 HP
- 11.2.4.1. Overview
- 11.2.4.2. Products
- 11.2.4.3. SWOT Analysis
- 11.2.4.4. Recent Developments
- 11.2.4.5. Financials (Based on Availability)
- 11.2.5 Posiflex
- 11.2.5.1. Overview
- 11.2.5.2. Products
- 11.2.5.3. SWOT Analysis
- 11.2.5.4. Recent Developments
- 11.2.5.5. Financials (Based on Availability)
- 11.2.6 FLYTECH
- 11.2.6.1. Overview
- 11.2.6.2. Products
- 11.2.6.3. SWOT Analysis
- 11.2.6.4. Recent Developments
- 11.2.6.5. Financials (Based on Availability)
- 11.2.7 FEC
- 11.2.7.1. Overview
- 11.2.7.2. Products
- 11.2.7.3. SWOT Analysis
- 11.2.7.4. Recent Developments
- 11.2.7.5. Financials (Based on Availability)
- 11.2.8 Hisense
- 11.2.8.1. Overview
- 11.2.8.2. Products
- 11.2.8.3. SWOT Analysis
- 11.2.8.4. Recent Developments
- 11.2.8.5. Financials (Based on Availability)
- 11.2.9 Partner
- 11.2.9.1. Overview
- 11.2.9.2. Products
- 11.2.9.3. SWOT Analysis
- 11.2.9.4. Recent Developments
- 11.2.9.5. Financials (Based on Availability)
- 11.2.10 Fujitsu
- 11.2.10.1. Overview
- 11.2.10.2. Products
- 11.2.10.3. SWOT Analysis
- 11.2.10.4. Recent Developments
- 11.2.10.5. Financials (Based on Availability)
- 11.2.11 NEC
- 11.2.11.1. Overview
- 11.2.11.2. Products
- 11.2.11.3. SWOT Analysis
- 11.2.11.4. Recent Developments
- 11.2.11.5. Financials (Based on Availability)
- 11.2.12 WINTEC
- 11.2.12.1. Overview
- 11.2.12.2. Products
- 11.2.12.3. SWOT Analysis
- 11.2.12.4. Recent Developments
- 11.2.12.5. Financials (Based on Availability)
- 11.2.13 Panasonic
- 11.2.13.1. Overview
- 11.2.13.2. Products
- 11.2.13.3. SWOT Analysis
- 11.2.13.4. Recent Developments
- 11.2.13.5. Financials (Based on Availability)
- 11.2.14 Elo Touch
- 11.2.14.1. Overview
- 11.2.14.2. Products
- 11.2.14.3. SWOT Analysis
- 11.2.14.4. Recent Developments
- 11.2.14.5. Financials (Based on Availability)
- 11.2.15 Ejeton
- 11.2.15.1. Overview
- 11.2.15.2. Products
- 11.2.15.3. SWOT Analysis
- 11.2.15.4. Recent Developments
- 11.2.15.5. Financials (Based on Availability)
- 11.2.16 Zonerich
- 11.2.16.1. Overview
- 11.2.16.2. Products
- 11.2.16.3. SWOT Analysis
- 11.2.16.4. Recent Developments
- 11.2.16.5. Financials (Based on Availability)
- 11.2.17 Guangdong Chuantian
- 11.2.17.1. Overview
- 11.2.17.2. Products
- 11.2.17.3. SWOT Analysis
- 11.2.17.4. Recent Developments
- 11.2.17.5. Financials (Based on Availability)
- 11.2.18 Shenzhen Sangda
- 11.2.18.1. Overview
- 11.2.18.2. Products
- 11.2.18.3. SWOT Analysis
- 11.2.18.4. Recent Developments
- 11.2.18.5. Financials (Based on Availability)
- 11.2.19 Elite
- 11.2.19.1. Overview
- 11.2.19.2. Products
- 11.2.19.3. SWOT Analysis
- 11.2.19.4. Recent Developments
- 11.2.19.5. Financials (Based on Availability)
- 11.2.20 Shangchaoshidai
- 11.2.20.1. Overview
- 11.2.20.2. Products
- 11.2.20.3. SWOT Analysis
- 11.2.20.4. Recent Developments
- 11.2.20.5. Financials (Based on Availability)
- 11.2.21 Aibao
- 11.2.21.1. Overview
- 11.2.21.2. Products
- 11.2.21.3. SWOT Analysis
- 11.2.21.4. Recent Developments
- 11.2.21.5. Financials (Based on Availability)
- 11.2.22 Jepower Technology
- 11.2.22.1. Overview
- 11.2.22.2. Products
- 11.2.22.3. SWOT Analysis
- 11.2.22.4. Recent Developments
- 11.2.22.5. Financials (Based on Availability)
- 11.2.23 Boxing Technology
- 11.2.23.1. Overview
- 11.2.23.2. Products
- 11.2.23.3. SWOT Analysis
- 11.2.23.4. Recent Developments
- 11.2.23.5. Financials (Based on Availability)
- 11.2.1 Toshiba
List of Figures
- Figure 1: Global Smart Cash Registers Revenue Breakdown (million, %) by Region 2025 & 2033
- Figure 2: Global Smart Cash Registers Volume Breakdown (K, %) by Region 2025 & 2033
- Figure 3: North America Smart Cash Registers Revenue (million), by Application 2025 & 2033
- Figure 4: North America Smart Cash Registers Volume (K), by Application 2025 & 2033
- Figure 5: North America Smart Cash Registers Revenue Share (%), by Application 2025 & 2033
- Figure 6: North America Smart Cash Registers Volume Share (%), by Application 2025 & 2033
- Figure 7: North America Smart Cash Registers Revenue (million), by Types 2025 & 2033
- Figure 8: North America Smart Cash Registers Volume (K), by Types 2025 & 2033
- Figure 9: North America Smart Cash Registers Revenue Share (%), by Types 2025 & 2033
- Figure 10: North America Smart Cash Registers Volume Share (%), by Types 2025 & 2033
- Figure 11: North America Smart Cash Registers Revenue (million), by Country 2025 & 2033
- Figure 12: North America Smart Cash Registers Volume (K), by Country 2025 & 2033
- Figure 13: North America Smart Cash Registers Revenue Share (%), by Country 2025 & 2033
- Figure 14: North America Smart Cash Registers Volume Share (%), by Country 2025 & 2033
- Figure 15: South America Smart Cash Registers Revenue (million), by Application 2025 & 2033
- Figure 16: South America Smart Cash Registers Volume (K), by Application 2025 & 2033
- Figure 17: South America Smart Cash Registers Revenue Share (%), by Application 2025 & 2033
- Figure 18: South America Smart Cash Registers Volume Share (%), by Application 2025 & 2033
- Figure 19: South America Smart Cash Registers Revenue (million), by Types 2025 & 2033
- Figure 20: South America Smart Cash Registers Volume (K), by Types 2025 & 2033
- Figure 21: South America Smart Cash Registers Revenue Share (%), by Types 2025 & 2033
- Figure 22: South America Smart Cash Registers Volume Share (%), by Types 2025 & 2033
- Figure 23: South America Smart Cash Registers Revenue (million), by Country 2025 & 2033
- Figure 24: South America Smart Cash Registers Volume (K), by Country 2025 & 2033
- Figure 25: South America Smart Cash Registers Revenue Share (%), by Country 2025 & 2033
- Figure 26: South America Smart Cash Registers Volume Share (%), by Country 2025 & 2033
- Figure 27: Europe Smart Cash Registers Revenue (million), by Application 2025 & 2033
- Figure 28: Europe Smart Cash Registers Volume (K), by Application 2025 & 2033
- Figure 29: Europe Smart Cash Registers Revenue Share (%), by Application 2025 & 2033
- Figure 30: Europe Smart Cash Registers Volume Share (%), by Application 2025 & 2033
- Figure 31: Europe Smart Cash Registers Revenue (million), by Types 2025 & 2033
- Figure 32: Europe Smart Cash Registers Volume (K), by Types 2025 & 2033
- Figure 33: Europe Smart Cash Registers Revenue Share (%), by Types 2025 & 2033
- Figure 34: Europe Smart Cash Registers Volume Share (%), by Types 2025 & 2033
- Figure 35: Europe Smart Cash Registers Revenue (million), by Country 2025 & 2033
- Figure 36: Europe Smart Cash Registers Volume (K), by Country 2025 & 2033
- Figure 37: Europe Smart Cash Registers Revenue Share (%), by Country 2025 & 2033
- Figure 38: Europe Smart Cash Registers Volume Share (%), by Country 2025 & 2033
- Figure 39: Middle East & Africa Smart Cash Registers Revenue (million), by Application 2025 & 2033
- Figure 40: Middle East & Africa Smart Cash Registers Volume (K), by Application 2025 & 2033
- Figure 41: Middle East & Africa Smart Cash Registers Revenue Share (%), by Application 2025 & 2033
- Figure 42: Middle East & Africa Smart Cash Registers Volume Share (%), by Application 2025 & 2033
- Figure 43: Middle East & Africa Smart Cash Registers Revenue (million), by Types 2025 & 2033
- Figure 44: Middle East & Africa Smart Cash Registers Volume (K), by Types 2025 & 2033
- Figure 45: Middle East & Africa Smart Cash Registers Revenue Share (%), by Types 2025 & 2033
- Figure 46: Middle East & Africa Smart Cash Registers Volume Share (%), by Types 2025 & 2033
- Figure 47: Middle East & Africa Smart Cash Registers Revenue (million), by Country 2025 & 2033
- Figure 48: Middle East & Africa Smart Cash Registers Volume (K), by Country 2025 & 2033
- Figure 49: Middle East & Africa Smart Cash Registers Revenue Share (%), by Country 2025 & 2033
- Figure 50: Middle East & Africa Smart Cash Registers Volume Share (%), by Country 2025 & 2033
- Figure 51: Asia Pacific Smart Cash Registers Revenue (million), by Application 2025 & 2033
- Figure 52: Asia Pacific Smart Cash Registers Volume (K), by Application 2025 & 2033
- Figure 53: Asia Pacific Smart Cash Registers Revenue Share (%), by Application 2025 & 2033
- Figure 54: Asia Pacific Smart Cash Registers Volume Share (%), by Application 2025 & 2033
- Figure 55: Asia Pacific Smart Cash Registers Revenue (million), by Types 2025 & 2033
- Figure 56: Asia Pacific Smart Cash Registers Volume (K), by Types 2025 & 2033
- Figure 57: Asia Pacific Smart Cash Registers Revenue Share (%), by Types 2025 & 2033
- Figure 58: Asia Pacific Smart Cash Registers Volume Share (%), by Types 2025 & 2033
- Figure 59: Asia Pacific Smart Cash Registers Revenue (million), by Country 2025 & 2033
- Figure 60: Asia Pacific Smart Cash Registers Volume (K), by Country 2025 & 2033
- Figure 61: Asia Pacific Smart Cash Registers Revenue Share (%), by Country 2025 & 2033
- Figure 62: Asia Pacific Smart Cash Registers Volume Share (%), by Country 2025 & 2033
List of Tables
- Table 1: Global Smart Cash Registers Revenue million Forecast, by Application 2020 & 2033
- Table 2: Global Smart Cash Registers Volume K Forecast, by Application 2020 & 2033
- Table 3: Global Smart Cash Registers Revenue million Forecast, by Types 2020 & 2033
- Table 4: Global Smart Cash Registers Volume K Forecast, by Types 2020 & 2033
- Table 5: Global Smart Cash Registers Revenue million Forecast, by Region 2020 & 2033
- Table 6: Global Smart Cash Registers Volume K Forecast, by Region 2020 & 2033
- Table 7: Global Smart Cash Registers Revenue million Forecast, by Application 2020 & 2033
- Table 8: Global Smart Cash Registers Volume K Forecast, by Application 2020 & 2033
- Table 9: Global Smart Cash Registers Revenue million Forecast, by Types 2020 & 2033
- Table 10: Global Smart Cash Registers Volume K Forecast, by Types 2020 & 2033
- Table 11: Global Smart Cash Registers Revenue million Forecast, by Country 2020 & 2033
- Table 12: Global Smart Cash Registers Volume K Forecast, by Country 2020 & 2033
- Table 13: United States Smart Cash Registers Revenue (million) Forecast, by Application 2020 & 2033
- Table 14: United States Smart Cash Registers Volume (K) Forecast, by Application 2020 & 2033
- Table 15: Canada Smart Cash Registers Revenue (million) Forecast, by Application 2020 & 2033
- Table 16: Canada Smart Cash Registers Volume (K) Forecast, by Application 2020 & 2033
- Table 17: Mexico Smart Cash Registers Revenue (million) Forecast, by Application 2020 & 2033
- Table 18: Mexico Smart Cash Registers Volume (K) Forecast, by Application 2020 & 2033
- Table 19: Global Smart Cash Registers Revenue million Forecast, by Application 2020 & 2033
- Table 20: Global Smart Cash Registers Volume K Forecast, by Application 2020 & 2033
- Table 21: Global Smart Cash Registers Revenue million Forecast, by Types 2020 & 2033
- Table 22: Global Smart Cash Registers Volume K Forecast, by Types 2020 & 2033
- Table 23: Global Smart Cash Registers Revenue million Forecast, by Country 2020 & 2033
- Table 24: Global Smart Cash Registers Volume K Forecast, by Country 2020 & 2033
- Table 25: Brazil Smart Cash Registers Revenue (million) Forecast, by Application 2020 & 2033
- Table 26: Brazil Smart Cash Registers Volume (K) Forecast, by Application 2020 & 2033
- Table 27: Argentina Smart Cash Registers Revenue (million) Forecast, by Application 2020 & 2033
- Table 28: Argentina Smart Cash Registers Volume (K) Forecast, by Application 2020 & 2033
- Table 29: Rest of South America Smart Cash Registers Revenue (million) Forecast, by Application 2020 & 2033
- Table 30: Rest of South America Smart Cash Registers Volume (K) Forecast, by Application 2020 & 2033
- Table 31: Global Smart Cash Registers Revenue million Forecast, by Application 2020 & 2033
- Table 32: Global Smart Cash Registers Volume K Forecast, by Application 2020 & 2033
- Table 33: Global Smart Cash Registers Revenue million Forecast, by Types 2020 & 2033
- Table 34: Global Smart Cash Registers Volume K Forecast, by Types 2020 & 2033
- Table 35: Global Smart Cash Registers Revenue million Forecast, by Country 2020 & 2033
- Table 36: Global Smart Cash Registers Volume K Forecast, by Country 2020 & 2033
- Table 37: United Kingdom Smart Cash Registers Revenue (million) Forecast, by Application 2020 & 2033
- Table 38: United Kingdom Smart Cash Registers Volume (K) Forecast, by Application 2020 & 2033
- Table 39: Germany Smart Cash Registers Revenue (million) Forecast, by Application 2020 & 2033
- Table 40: Germany Smart Cash Registers Volume (K) Forecast, by Application 2020 & 2033
- Table 41: France Smart Cash Registers Revenue (million) Forecast, by Application 2020 & 2033
- Table 42: France Smart Cash Registers Volume (K) Forecast, by Application 2020 & 2033
- Table 43: Italy Smart Cash Registers Revenue (million) Forecast, by Application 2020 & 2033
- Table 44: Italy Smart Cash Registers Volume (K) Forecast, by Application 2020 & 2033
- Table 45: Spain Smart Cash Registers Revenue (million) Forecast, by Application 2020 & 2033
- Table 46: Spain Smart Cash Registers Volume (K) Forecast, by Application 2020 & 2033
- Table 47: Russia Smart Cash Registers Revenue (million) Forecast, by Application 2020 & 2033
- Table 48: Russia Smart Cash Registers Volume (K) Forecast, by Application 2020 & 2033
- Table 49: Benelux Smart Cash Registers Revenue (million) Forecast, by Application 2020 & 2033
- Table 50: Benelux Smart Cash Registers Volume (K) Forecast, by Application 2020 & 2033
- Table 51: Nordics Smart Cash Registers Revenue (million) Forecast, by Application 2020 & 2033
- Table 52: Nordics Smart Cash Registers Volume (K) Forecast, by Application 2020 & 2033
- Table 53: Rest of Europe Smart Cash Registers Revenue (million) Forecast, by Application 2020 & 2033
- Table 54: Rest of Europe Smart Cash Registers Volume (K) Forecast, by Application 2020 & 2033
- Table 55: Global Smart Cash Registers Revenue million Forecast, by Application 2020 & 2033
- Table 56: Global Smart Cash Registers Volume K Forecast, by Application 2020 & 2033
- Table 57: Global Smart Cash Registers Revenue million Forecast, by Types 2020 & 2033
- Table 58: Global Smart Cash Registers Volume K Forecast, by Types 2020 & 2033
- Table 59: Global Smart Cash Registers Revenue million Forecast, by Country 2020 & 2033
- Table 60: Global Smart Cash Registers Volume K Forecast, by Country 2020 & 2033
- Table 61: Turkey Smart Cash Registers Revenue (million) Forecast, by Application 2020 & 2033
- Table 62: Turkey Smart Cash Registers Volume (K) Forecast, by Application 2020 & 2033
- Table 63: Israel Smart Cash Registers Revenue (million) Forecast, by Application 2020 & 2033
- Table 64: Israel Smart Cash Registers Volume (K) Forecast, by Application 2020 & 2033
- Table 65: GCC Smart Cash Registers Revenue (million) Forecast, by Application 2020 & 2033
- Table 66: GCC Smart Cash Registers Volume (K) Forecast, by Application 2020 & 2033
- Table 67: North Africa Smart Cash Registers Revenue (million) Forecast, by Application 2020 & 2033
- Table 68: North Africa Smart Cash Registers Volume (K) Forecast, by Application 2020 & 2033
- Table 69: South Africa Smart Cash Registers Revenue (million) Forecast, by Application 2020 & 2033
- Table 70: South Africa Smart Cash Registers Volume (K) Forecast, by Application 2020 & 2033
- Table 71: Rest of Middle East & Africa Smart Cash Registers Revenue (million) Forecast, by Application 2020 & 2033
- Table 72: Rest of Middle East & Africa Smart Cash Registers Volume (K) Forecast, by Application 2020 & 2033
- Table 73: Global Smart Cash Registers Revenue million Forecast, by Application 2020 & 2033
- Table 74: Global Smart Cash Registers Volume K Forecast, by Application 2020 & 2033
- Table 75: Global Smart Cash Registers Revenue million Forecast, by Types 2020 & 2033
- Table 76: Global Smart Cash Registers Volume K Forecast, by Types 2020 & 2033
- Table 77: Global Smart Cash Registers Revenue million Forecast, by Country 2020 & 2033
- Table 78: Global Smart Cash Registers Volume K Forecast, by Country 2020 & 2033
- Table 79: China Smart Cash Registers Revenue (million) Forecast, by Application 2020 & 2033
- Table 80: China Smart Cash Registers Volume (K) Forecast, by Application 2020 & 2033
- Table 81: India Smart Cash Registers Revenue (million) Forecast, by Application 2020 & 2033
- Table 82: India Smart Cash Registers Volume (K) Forecast, by Application 2020 & 2033
- Table 83: Japan Smart Cash Registers Revenue (million) Forecast, by Application 2020 & 2033
- Table 84: Japan Smart Cash Registers Volume (K) Forecast, by Application 2020 & 2033
- Table 85: South Korea Smart Cash Registers Revenue (million) Forecast, by Application 2020 & 2033
- Table 86: South Korea Smart Cash Registers Volume (K) Forecast, by Application 2020 & 2033
- Table 87: ASEAN Smart Cash Registers Revenue (million) Forecast, by Application 2020 & 2033
- Table 88: ASEAN Smart Cash Registers Volume (K) Forecast, by Application 2020 & 2033
- Table 89: Oceania Smart Cash Registers Revenue (million) Forecast, by Application 2020 & 2033
- Table 90: Oceania Smart Cash Registers Volume (K) Forecast, by Application 2020 & 2033
- Table 91: Rest of Asia Pacific Smart Cash Registers Revenue (million) Forecast, by Application 2020 & 2033
- Table 92: Rest of Asia Pacific Smart Cash Registers Volume (K) Forecast, by Application 2020 & 2033
Frequently Asked Questions
1. What is the projected Compound Annual Growth Rate (CAGR) of the Smart Cash Registers?
The projected CAGR is approximately 1.5%.
2. Which companies are prominent players in the Smart Cash Registers?
Key companies in the market include Toshiba, NCR, Diebold Nixdorf, HP, Posiflex, FLYTECH, FEC, Hisense, Partner, Fujitsu, NEC, WINTEC, Panasonic, Elo Touch, Ejeton, Zonerich, Guangdong Chuantian, Shenzhen Sangda, Elite, Shangchaoshidai, Aibao, Jepower Technology, Boxing Technology.
3. What are the main segments of the Smart Cash Registers?
The market segments include Application, Types.
4. Can you provide details about the market size?
The market size is estimated to be USD 2561 million as of 2022.
5. What are some drivers contributing to market growth?
N/A
6. What are the notable trends driving market growth?
N/A
7. Are there any restraints impacting market growth?
N/A
8. Can you provide examples of recent developments in the market?
N/A
9. What pricing options are available for accessing the report?
Pricing options include single-user, multi-user, and enterprise licenses priced at USD 3350.00, USD 5025.00, and USD 6700.00 respectively.
10. Is the market size provided in terms of value or volume?
The market size is provided in terms of value, measured in million and volume, measured in K.
11. Are there any specific market keywords associated with the report?
Yes, the market keyword associated with the report is "Smart Cash Registers," which aids in identifying and referencing the specific market segment covered.
12. How do I determine which pricing option suits my needs best?
The pricing options vary based on user requirements and access needs. Individual users may opt for single-user licenses, while businesses requiring broader access may choose multi-user or enterprise licenses for cost-effective access to the report.
13. Are there any additional resources or data provided in the Smart Cash Registers report?
While the report offers comprehensive insights, it's advisable to review the specific contents or supplementary materials provided to ascertain if additional resources or data are available.
14. How can I stay updated on further developments or reports in the Smart Cash Registers?
To stay informed about further developments, trends, and reports in the Smart Cash Registers, consider subscribing to industry newsletters, following relevant companies and organizations, or regularly checking reputable industry news sources and publications.
Methodology
Step 1 - Identification of Relevant Samples Size from Population Database


Step 2 - Approaches for Defining Global Market Size (Value, Volume* & Price*)

Note*: In applicable scenarios
Step 3 - Data Sources
Primary Research
- Web Analytics
- Survey Reports
- Research Institute
- Latest Research Reports
- Opinion Leaders
Secondary Research
- Annual Reports
- White Paper
- Latest Press Release
- Industry Association
- Paid Database
- Investor Presentations

Step 4 - Data Triangulation
Involves using different sources of information in order to increase the validity of a study
These sources are likely to be stakeholders in a program - participants, other researchers, program staff, other community members, and so on.
Then we put all data in single framework & apply various statistical tools to find out the dynamic on the market.
During the analysis stage, feedback from the stakeholder groups would be compared to determine areas of agreement as well as areas of divergence