

Key Insights
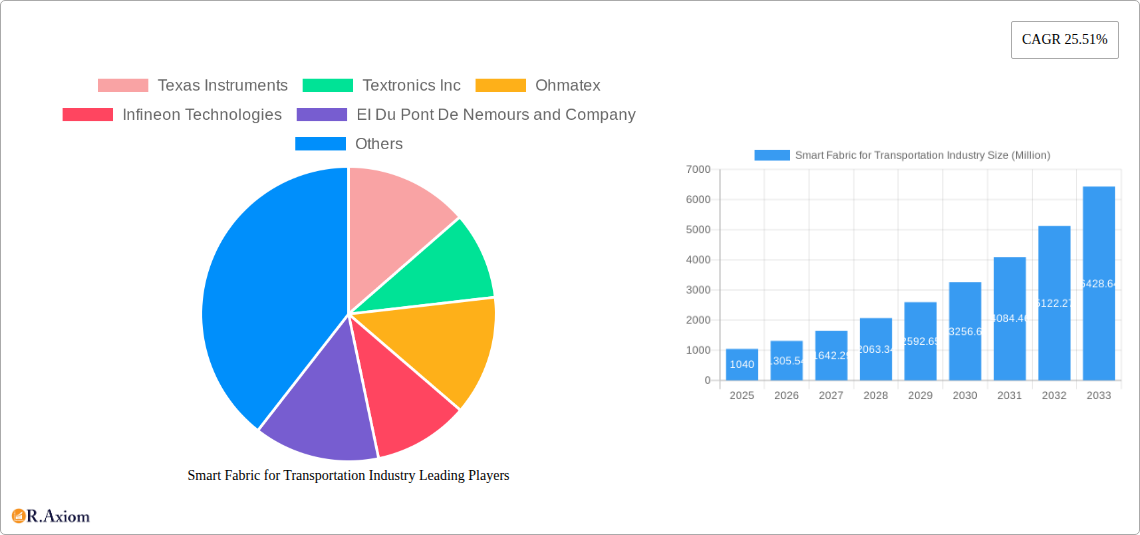
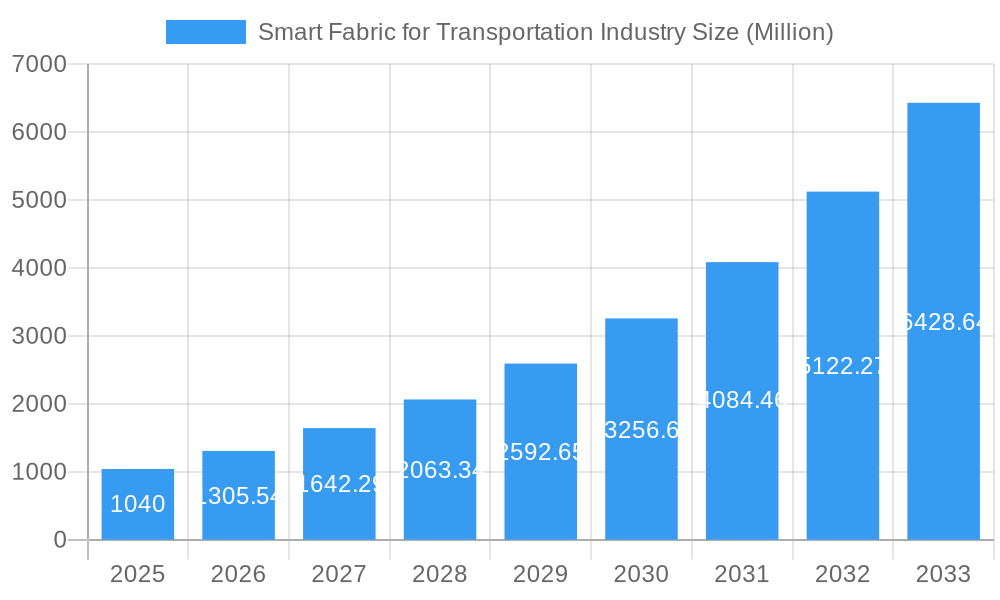
The smart fabric market for the transportation industry is experiencing robust growth, projected to reach $1.04 billion in 2025 and expand at a compound annual growth rate (CAGR) of 25.51% from 2025 to 2033. This surge is driven by several key factors. The increasing demand for enhanced safety features in vehicles, such as advanced airbags and seatbelt systems incorporating smart fabrics, is a major catalyst. Furthermore, the rising adoption of electric and autonomous vehicles necessitates innovative materials capable of withstanding varied environmental conditions and integrating seamlessly with sophisticated technological systems. The integration of smart fabrics allows for improved comfort and functionality, including heated seats, temperature-regulating materials, and even integrated passenger information systems. Growth is further fueled by advancements in materials science, leading to the development of color-changing, light-emitting, and shape-memory fabrics offering improved aesthetics and functionality. The automotive sector dominates the end-user industry, followed by shipping, railways, and aerospace, with each sector progressively incorporating these advanced materials for enhanced performance and safety.
Smart Fabric for Transportation Industry Market Size (In Billion)
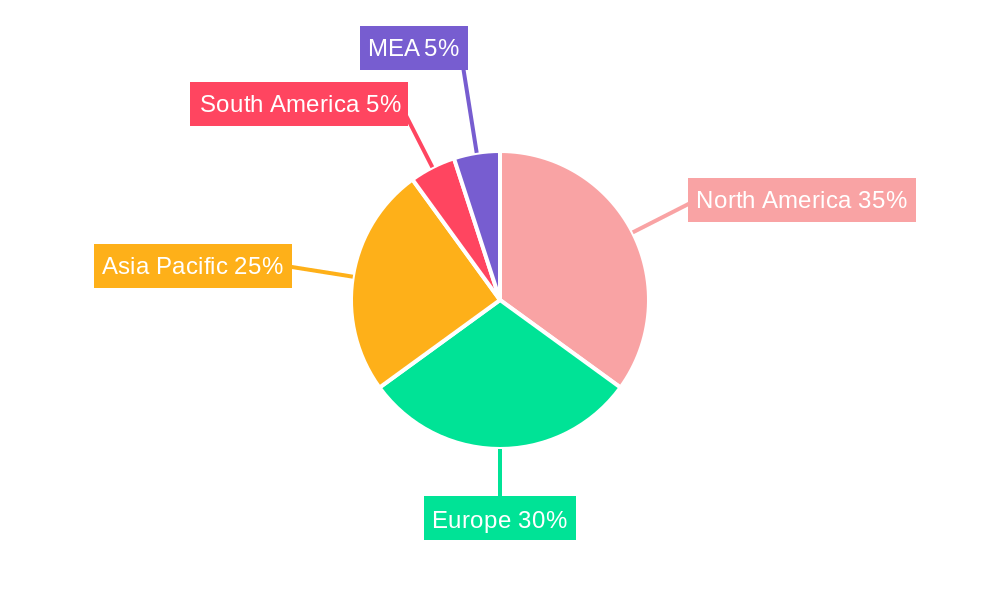
Significant regional variations exist in market penetration. North America and Europe currently hold substantial market share, driven by early adoption and well-established automotive industries. However, the Asia-Pacific region is expected to witness the most significant growth in the coming years, fueled by rapid industrialization, increasing vehicle production, and rising consumer demand for technologically advanced vehicles. While regulatory hurdles and high initial costs of smart fabric integration could pose some challenges, the overall market outlook remains overwhelmingly positive, with continuous innovation and increasing consumer awareness bolstering market expansion across all segments. Leading players like Texas Instruments, Kolon Glotech, and DuPont are actively shaping the market landscape through strategic partnerships, research and development initiatives, and expanding product portfolios.
Smart Fabric for Transportation Industry Company Market Share
Smart Fabric for Transportation Industry: A Comprehensive Market Report (2019-2033)
This comprehensive report provides an in-depth analysis of the Smart Fabric for Transportation Industry, projecting a market valued at $XX Million by 2033. The study covers the period from 2019 to 2033, with a focus on the forecast period from 2025 to 2033 and a base year of 2025. Key players like Texas Instruments, Textronics Inc, Ohmatex, Infineon Technologies, EI Du Pont De Nemours and Company, AIQ Smart Clothing Inc, Sensoria Inc, Kolon Glotech Inc, Schoeller Textil AG, and Interactive Wear AG are analyzed for their market share, innovations, and strategic moves. The report segments the market by component, material, application, and end-user industry, offering granular insights for informed decision-making.
Smart Fabric for Transportation Industry Market Concentration & Innovation
The Smart Fabric for Transportation Industry exhibits a moderately concentrated market structure, with a few major players holding significant market share. The market share distribution is dynamic, influenced by ongoing innovation, strategic partnerships, and mergers and acquisitions (M&A) activity. The total value of M&A deals in the industry from 2019-2024 is estimated at $XX Million. Innovation is a key driver, fueled by advancements in materials science, electronics miniaturization, and increasing demand for enhanced vehicle functionalities and sustainability.
- Market Concentration: The top five players account for approximately XX% of the global market share in 2024.
- Innovation Drivers: Advancements in conductive polymers, piezoelectric materials, and shape memory alloys are driving the development of more sophisticated and functional smart fabrics. The integration of sensors, actuators, and microelectronics within fabrics creates opportunities for advanced applications.
- Regulatory Frameworks: Regulations regarding safety, durability, and recyclability of automotive materials are shaping product development and influencing market growth. Stringent emission standards are further driving adoption of sustainable materials.
- Product Substitutes: Traditional textiles and non-smart materials pose competition, but the unique advantages of smart fabrics in terms of functionality and enhanced user experience are counterbalancing this.
- End-User Trends: The increasing demand for personalized and connected vehicles, coupled with heightened focus on vehicle safety and sustainability is significantly boosting market growth.
- M&A Activities: Consolidation through mergers and acquisitions is expected to continue, leading to larger players with expanded product portfolios and broader market reach.
Smart Fabric for Transportation Industry Industry Trends & Insights
The Smart Fabric for Transportation Industry is experiencing robust growth, driven by several key factors. The market is projected to achieve a Compound Annual Growth Rate (CAGR) of XX% during the forecast period (2025-2033). This growth is fueled by rising demand for enhanced safety features, increasing adoption of electric and autonomous vehicles, and the growing preference for personalized in-vehicle experiences. Technological advancements, such as the integration of advanced sensors and actuators into fabrics, are further propelling market expansion. Moreover, the growing emphasis on sustainable and eco-friendly materials is encouraging the development of recyclable and biodegradable smart fabrics. The market penetration of smart fabrics in various vehicle segments is steadily increasing, with a significant rise expected in the coming years, particularly in high-end vehicles and public transportation.
Dominant Markets & Segments in Smart Fabric for Transportation Industry
The automotive segment dominates the Smart Fabric for Transportation Industry, with automobiles accounting for the largest market share. Within the automotive sector, the demand for smart fabrics is particularly high for:
By Component: Automobile interior carpets are a significant segment due to their large surface area and potential for integration of features like heating, noise reduction, and sensing. Automotive airbags and seat belt webbings are also major applications, with a focus on improved safety and performance. Heated seats and nylon tire cord fabrics are also exhibiting strong growth.
By Material: Light-emitting materials, especially LEDs, are gaining traction due to their potential for creating dynamic lighting effects within the vehicle interior. Color-changing materials offer aesthetic appeal and the potential for personalized vehicle customization. Moving materials such as shape memory alloys are increasingly utilized in adaptive seating and other applications.
By Application: Safety and security applications are the largest segment within the automotive industry, followed by passenger information systems. Mobility management, vehicle management and passenger information systems are steadily expanding market segments.
By End-user Industry: Automobiles account for the largest market share, followed by the aerospace industry. Shipping and railways are emerging as important segments with growth potential.
Key Drivers:
- Economic policies: Government incentives for electric vehicle adoption and investment in infrastructure are driving market growth.
- Technological advancements: Continuous improvements in materials science, electronics, and sensor technologies are creating new opportunities.
- Infrastructure development: Expansion of transportation infrastructure and the rising adoption of smart city initiatives are positive growth factors.
The North American region currently holds the largest market share, driven by strong automotive production, technological advancements, and consumer preferences. However, the Asia-Pacific region is projected to experience the fastest growth rate, fueled by the rapid expansion of the automotive industry and increased consumer disposable income.
Smart Fabric for Transportation Industry Product Developments
Recent innovations focus on integrating advanced functionalities like haptic feedback, embedded sensors, and flexible displays into smart fabrics. This enhances user experience, improves safety features, and allows for more effective vehicle management. Companies are exploring the use of bio-based and recycled materials to address sustainability concerns, while also exploring new applications for smart fabrics in areas like noise reduction and thermal management. This focus on functionality, sustainability, and cost-effectiveness is key to winning market share.
Report Scope & Segmentation Analysis
This report provides a detailed segmentation of the Smart Fabric for Transportation Industry based on component (Automobile Interior Carpets, Automotive Airbags, Seat Belt Webbings, Heated Seats, Nylon Tire Cord Fabrics), material (Color Changing Material, Light Emitting Materials, Moving Materials, Temperature Changing Material), application (Mobility Management, Vehicle Management, Safety and Security, Passenger Information System), and end-user industry (Automobiles, Shipping, Railways, Aerospace). Each segment's growth projections, market size, and competitive dynamics are meticulously analyzed, offering a comprehensive overview of the market landscape. The report projects significant growth across all segments, with notable expansion in areas such as light-emitting materials and safety applications.
Key Drivers of Smart Fabric for Transportation Industry Growth
The growth of the smart fabric market in the transportation sector is primarily driven by technological advancements, leading to innovative and functional textiles for vehicles. Growing consumer preference for enhanced safety and comfort is also a key factor. Stringent government regulations on vehicle emissions and safety standards are further driving adoption of sustainable and high-performance smart fabrics. The rising demand for electric and autonomous vehicles presents new opportunities for integrating advanced features like haptic feedback and customizable lighting systems within vehicles.
Challenges in the Smart Fabric for Transportation Industry Sector
The high cost of manufacturing smart fabrics compared to conventional materials remains a major challenge, limiting widespread adoption. Supply chain disruptions and the availability of specialized materials can impact production schedules and increase costs. The integration of complex electronics and sensors into fabrics can also present technical challenges, requiring significant expertise in material science and electronics. Finally, stringent regulatory compliance requirements for automotive safety and durability standards can add to the overall cost and complexity of product development.
Emerging Opportunities in Smart Fabric for Transportation Industry
The integration of artificial intelligence (AI) and the Internet of Things (IoT) into smart fabrics presents significant opportunities for creating more intelligent and connected vehicles. The use of bio-based and recycled materials is growing, offering environmentally friendly alternatives. Expansion into new transportation segments, such as public transportation and commercial vehicles, offers significant growth potential. Furthermore, the development of innovative applications such as haptic feedback systems and personalized climate control within vehicles will continue to shape the market.
Leading Players in the Smart Fabric for Transportation Industry Market
- Texas Instruments
- Textronics Inc
- Ohmatex
- Infineon Technologies
- EI Du Pont De Nemours and Company
- AIQ Smart Clothing Inc
- Sensoria Inc
- Kolon Glotech Inc
- Schoeller Textil AG
- Interactive Wear AG
Key Developments in Smart Fabric for Transportation Industry Industry
- November 2022: Autoneum introduced a 100% recyclable polyester carpet, promoting sustainable vehicle manufacturing.
- March 2023: Apple patented a smart fabric lighting system for vehicle interiors, offering customizable illumination and interactive features.
Strategic Outlook for Smart Fabric for Transportation Industry Market
The Smart Fabric for Transportation Industry is poised for significant growth, driven by technological innovation and the increasing demand for advanced vehicle features. The market's future potential lies in the integration of AI, IoT, and sustainable materials, enabling the creation of more intelligent, connected, and environmentally friendly vehicles. Expansion into new applications and transportation segments will further fuel market expansion, leading to a robust and dynamic industry landscape in the coming years.
Smart Fabric for Transportation Industry Segmentation
-
1. Component
- 1.1. Automobile Interior Carpets
- 1.2. Automotive Airbags
- 1.3. Seat Belt Webbings
- 1.4. Heated Seats
- 1.5. Nylon Tire Cord Fabrics
-
2. Material
- 2.1. Color Ch
- 2.2. Light Em
- 2.3. Moving M
- 2.4. Temperat
-
3. Application
- 3.1. Mobility Management
- 3.2. Vehicle Management
- 3.3. Safety and Security
- 3.4. Passenger Information System
-
4. End-user Industry
- 4.1. Automobiles
- 4.2. Shipping
- 4.3. Railways
- 4.4. Aerospace
Smart Fabric for Transportation Industry Segmentation By Geography
- 1. North America
- 2. Europe
- 3. Asia
- 4. Latin America
- 5. Middle East and Africa
Smart Fabric for Transportation Industry Regional Market Share
Geographic Coverage of Smart Fabric for Transportation Industry
Smart Fabric for Transportation Industry REPORT HIGHLIGHTS
| Aspects | Details |
|---|---|
| Study Period | 2020-2034 |
| Base Year | 2025 |
| Estimated Year | 2026 |
| Forecast Period | 2026-2034 |
| Historical Period | 2020-2025 |
| Growth Rate | CAGR of 25.51% from 2020-2034 |
| Segmentation |
|
Table of Contents
- 1. Introduction
- 1.1. Research Scope
- 1.2. Market Segmentation
- 1.3. Research Objective
- 1.4. Definitions and Assumptions
- 2. Executive Summary
- 2.1. Market Snapshot
- 3. Market Dynamics
- 3.1. Market Drivers
- 3.2. Market Restrains
- 3.3. Market Trends
- 3.4. Market Opportunities
- 4. Market Factor Analysis
- 4.1. Porters Five Forces
- 4.1.1. Bargaining Power of Suppliers
- 4.1.2. Bargaining Power of Buyers
- 4.1.3. Threat of New Entrants
- 4.1.4. Threat of Substitutes
- 4.1.5. Competitive Rivalry
- 4.2. PESTEL analysis
- 4.3. BCG Analysis
- 4.3.1. Stars (High Growth, High Market Share)
- 4.3.2. Cash Cows (Low Growth, High Market Share)
- 4.3.3. Question Mark (High Growth, Low Market Share)
- 4.3.4. Dogs (Low Growth, Low Market Share)
- 4.4. Ansoff Matrix Analysis
- 4.5. Supply Chain Analysis
- 4.6. Regulatory Landscape
- 4.7. Current Market Potential and Opportunity Assessment (TAM–SAM–SOM Framework)
- 4.8. RAX Analyst Note
- 4.1. Porters Five Forces
- 5. Market Analysis, Insights and Forecast 2021-2033
- 5.1. Market Analysis, Insights and Forecast - by Component
- 5.1.1. Automobile Interior Carpets
- 5.1.2. Automotive Airbags
- 5.1.3. Seat Belt Webbings
- 5.1.4. Heated Seats
- 5.1.5. Nylon Tire Cord Fabrics
- 5.2. Market Analysis, Insights and Forecast - by Material
- 5.2.1. Color Ch
- 5.2.2. Light Em
- 5.2.3. Moving M
- 5.2.4. Temperat
- 5.3. Market Analysis, Insights and Forecast - by Application
- 5.3.1. Mobility Management
- 5.3.2. Vehicle Management
- 5.3.3. Safety and Security
- 5.3.4. Passenger Information System
- 5.4. Market Analysis, Insights and Forecast - by End-user Industry
- 5.4.1. Automobiles
- 5.4.2. Shipping
- 5.4.3. Railways
- 5.4.4. Aerospace
- 5.5. Market Analysis, Insights and Forecast - by Region
- 5.5.1. North America
- 5.5.2. Europe
- 5.5.3. Asia
- 5.5.4. Latin America
- 5.5.5. Middle East and Africa
- 5.1. Market Analysis, Insights and Forecast - by Component
- 6. Global Smart Fabric for Transportation Industry Analysis, Insights and Forecast, 2021-2033
- 6.1. Market Analysis, Insights and Forecast - by Component
- 6.1.1. Automobile Interior Carpets
- 6.1.2. Automotive Airbags
- 6.1.3. Seat Belt Webbings
- 6.1.4. Heated Seats
- 6.1.5. Nylon Tire Cord Fabrics
- 6.2. Market Analysis, Insights and Forecast - by Material
- 6.2.1. Color Ch
- 6.2.2. Light Em
- 6.2.3. Moving M
- 6.2.4. Temperat
- 6.3. Market Analysis, Insights and Forecast - by Application
- 6.3.1. Mobility Management
- 6.3.2. Vehicle Management
- 6.3.3. Safety and Security
- 6.3.4. Passenger Information System
- 6.4. Market Analysis, Insights and Forecast - by End-user Industry
- 6.4.1. Automobiles
- 6.4.2. Shipping
- 6.4.3. Railways
- 6.4.4. Aerospace
- 6.1. Market Analysis, Insights and Forecast - by Component
- 7. North America Smart Fabric for Transportation Industry Analysis, Insights and Forecast, 2020-2032
- 7.1. Market Analysis, Insights and Forecast - by Component
- 7.1.1. Automobile Interior Carpets
- 7.1.2. Automotive Airbags
- 7.1.3. Seat Belt Webbings
- 7.1.4. Heated Seats
- 7.1.5. Nylon Tire Cord Fabrics
- 7.2. Market Analysis, Insights and Forecast - by Material
- 7.2.1. Color Ch
- 7.2.2. Light Em
- 7.2.3. Moving M
- 7.2.4. Temperat
- 7.3. Market Analysis, Insights and Forecast - by Application
- 7.3.1. Mobility Management
- 7.3.2. Vehicle Management
- 7.3.3. Safety and Security
- 7.3.4. Passenger Information System
- 7.4. Market Analysis, Insights and Forecast - by End-user Industry
- 7.4.1. Automobiles
- 7.4.2. Shipping
- 7.4.3. Railways
- 7.4.4. Aerospace
- 7.1. Market Analysis, Insights and Forecast - by Component
- 8. Europe Smart Fabric for Transportation Industry Analysis, Insights and Forecast, 2020-2032
- 8.1. Market Analysis, Insights and Forecast - by Component
- 8.1.1. Automobile Interior Carpets
- 8.1.2. Automotive Airbags
- 8.1.3. Seat Belt Webbings
- 8.1.4. Heated Seats
- 8.1.5. Nylon Tire Cord Fabrics
- 8.2. Market Analysis, Insights and Forecast - by Material
- 8.2.1. Color Ch
- 8.2.2. Light Em
- 8.2.3. Moving M
- 8.2.4. Temperat
- 8.3. Market Analysis, Insights and Forecast - by Application
- 8.3.1. Mobility Management
- 8.3.2. Vehicle Management
- 8.3.3. Safety and Security
- 8.3.4. Passenger Information System
- 8.4. Market Analysis, Insights and Forecast - by End-user Industry
- 8.4.1. Automobiles
- 8.4.2. Shipping
- 8.4.3. Railways
- 8.4.4. Aerospace
- 8.1. Market Analysis, Insights and Forecast - by Component
- 9. Asia Smart Fabric for Transportation Industry Analysis, Insights and Forecast, 2020-2032
- 9.1. Market Analysis, Insights and Forecast - by Component
- 9.1.1. Automobile Interior Carpets
- 9.1.2. Automotive Airbags
- 9.1.3. Seat Belt Webbings
- 9.1.4. Heated Seats
- 9.1.5. Nylon Tire Cord Fabrics
- 9.2. Market Analysis, Insights and Forecast - by Material
- 9.2.1. Color Ch
- 9.2.2. Light Em
- 9.2.3. Moving M
- 9.2.4. Temperat
- 9.3. Market Analysis, Insights and Forecast - by Application
- 9.3.1. Mobility Management
- 9.3.2. Vehicle Management
- 9.3.3. Safety and Security
- 9.3.4. Passenger Information System
- 9.4. Market Analysis, Insights and Forecast - by End-user Industry
- 9.4.1. Automobiles
- 9.4.2. Shipping
- 9.4.3. Railways
- 9.4.4. Aerospace
- 9.1. Market Analysis, Insights and Forecast - by Component
- 10. Latin America Smart Fabric for Transportation Industry Analysis, Insights and Forecast, 2020-2032
- 10.1. Market Analysis, Insights and Forecast - by Component
- 10.1.1. Automobile Interior Carpets
- 10.1.2. Automotive Airbags
- 10.1.3. Seat Belt Webbings
- 10.1.4. Heated Seats
- 10.1.5. Nylon Tire Cord Fabrics
- 10.2. Market Analysis, Insights and Forecast - by Material
- 10.2.1. Color Ch
- 10.2.2. Light Em
- 10.2.3. Moving M
- 10.2.4. Temperat
- 10.3. Market Analysis, Insights and Forecast - by Application
- 10.3.1. Mobility Management
- 10.3.2. Vehicle Management
- 10.3.3. Safety and Security
- 10.3.4. Passenger Information System
- 10.4. Market Analysis, Insights and Forecast - by End-user Industry
- 10.4.1. Automobiles
- 10.4.2. Shipping
- 10.4.3. Railways
- 10.4.4. Aerospace
- 10.1. Market Analysis, Insights and Forecast - by Component
- 11. Middle East and Africa Smart Fabric for Transportation Industry Analysis, Insights and Forecast, 2020-2032
- 11.1. Market Analysis, Insights and Forecast - by Component
- 11.1.1. Automobile Interior Carpets
- 11.1.2. Automotive Airbags
- 11.1.3. Seat Belt Webbings
- 11.1.4. Heated Seats
- 11.1.5. Nylon Tire Cord Fabrics
- 11.2. Market Analysis, Insights and Forecast - by Material
- 11.2.1. Color Ch
- 11.2.2. Light Em
- 11.2.3. Moving M
- 11.2.4. Temperat
- 11.3. Market Analysis, Insights and Forecast - by Application
- 11.3.1. Mobility Management
- 11.3.2. Vehicle Management
- 11.3.3. Safety and Security
- 11.3.4. Passenger Information System
- 11.4. Market Analysis, Insights and Forecast - by End-user Industry
- 11.4.1. Automobiles
- 11.4.2. Shipping
- 11.4.3. Railways
- 11.4.4. Aerospace
- 11.1. Market Analysis, Insights and Forecast - by Component
- 12. Competitive Analysis
- 12.1. Company Profiles
- 12.1.1 Texas Instruments
- 12.1.1.1. Company Overview
- 12.1.1.2. Products
- 12.1.1.3. Company Financials
- 12.1.1.4. SWOT Analysis
- 12.1.2 Textronics Inc
- 12.1.2.1. Company Overview
- 12.1.2.2. Products
- 12.1.2.3. Company Financials
- 12.1.2.4. SWOT Analysis
- 12.1.3 Ohmatex
- 12.1.3.1. Company Overview
- 12.1.3.2. Products
- 12.1.3.3. Company Financials
- 12.1.3.4. SWOT Analysis
- 12.1.4 Infineon Technologies
- 12.1.4.1. Company Overview
- 12.1.4.2. Products
- 12.1.4.3. Company Financials
- 12.1.4.4. SWOT Analysis
- 12.1.5 EI Du Pont De Nemours and Company
- 12.1.5.1. Company Overview
- 12.1.5.2. Products
- 12.1.5.3. Company Financials
- 12.1.5.4. SWOT Analysis
- 12.1.6 AIQ Smart Clothing Inc
- 12.1.6.1. Company Overview
- 12.1.6.2. Products
- 12.1.6.3. Company Financials
- 12.1.6.4. SWOT Analysis
- 12.1.7 Sensoria Inc
- 12.1.7.1. Company Overview
- 12.1.7.2. Products
- 12.1.7.3. Company Financials
- 12.1.7.4. SWOT Analysis
- 12.1.8 Kolon Glotech Inc
- 12.1.8.1. Company Overview
- 12.1.8.2. Products
- 12.1.8.3. Company Financials
- 12.1.8.4. SWOT Analysis
- 12.1.9 Schoeller Textil AG
- 12.1.9.1. Company Overview
- 12.1.9.2. Products
- 12.1.9.3. Company Financials
- 12.1.9.4. SWOT Analysis
- 12.1.10 Interactive Wear AG
- 12.1.10.1. Company Overview
- 12.1.10.2. Products
- 12.1.10.3. Company Financials
- 12.1.10.4. SWOT Analysis
- 12.1.1 Texas Instruments
- 12.2. Market Entropy
- 12.2.1 Company's Key Areas Served
- 12.2.2 Recent Developments
- 12.3. Company Market Share Analysis 2025
- 12.3.1 Top 5 Companies Market Share Analysis
- 12.3.2 Top 3 Companies Market Share Analysis
- 12.4. List of Potential Customers
- 13. Research Methodology
List of Figures
- Figure 1: Global Smart Fabric for Transportation Industry Revenue Breakdown (Million, %) by Region 2025 & 2033
- Figure 2: Global Smart Fabric for Transportation Industry Volume Breakdown (K Unit, %) by Region 2025 & 2033
- Figure 3: North America Smart Fabric for Transportation Industry Revenue (Million), by Component 2025 & 2033
- Figure 4: North America Smart Fabric for Transportation Industry Volume (K Unit), by Component 2025 & 2033
- Figure 5: North America Smart Fabric for Transportation Industry Revenue Share (%), by Component 2025 & 2033
- Figure 6: North America Smart Fabric for Transportation Industry Volume Share (%), by Component 2025 & 2033
- Figure 7: North America Smart Fabric for Transportation Industry Revenue (Million), by Material 2025 & 2033
- Figure 8: North America Smart Fabric for Transportation Industry Volume (K Unit), by Material 2025 & 2033
- Figure 9: North America Smart Fabric for Transportation Industry Revenue Share (%), by Material 2025 & 2033
- Figure 10: North America Smart Fabric for Transportation Industry Volume Share (%), by Material 2025 & 2033
- Figure 11: North America Smart Fabric for Transportation Industry Revenue (Million), by Application 2025 & 2033
- Figure 12: North America Smart Fabric for Transportation Industry Volume (K Unit), by Application 2025 & 2033
- Figure 13: North America Smart Fabric for Transportation Industry Revenue Share (%), by Application 2025 & 2033
- Figure 14: North America Smart Fabric for Transportation Industry Volume Share (%), by Application 2025 & 2033
- Figure 15: North America Smart Fabric for Transportation Industry Revenue (Million), by End-user Industry 2025 & 2033
- Figure 16: North America Smart Fabric for Transportation Industry Volume (K Unit), by End-user Industry 2025 & 2033
- Figure 17: North America Smart Fabric for Transportation Industry Revenue Share (%), by End-user Industry 2025 & 2033
- Figure 18: North America Smart Fabric for Transportation Industry Volume Share (%), by End-user Industry 2025 & 2033
- Figure 19: North America Smart Fabric for Transportation Industry Revenue (Million), by Country 2025 & 2033
- Figure 20: North America Smart Fabric for Transportation Industry Volume (K Unit), by Country 2025 & 2033
- Figure 21: North America Smart Fabric for Transportation Industry Revenue Share (%), by Country 2025 & 2033
- Figure 22: North America Smart Fabric for Transportation Industry Volume Share (%), by Country 2025 & 2033
- Figure 23: Europe Smart Fabric for Transportation Industry Revenue (Million), by Component 2025 & 2033
- Figure 24: Europe Smart Fabric for Transportation Industry Volume (K Unit), by Component 2025 & 2033
- Figure 25: Europe Smart Fabric for Transportation Industry Revenue Share (%), by Component 2025 & 2033
- Figure 26: Europe Smart Fabric for Transportation Industry Volume Share (%), by Component 2025 & 2033
- Figure 27: Europe Smart Fabric for Transportation Industry Revenue (Million), by Material 2025 & 2033
- Figure 28: Europe Smart Fabric for Transportation Industry Volume (K Unit), by Material 2025 & 2033
- Figure 29: Europe Smart Fabric for Transportation Industry Revenue Share (%), by Material 2025 & 2033
- Figure 30: Europe Smart Fabric for Transportation Industry Volume Share (%), by Material 2025 & 2033
- Figure 31: Europe Smart Fabric for Transportation Industry Revenue (Million), by Application 2025 & 2033
- Figure 32: Europe Smart Fabric for Transportation Industry Volume (K Unit), by Application 2025 & 2033
- Figure 33: Europe Smart Fabric for Transportation Industry Revenue Share (%), by Application 2025 & 2033
- Figure 34: Europe Smart Fabric for Transportation Industry Volume Share (%), by Application 2025 & 2033
- Figure 35: Europe Smart Fabric for Transportation Industry Revenue (Million), by End-user Industry 2025 & 2033
- Figure 36: Europe Smart Fabric for Transportation Industry Volume (K Unit), by End-user Industry 2025 & 2033
- Figure 37: Europe Smart Fabric for Transportation Industry Revenue Share (%), by End-user Industry 2025 & 2033
- Figure 38: Europe Smart Fabric for Transportation Industry Volume Share (%), by End-user Industry 2025 & 2033
- Figure 39: Europe Smart Fabric for Transportation Industry Revenue (Million), by Country 2025 & 2033
- Figure 40: Europe Smart Fabric for Transportation Industry Volume (K Unit), by Country 2025 & 2033
- Figure 41: Europe Smart Fabric for Transportation Industry Revenue Share (%), by Country 2025 & 2033
- Figure 42: Europe Smart Fabric for Transportation Industry Volume Share (%), by Country 2025 & 2033
- Figure 43: Asia Smart Fabric for Transportation Industry Revenue (Million), by Component 2025 & 2033
- Figure 44: Asia Smart Fabric for Transportation Industry Volume (K Unit), by Component 2025 & 2033
- Figure 45: Asia Smart Fabric for Transportation Industry Revenue Share (%), by Component 2025 & 2033
- Figure 46: Asia Smart Fabric for Transportation Industry Volume Share (%), by Component 2025 & 2033
- Figure 47: Asia Smart Fabric for Transportation Industry Revenue (Million), by Material 2025 & 2033
- Figure 48: Asia Smart Fabric for Transportation Industry Volume (K Unit), by Material 2025 & 2033
- Figure 49: Asia Smart Fabric for Transportation Industry Revenue Share (%), by Material 2025 & 2033
- Figure 50: Asia Smart Fabric for Transportation Industry Volume Share (%), by Material 2025 & 2033
- Figure 51: Asia Smart Fabric for Transportation Industry Revenue (Million), by Application 2025 & 2033
- Figure 52: Asia Smart Fabric for Transportation Industry Volume (K Unit), by Application 2025 & 2033
- Figure 53: Asia Smart Fabric for Transportation Industry Revenue Share (%), by Application 2025 & 2033
- Figure 54: Asia Smart Fabric for Transportation Industry Volume Share (%), by Application 2025 & 2033
- Figure 55: Asia Smart Fabric for Transportation Industry Revenue (Million), by End-user Industry 2025 & 2033
- Figure 56: Asia Smart Fabric for Transportation Industry Volume (K Unit), by End-user Industry 2025 & 2033
- Figure 57: Asia Smart Fabric for Transportation Industry Revenue Share (%), by End-user Industry 2025 & 2033
- Figure 58: Asia Smart Fabric for Transportation Industry Volume Share (%), by End-user Industry 2025 & 2033
- Figure 59: Asia Smart Fabric for Transportation Industry Revenue (Million), by Country 2025 & 2033
- Figure 60: Asia Smart Fabric for Transportation Industry Volume (K Unit), by Country 2025 & 2033
- Figure 61: Asia Smart Fabric for Transportation Industry Revenue Share (%), by Country 2025 & 2033
- Figure 62: Asia Smart Fabric for Transportation Industry Volume Share (%), by Country 2025 & 2033
- Figure 63: Latin America Smart Fabric for Transportation Industry Revenue (Million), by Component 2025 & 2033
- Figure 64: Latin America Smart Fabric for Transportation Industry Volume (K Unit), by Component 2025 & 2033
- Figure 65: Latin America Smart Fabric for Transportation Industry Revenue Share (%), by Component 2025 & 2033
- Figure 66: Latin America Smart Fabric for Transportation Industry Volume Share (%), by Component 2025 & 2033
- Figure 67: Latin America Smart Fabric for Transportation Industry Revenue (Million), by Material 2025 & 2033
- Figure 68: Latin America Smart Fabric for Transportation Industry Volume (K Unit), by Material 2025 & 2033
- Figure 69: Latin America Smart Fabric for Transportation Industry Revenue Share (%), by Material 2025 & 2033
- Figure 70: Latin America Smart Fabric for Transportation Industry Volume Share (%), by Material 2025 & 2033
- Figure 71: Latin America Smart Fabric for Transportation Industry Revenue (Million), by Application 2025 & 2033
- Figure 72: Latin America Smart Fabric for Transportation Industry Volume (K Unit), by Application 2025 & 2033
- Figure 73: Latin America Smart Fabric for Transportation Industry Revenue Share (%), by Application 2025 & 2033
- Figure 74: Latin America Smart Fabric for Transportation Industry Volume Share (%), by Application 2025 & 2033
- Figure 75: Latin America Smart Fabric for Transportation Industry Revenue (Million), by End-user Industry 2025 & 2033
- Figure 76: Latin America Smart Fabric for Transportation Industry Volume (K Unit), by End-user Industry 2025 & 2033
- Figure 77: Latin America Smart Fabric for Transportation Industry Revenue Share (%), by End-user Industry 2025 & 2033
- Figure 78: Latin America Smart Fabric for Transportation Industry Volume Share (%), by End-user Industry 2025 & 2033
- Figure 79: Latin America Smart Fabric for Transportation Industry Revenue (Million), by Country 2025 & 2033
- Figure 80: Latin America Smart Fabric for Transportation Industry Volume (K Unit), by Country 2025 & 2033
- Figure 81: Latin America Smart Fabric for Transportation Industry Revenue Share (%), by Country 2025 & 2033
- Figure 82: Latin America Smart Fabric for Transportation Industry Volume Share (%), by Country 2025 & 2033
- Figure 83: Middle East and Africa Smart Fabric for Transportation Industry Revenue (Million), by Component 2025 & 2033
- Figure 84: Middle East and Africa Smart Fabric for Transportation Industry Volume (K Unit), by Component 2025 & 2033
- Figure 85: Middle East and Africa Smart Fabric for Transportation Industry Revenue Share (%), by Component 2025 & 2033
- Figure 86: Middle East and Africa Smart Fabric for Transportation Industry Volume Share (%), by Component 2025 & 2033
- Figure 87: Middle East and Africa Smart Fabric for Transportation Industry Revenue (Million), by Material 2025 & 2033
- Figure 88: Middle East and Africa Smart Fabric for Transportation Industry Volume (K Unit), by Material 2025 & 2033
- Figure 89: Middle East and Africa Smart Fabric for Transportation Industry Revenue Share (%), by Material 2025 & 2033
- Figure 90: Middle East and Africa Smart Fabric for Transportation Industry Volume Share (%), by Material 2025 & 2033
- Figure 91: Middle East and Africa Smart Fabric for Transportation Industry Revenue (Million), by Application 2025 & 2033
- Figure 92: Middle East and Africa Smart Fabric for Transportation Industry Volume (K Unit), by Application 2025 & 2033
- Figure 93: Middle East and Africa Smart Fabric for Transportation Industry Revenue Share (%), by Application 2025 & 2033
- Figure 94: Middle East and Africa Smart Fabric for Transportation Industry Volume Share (%), by Application 2025 & 2033
- Figure 95: Middle East and Africa Smart Fabric for Transportation Industry Revenue (Million), by End-user Industry 2025 & 2033
- Figure 96: Middle East and Africa Smart Fabric for Transportation Industry Volume (K Unit), by End-user Industry 2025 & 2033
- Figure 97: Middle East and Africa Smart Fabric for Transportation Industry Revenue Share (%), by End-user Industry 2025 & 2033
- Figure 98: Middle East and Africa Smart Fabric for Transportation Industry Volume Share (%), by End-user Industry 2025 & 2033
- Figure 99: Middle East and Africa Smart Fabric for Transportation Industry Revenue (Million), by Country 2025 & 2033
- Figure 100: Middle East and Africa Smart Fabric for Transportation Industry Volume (K Unit), by Country 2025 & 2033
- Figure 101: Middle East and Africa Smart Fabric for Transportation Industry Revenue Share (%), by Country 2025 & 2033
- Figure 102: Middle East and Africa Smart Fabric for Transportation Industry Volume Share (%), by Country 2025 & 2033
List of Tables
- Table 1: Global Smart Fabric for Transportation Industry Revenue Million Forecast, by Component 2020 & 2033
- Table 2: Global Smart Fabric for Transportation Industry Volume K Unit Forecast, by Component 2020 & 2033
- Table 3: Global Smart Fabric for Transportation Industry Revenue Million Forecast, by Material 2020 & 2033
- Table 4: Global Smart Fabric for Transportation Industry Volume K Unit Forecast, by Material 2020 & 2033
- Table 5: Global Smart Fabric for Transportation Industry Revenue Million Forecast, by Application 2020 & 2033
- Table 6: Global Smart Fabric for Transportation Industry Volume K Unit Forecast, by Application 2020 & 2033
- Table 7: Global Smart Fabric for Transportation Industry Revenue Million Forecast, by End-user Industry 2020 & 2033
- Table 8: Global Smart Fabric for Transportation Industry Volume K Unit Forecast, by End-user Industry 2020 & 2033
- Table 9: Global Smart Fabric for Transportation Industry Revenue Million Forecast, by Region 2020 & 2033
- Table 10: Global Smart Fabric for Transportation Industry Volume K Unit Forecast, by Region 2020 & 2033
- Table 11: Global Smart Fabric for Transportation Industry Revenue Million Forecast, by Component 2020 & 2033
- Table 12: Global Smart Fabric for Transportation Industry Volume K Unit Forecast, by Component 2020 & 2033
- Table 13: Global Smart Fabric for Transportation Industry Revenue Million Forecast, by Material 2020 & 2033
- Table 14: Global Smart Fabric for Transportation Industry Volume K Unit Forecast, by Material 2020 & 2033
- Table 15: Global Smart Fabric for Transportation Industry Revenue Million Forecast, by Application 2020 & 2033
- Table 16: Global Smart Fabric for Transportation Industry Volume K Unit Forecast, by Application 2020 & 2033
- Table 17: Global Smart Fabric for Transportation Industry Revenue Million Forecast, by End-user Industry 2020 & 2033
- Table 18: Global Smart Fabric for Transportation Industry Volume K Unit Forecast, by End-user Industry 2020 & 2033
- Table 19: Global Smart Fabric for Transportation Industry Revenue Million Forecast, by Country 2020 & 2033
- Table 20: Global Smart Fabric for Transportation Industry Volume K Unit Forecast, by Country 2020 & 2033
- Table 21: Global Smart Fabric for Transportation Industry Revenue Million Forecast, by Component 2020 & 2033
- Table 22: Global Smart Fabric for Transportation Industry Volume K Unit Forecast, by Component 2020 & 2033
- Table 23: Global Smart Fabric for Transportation Industry Revenue Million Forecast, by Material 2020 & 2033
- Table 24: Global Smart Fabric for Transportation Industry Volume K Unit Forecast, by Material 2020 & 2033
- Table 25: Global Smart Fabric for Transportation Industry Revenue Million Forecast, by Application 2020 & 2033
- Table 26: Global Smart Fabric for Transportation Industry Volume K Unit Forecast, by Application 2020 & 2033
- Table 27: Global Smart Fabric for Transportation Industry Revenue Million Forecast, by End-user Industry 2020 & 2033
- Table 28: Global Smart Fabric for Transportation Industry Volume K Unit Forecast, by End-user Industry 2020 & 2033
- Table 29: Global Smart Fabric for Transportation Industry Revenue Million Forecast, by Country 2020 & 2033
- Table 30: Global Smart Fabric for Transportation Industry Volume K Unit Forecast, by Country 2020 & 2033
- Table 31: Global Smart Fabric for Transportation Industry Revenue Million Forecast, by Component 2020 & 2033
- Table 32: Global Smart Fabric for Transportation Industry Volume K Unit Forecast, by Component 2020 & 2033
- Table 33: Global Smart Fabric for Transportation Industry Revenue Million Forecast, by Material 2020 & 2033
- Table 34: Global Smart Fabric for Transportation Industry Volume K Unit Forecast, by Material 2020 & 2033
- Table 35: Global Smart Fabric for Transportation Industry Revenue Million Forecast, by Application 2020 & 2033
- Table 36: Global Smart Fabric for Transportation Industry Volume K Unit Forecast, by Application 2020 & 2033
- Table 37: Global Smart Fabric for Transportation Industry Revenue Million Forecast, by End-user Industry 2020 & 2033
- Table 38: Global Smart Fabric for Transportation Industry Volume K Unit Forecast, by End-user Industry 2020 & 2033
- Table 39: Global Smart Fabric for Transportation Industry Revenue Million Forecast, by Country 2020 & 2033
- Table 40: Global Smart Fabric for Transportation Industry Volume K Unit Forecast, by Country 2020 & 2033
- Table 41: Global Smart Fabric for Transportation Industry Revenue Million Forecast, by Component 2020 & 2033
- Table 42: Global Smart Fabric for Transportation Industry Volume K Unit Forecast, by Component 2020 & 2033
- Table 43: Global Smart Fabric for Transportation Industry Revenue Million Forecast, by Material 2020 & 2033
- Table 44: Global Smart Fabric for Transportation Industry Volume K Unit Forecast, by Material 2020 & 2033
- Table 45: Global Smart Fabric for Transportation Industry Revenue Million Forecast, by Application 2020 & 2033
- Table 46: Global Smart Fabric for Transportation Industry Volume K Unit Forecast, by Application 2020 & 2033
- Table 47: Global Smart Fabric for Transportation Industry Revenue Million Forecast, by End-user Industry 2020 & 2033
- Table 48: Global Smart Fabric for Transportation Industry Volume K Unit Forecast, by End-user Industry 2020 & 2033
- Table 49: Global Smart Fabric for Transportation Industry Revenue Million Forecast, by Country 2020 & 2033
- Table 50: Global Smart Fabric for Transportation Industry Volume K Unit Forecast, by Country 2020 & 2033
- Table 51: Global Smart Fabric for Transportation Industry Revenue Million Forecast, by Component 2020 & 2033
- Table 52: Global Smart Fabric for Transportation Industry Volume K Unit Forecast, by Component 2020 & 2033
- Table 53: Global Smart Fabric for Transportation Industry Revenue Million Forecast, by Material 2020 & 2033
- Table 54: Global Smart Fabric for Transportation Industry Volume K Unit Forecast, by Material 2020 & 2033
- Table 55: Global Smart Fabric for Transportation Industry Revenue Million Forecast, by Application 2020 & 2033
- Table 56: Global Smart Fabric for Transportation Industry Volume K Unit Forecast, by Application 2020 & 2033
- Table 57: Global Smart Fabric for Transportation Industry Revenue Million Forecast, by End-user Industry 2020 & 2033
- Table 58: Global Smart Fabric for Transportation Industry Volume K Unit Forecast, by End-user Industry 2020 & 2033
- Table 59: Global Smart Fabric for Transportation Industry Revenue Million Forecast, by Country 2020 & 2033
- Table 60: Global Smart Fabric for Transportation Industry Volume K Unit Forecast, by Country 2020 & 2033
Frequently Asked Questions
1. What is the projected Compound Annual Growth Rate (CAGR) of the Smart Fabric for Transportation Industry?
The projected CAGR is approximately 25.51%.
2. Which companies are prominent players in the Smart Fabric for Transportation Industry?
Key companies in the market include Texas Instruments, Textronics Inc, Ohmatex, Infineon Technologies, EI Du Pont De Nemours and Company, AIQ Smart Clothing Inc, Sensoria Inc, Kolon Glotech Inc, Schoeller Textil AG, Interactive Wear AG.
3. What are the main segments of the Smart Fabric for Transportation Industry?
The market segments include Component, Material, Application, End-user Industry.
4. Can you provide details about the market size?
The market size is estimated to be USD 1.04 Million as of 2022.
5. What are some drivers contributing to market growth?
Increasing Number of Connected Cars and Heavy Vehicles; Miniaturization of Electronic Components; Increasing Safety and Security Concerns in Transportation.
6. What are the notable trends driving market growth?
Mobility Management to Witness Significantly High Growth Rate.
7. Are there any restraints impacting market growth?
Slow Penetration Rate in Developing Countries; Lack of Funding and Capital Expenditure.
8. Can you provide examples of recent developments in the market?
March 2023: Apple's patent pertains to the integration of smart fabrics with a lighting system designed for incorporation into fabric seats, door panels, dashboards, and other interior components of systems like vehicles. This lighting system not only offers ambient illumination but also enables the creation of bespoke surface textures, decorative patterns, and the display of icons, text, and other information. Additionally, it supports custom gauge configurations.
9. What pricing options are available for accessing the report?
Pricing options include single-user, multi-user, and enterprise licenses priced at USD 4750, USD 5250, and USD 8750 respectively.
10. Is the market size provided in terms of value or volume?
The market size is provided in terms of value, measured in Million and volume, measured in K Unit.
11. Are there any specific market keywords associated with the report?
Yes, the market keyword associated with the report is "Smart Fabric for Transportation Industry," which aids in identifying and referencing the specific market segment covered.
12. How do I determine which pricing option suits my needs best?
The pricing options vary based on user requirements and access needs. Individual users may opt for single-user licenses, while businesses requiring broader access may choose multi-user or enterprise licenses for cost-effective access to the report.
13. Are there any additional resources or data provided in the Smart Fabric for Transportation Industry report?
While the report offers comprehensive insights, it's advisable to review the specific contents or supplementary materials provided to ascertain if additional resources or data are available.
14. How can I stay updated on further developments or reports in the Smart Fabric for Transportation Industry?
To stay informed about further developments, trends, and reports in the Smart Fabric for Transportation Industry, consider subscribing to industry newsletters, following relevant companies and organizations, or regularly checking reputable industry news sources and publications.
Methodology
Step 1 - Identification of Relevant Samples Size from Population Database


Step 2 - Approaches for Defining Global Market Size (Value, Volume* & Price*)

Note*: In applicable scenarios
Step 3 - Data Sources
Primary Research
- Web Analytics
- Survey Reports
- Research Institute
- Latest Research Reports
- Opinion Leaders
Secondary Research
- Annual Reports
- White Paper
- Latest Press Release
- Industry Association
- Paid Database
- Investor Presentations

Step 4 - Data Triangulation
Involves using different sources of information in order to increase the validity of a study
These sources are likely to be stakeholders in a program - participants, other researchers, program staff, other community members, and so on.
Then we put all data in single framework & apply various statistical tools to find out the dynamic on the market.
During the analysis stage, feedback from the stakeholder groups would be compared to determine areas of agreement as well as areas of divergence