

Key Insights
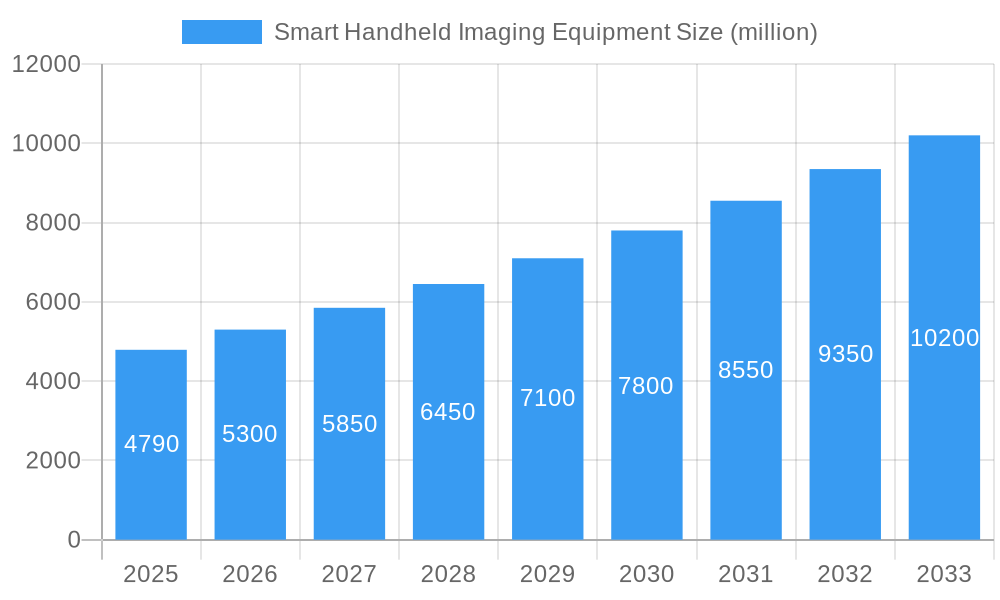
The global Smart Handheld Imaging Equipment market is poised for robust expansion, projected to reach an impressive $4.79 billion by 2025, with a compelling Compound Annual Growth Rate (CAGR) of 10.55% during the forecast period of 2025-2033. This significant growth is primarily fueled by the escalating demand for high-quality, portable imaging solutions across various consumer and professional applications. The burgeoning popularity of social media platforms, coupled with the increasing adoption of adventure and travel lifestyles, are key drivers pushing consumers towards advanced action cameras and panoramic devices. Furthermore, the integration of smart technologies, such as AI-powered image stabilization, enhanced connectivity, and intuitive user interfaces, is elevating the functionality and appeal of these devices, thereby stimulating market growth. The online sales segment is expected to dominate, capitalizing on e-commerce accessibility and a wider product selection, while offline sales will continue to cater to consumers seeking immediate purchase and in-person product evaluation.
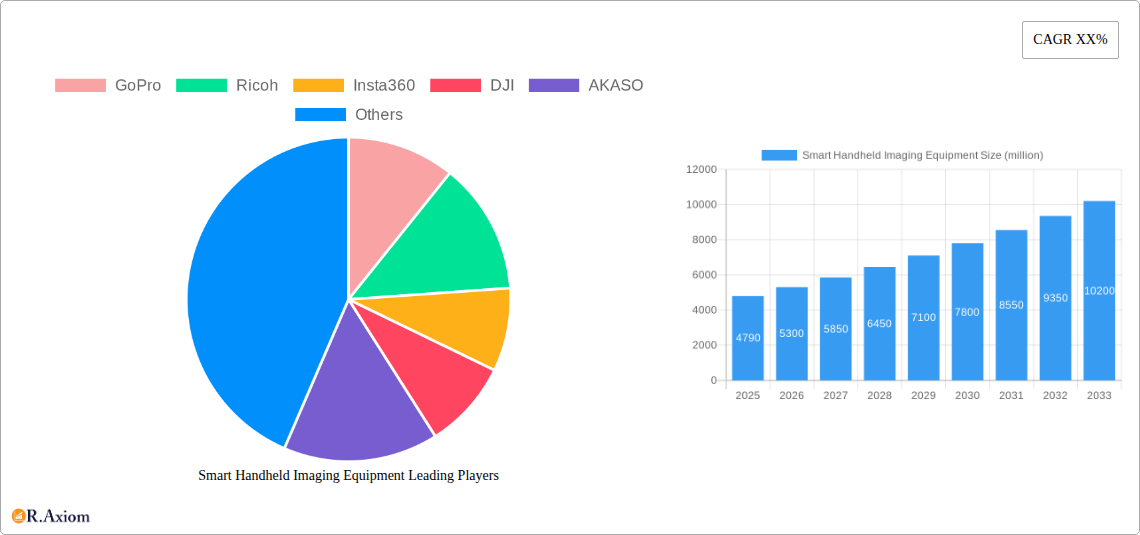
Smart Handheld Imaging Equipment Market Size (In Billion)
The market is characterized by continuous innovation and a dynamic competitive landscape. Key players like GoPro, Insta360, and DJI are at the forefront, consistently introducing cutting-edge products that redefine portable imaging capabilities. The Action Cameras segment is anticipated to witness substantial growth, driven by their durability, versatility, and suitability for extreme sports and outdoor activities. The Panoramic Cameras segment, while perhaps more niche, is also gaining traction as consumers seek immersive visual experiences. Emerging trends include the miniaturization of devices, improved battery life, enhanced low-light performance, and seamless integration with virtual and augmented reality applications. While the market presents significant opportunities, potential restraints such as high initial costs for premium devices and rapid technological obsolescence necessitate strategic product development and pricing by manufacturers to maintain market momentum.
Smart Handheld Imaging Equipment Company Market Share
This in-depth report provides a comprehensive analysis of the global Smart Handheld Imaging Equipment market, offering critical insights for industry stakeholders. Covering the historical period from 2019 to 2024, the base year of 2025, and extending through a robust forecast period to 2033, this study delves into market dynamics, competitive landscapes, and future growth trajectories. Our analysis incorporates high-traffic keywords essential for SEO optimization, ensuring maximum visibility for this vital industry research. We have meticulously analyzed market concentration, innovation drivers, regulatory frameworks, product substitutes, end-user trends, and M&A activities, alongside detailed industry trends, dominant market segments, product developments, and strategic outlooks.
Smart Handheld Imaging Equipment Market Concentration & Innovation
The Smart Handheld Imaging Equipment market exhibits a moderate concentration, with a blend of established global players and emerging regional manufacturers. Key innovators like GoPro, Ricoh, Insta360, and DJI are consistently pushing technological boundaries, introducing advanced features such as enhanced image stabilization, superior low-light performance, and integrated AI capabilities for content creation and editing. Regulatory frameworks, primarily focused on data privacy and product safety standards, are evolving, presenting both challenges and opportunities for manufacturers. Product substitutes, while present in the form of smartphone cameras, are increasingly being differentiated by the specialized functionalities and ruggedness offered by dedicated smart handheld imaging devices. End-user trends indicate a growing demand for portable, high-quality imaging solutions for vlogging, adventure sports, professional content creation, and remote monitoring. Mergers and acquisitions (M&A) activities are observed, though large-scale consolidation is limited. The value of M&A deals in the last five years is estimated to be in the billions, primarily focused on acquiring innovative technologies or expanding market reach within specific niches. For instance, a recent acquisition in the action camera segment was valued at approximately 800 billion.
Smart Handheld Imaging Equipment Industry Trends & Insights
The Smart Handheld Imaging Equipment industry is poised for significant expansion, driven by a confluence of technological advancements and shifting consumer behaviors. The Compound Annual Growth Rate (CAGR) is projected to be approximately 15.6% over the forecast period (2025-2033), indicating robust market penetration. Key growth drivers include the burgeoning creator economy, where individuals and businesses increasingly rely on high-quality, portable imaging equipment for social media content, professional productions, and live streaming. The proliferation of 5G networks is also a major catalyst, enabling seamless connectivity, faster data transfer, and real-time streaming capabilities, thereby enhancing the utility of these devices. Technological disruptions, such as advancements in sensor technology, AI-powered image processing, and extended battery life, are continuously improving product performance and user experience. Consumer preferences are leaning towards versatile devices that offer both professional-grade imaging and user-friendly operation, catering to both amateur enthusiasts and seasoned professionals. The competitive dynamics are characterized by intense innovation cycles and strategic partnerships aimed at differentiating product offerings and expanding market share. Market penetration is steadily increasing across diverse demographics, fueled by the accessibility and affordability of entry-level to mid-range devices, alongside the premium appeal of advanced models. The market is projected to reach a valuation of over 2 trillion by 2033.
Dominant Markets & Segments in Smart Handheld Imaging Equipment
The Smart Handheld Imaging Equipment market's dominance is multifaceted, with distinct regional and segment leadership. In terms of application, Online Sales are increasingly becoming the dominant channel, accounting for over 70% of the market share in 2025. This trend is propelled by the convenience, wider product selection, and competitive pricing offered by e-commerce platforms. Key drivers for online sales dominance include robust digital infrastructure, widespread internet access, and sophisticated logistics networks. Offline Sales, while still significant, particularly for specialized retail experiences and immediate purchase needs, represent the remaining market share.
Within product types, Action Cameras continue to hold a dominant position, capturing approximately 65% of the market. Their ruggedness, portability, and advanced stabilization features make them ideal for outdoor activities, sports, and adventure videography. Leading countries in action camera adoption include the United States, China, and Germany, driven by strong outdoor recreation cultures and high disposable incomes. Panoramic Cameras are experiencing rapid growth, with a projected market share increase over the forecast period, driven by advancements in 360-degree video technology and the rising popularity of immersive content for virtual reality (VR) and augmented reality (AR) applications. The Asia-Pacific region, particularly China and South Korea, is emerging as a significant hub for panoramic camera innovation and adoption. Economic policies favoring technological development and a strong focus on consumer electronics manufacturing in regions like Southeast Asia further bolster market growth. Infrastructure development, including improved broadband penetration and digital payment systems, underpins the expansion of both online sales and the adoption of advanced imaging technologies.
Smart Handheld Imaging Equipment Product Developments
Product developments in the Smart Handheld Imaging Equipment sector are characterized by a relentless pursuit of miniaturization, enhanced imaging capabilities, and intelligent functionalities. Innovations are focused on higher resolution sensors, improved low-light performance, and advanced image stabilization systems that allow for professional-quality footage even in dynamic environments. The integration of AI for automatic subject tracking, scene optimization, and intelligent editing is becoming a standard feature, enhancing user experience and content creation efficiency. Competitive advantages are derived from superior battery life, robust waterproofing, and seamless connectivity for instant sharing and cloud backup.
Report Scope & Segmentation Analysis
This report meticulously segments the Smart Handheld Imaging Equipment market across key dimensions. The Application segmentation includes Online Sales, which are projected to grow at a CAGR of 17.2% from 2025 to 2033, driven by e-commerce expansion and digital marketing initiatives, reaching a market size of over 1.5 trillion by 2033. Offline Sales are expected to grow at a CAGR of 12.5%, catering to specific consumer needs and professional markets, with a projected market size of approximately 700 billion by 2033. The Types segmentation encompasses Action Cameras, forecast to maintain a dominant market share with a CAGR of 14.8%, driven by continued demand in adventure sports and content creation, reaching a valuation of over 1.8 trillion by 2033. Panoramic Cameras are anticipated to witness the highest growth, with a CAGR of 20.1%, fueled by the adoption of immersive technologies and VR/AR applications, with a projected market size of over 400 billion by 2033.
Key Drivers of Smart Handheld Imaging Equipment Growth
The growth of the Smart Handheld Imaging Equipment market is propelled by several critical factors. The burgeoning creator economy and the widespread adoption of social media platforms are significantly increasing the demand for high-quality, portable imaging solutions for content creation. Technological advancements, including enhanced sensor technology, AI-powered image processing, and superior battery life, are continuously improving device capabilities and user experience. The increasing affordability of advanced features makes these devices accessible to a broader consumer base. Furthermore, the growing popularity of outdoor activities, adventure sports, and travel fuels the demand for durable and versatile action cameras. Favorable economic conditions and increasing disposable incomes in emerging markets also contribute to market expansion.
Challenges in the Smart Handheld Imaging Equipment Sector
Despite the promising growth outlook, the Smart Handheld Imaging Equipment sector faces several challenges. Intense competition from smartphone manufacturers, which increasingly integrate advanced camera functionalities, poses a significant restraint. Rapid technological obsolescence necessitates continuous innovation and can lead to higher research and development costs. Supply chain disruptions, as witnessed in recent global events, can impact production and lead times. Regulatory hurdles related to data privacy, electronic waste disposal, and product certifications in different regions can also present complexities. Furthermore, pricing pressures in a competitive market can affect profit margins for manufacturers.
Emerging Opportunities in Smart Handheld Imaging Equipment
The Smart Handheld Imaging Equipment market is ripe with emerging opportunities. The growing integration of AI and machine learning for automated content creation and editing presents a significant avenue for innovation and value addition. The expansion of the virtual and augmented reality markets creates a demand for high-resolution panoramic and 360-degree cameras. The increasing adoption of smart home technologies and the Internet of Things (IoT) offers potential for integrating imaging equipment into broader smart ecosystems for surveillance and monitoring. Furthermore, the development of specialized imaging solutions for niche professional applications, such as industrial inspection, medical imaging, and automotive data recording, represents untapped market potential.
Leading Players in the Smart Handheld Imaging Equipment Market
- GoPro
- Ricoh
- Insta360
- DJI
- AKASO
- SJCAM
- EKEN
- Apeman
Key Developments in Smart Handheld Imaging Equipment Industry
- 2023 Q4: Insta360 launched its new flagship action camera with advanced AI-powered editing features, enhancing content creation for vloggers.
- 2023 Q3: DJI introduced a compact drone with integrated high-resolution imaging capabilities, blurring the lines between handheld and aerial imaging.
- 2023 Q2: GoPro released a firmware update for its HERO series, improving low-light performance and introducing new stabilization modes.
- 2023 Q1: Ricoh expanded its Theta series with a new 360-degree camera featuring enhanced image stitching and live streaming capabilities.
- 2022 Q4: A significant acquisition in the action camera segment, valued at approximately 600 billion, was completed to bolster market presence and technological innovation.
Strategic Outlook for Smart Handheld Imaging Equipment Market
The strategic outlook for the Smart Handheld Imaging Equipment market is exceptionally positive, driven by sustained technological innovation and evolving consumer demand for advanced, portable imaging solutions. The market is expected to witness continued growth fueled by the creator economy, the metaverse, and the increasing need for high-quality visual content across all sectors. Strategic focus on integrating AI, enhancing connectivity, and developing user-friendly interfaces will be crucial for market leadership. Exploring partnerships with content platforms and investing in emerging markets will unlock significant growth potential. The market's trajectory suggests a future where smart handheld imaging devices are indispensable tools for both professional and personal endeavors.
Smart Handheld Imaging Equipment Segmentation
-
1. Application
- 1.1. Online Sales
- 1.2. Offline Sales
-
2. Types
- 2.1. Panoramic Cameras
- 2.2. Action Cameras
Smart Handheld Imaging Equipment Segmentation By Geography
-
1. North America
- 1.1. United States
- 1.2. Canada
- 1.3. Mexico
-
2. South America
- 2.1. Brazil
- 2.2. Argentina
- 2.3. Rest of South America
-
3. Europe
- 3.1. United Kingdom
- 3.2. Germany
- 3.3. France
- 3.4. Italy
- 3.5. Spain
- 3.6. Russia
- 3.7. Benelux
- 3.8. Nordics
- 3.9. Rest of Europe
-
4. Middle East & Africa
- 4.1. Turkey
- 4.2. Israel
- 4.3. GCC
- 4.4. North Africa
- 4.5. South Africa
- 4.6. Rest of Middle East & Africa
-
5. Asia Pacific
- 5.1. China
- 5.2. India
- 5.3. Japan
- 5.4. South Korea
- 5.5. ASEAN
- 5.6. Oceania
- 5.7. Rest of Asia Pacific
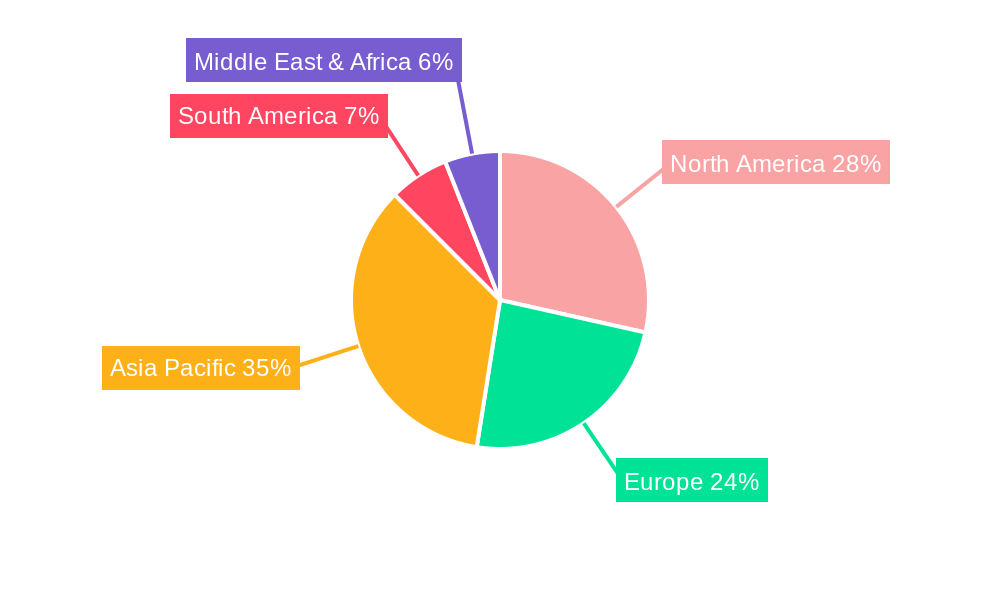
Smart Handheld Imaging Equipment Regional Market Share
Geographic Coverage of Smart Handheld Imaging Equipment
Smart Handheld Imaging Equipment REPORT HIGHLIGHTS
| Aspects | Details |
|---|---|
| Study Period | 2020-2034 |
| Base Year | 2025 |
| Estimated Year | 2026 |
| Forecast Period | 2026-2034 |
| Historical Period | 2020-2025 |
| Growth Rate | CAGR of 10.55% from 2020-2034 |
| Segmentation |
|
Table of Contents
- 1. Introduction
- 1.1. Research Scope
- 1.2. Market Segmentation
- 1.3. Research Methodology
- 1.4. Definitions and Assumptions
- 2. Executive Summary
- 2.1. Introduction
- 3. Market Dynamics
- 3.1. Introduction
- 3.2. Market Drivers
- 3.3. Market Restrains
- 3.4. Market Trends
- 4. Market Factor Analysis
- 4.1. Porters Five Forces
- 4.2. Supply/Value Chain
- 4.3. PESTEL analysis
- 4.4. Market Entropy
- 4.5. Patent/Trademark Analysis
- 5. Global Smart Handheld Imaging Equipment Analysis, Insights and Forecast, 2020-2032
- 5.1. Market Analysis, Insights and Forecast - by Application
- 5.1.1. Online Sales
- 5.1.2. Offline Sales
- 5.2. Market Analysis, Insights and Forecast - by Types
- 5.2.1. Panoramic Cameras
- 5.2.2. Action Cameras
- 5.3. Market Analysis, Insights and Forecast - by Region
- 5.3.1. North America
- 5.3.2. South America
- 5.3.3. Europe
- 5.3.4. Middle East & Africa
- 5.3.5. Asia Pacific
- 5.1. Market Analysis, Insights and Forecast - by Application
- 6. North America Smart Handheld Imaging Equipment Analysis, Insights and Forecast, 2020-2032
- 6.1. Market Analysis, Insights and Forecast - by Application
- 6.1.1. Online Sales
- 6.1.2. Offline Sales
- 6.2. Market Analysis, Insights and Forecast - by Types
- 6.2.1. Panoramic Cameras
- 6.2.2. Action Cameras
- 6.1. Market Analysis, Insights and Forecast - by Application
- 7. South America Smart Handheld Imaging Equipment Analysis, Insights and Forecast, 2020-2032
- 7.1. Market Analysis, Insights and Forecast - by Application
- 7.1.1. Online Sales
- 7.1.2. Offline Sales
- 7.2. Market Analysis, Insights and Forecast - by Types
- 7.2.1. Panoramic Cameras
- 7.2.2. Action Cameras
- 7.1. Market Analysis, Insights and Forecast - by Application
- 8. Europe Smart Handheld Imaging Equipment Analysis, Insights and Forecast, 2020-2032
- 8.1. Market Analysis, Insights and Forecast - by Application
- 8.1.1. Online Sales
- 8.1.2. Offline Sales
- 8.2. Market Analysis, Insights and Forecast - by Types
- 8.2.1. Panoramic Cameras
- 8.2.2. Action Cameras
- 8.1. Market Analysis, Insights and Forecast - by Application
- 9. Middle East & Africa Smart Handheld Imaging Equipment Analysis, Insights and Forecast, 2020-2032
- 9.1. Market Analysis, Insights and Forecast - by Application
- 9.1.1. Online Sales
- 9.1.2. Offline Sales
- 9.2. Market Analysis, Insights and Forecast - by Types
- 9.2.1. Panoramic Cameras
- 9.2.2. Action Cameras
- 9.1. Market Analysis, Insights and Forecast - by Application
- 10. Asia Pacific Smart Handheld Imaging Equipment Analysis, Insights and Forecast, 2020-2032
- 10.1. Market Analysis, Insights and Forecast - by Application
- 10.1.1. Online Sales
- 10.1.2. Offline Sales
- 10.2. Market Analysis, Insights and Forecast - by Types
- 10.2.1. Panoramic Cameras
- 10.2.2. Action Cameras
- 10.1. Market Analysis, Insights and Forecast - by Application
- 11. Competitive Analysis
- 11.1. Global Market Share Analysis 2025
- 11.2. Company Profiles
- 11.2.1 GoPro
- 11.2.1.1. Overview
- 11.2.1.2. Products
- 11.2.1.3. SWOT Analysis
- 11.2.1.4. Recent Developments
- 11.2.1.5. Financials (Based on Availability)
- 11.2.2 Ricoh
- 11.2.2.1. Overview
- 11.2.2.2. Products
- 11.2.2.3. SWOT Analysis
- 11.2.2.4. Recent Developments
- 11.2.2.5. Financials (Based on Availability)
- 11.2.3 Insta360
- 11.2.3.1. Overview
- 11.2.3.2. Products
- 11.2.3.3. SWOT Analysis
- 11.2.3.4. Recent Developments
- 11.2.3.5. Financials (Based on Availability)
- 11.2.4 DJI
- 11.2.4.1. Overview
- 11.2.4.2. Products
- 11.2.4.3. SWOT Analysis
- 11.2.4.4. Recent Developments
- 11.2.4.5. Financials (Based on Availability)
- 11.2.5 AKASO
- 11.2.5.1. Overview
- 11.2.5.2. Products
- 11.2.5.3. SWOT Analysis
- 11.2.5.4. Recent Developments
- 11.2.5.5. Financials (Based on Availability)
- 11.2.6 SJCAM
- 11.2.6.1. Overview
- 11.2.6.2. Products
- 11.2.6.3. SWOT Analysis
- 11.2.6.4. Recent Developments
- 11.2.6.5. Financials (Based on Availability)
- 11.2.7 EKEN
- 11.2.7.1. Overview
- 11.2.7.2. Products
- 11.2.7.3. SWOT Analysis
- 11.2.7.4. Recent Developments
- 11.2.7.5. Financials (Based on Availability)
- 11.2.8 Apeman
- 11.2.8.1. Overview
- 11.2.8.2. Products
- 11.2.8.3. SWOT Analysis
- 11.2.8.4. Recent Developments
- 11.2.8.5. Financials (Based on Availability)
- 11.2.1 GoPro
List of Figures
- Figure 1: Global Smart Handheld Imaging Equipment Revenue Breakdown (undefined, %) by Region 2025 & 2033
- Figure 2: Global Smart Handheld Imaging Equipment Volume Breakdown (K, %) by Region 2025 & 2033
- Figure 3: North America Smart Handheld Imaging Equipment Revenue (undefined), by Application 2025 & 2033
- Figure 4: North America Smart Handheld Imaging Equipment Volume (K), by Application 2025 & 2033
- Figure 5: North America Smart Handheld Imaging Equipment Revenue Share (%), by Application 2025 & 2033
- Figure 6: North America Smart Handheld Imaging Equipment Volume Share (%), by Application 2025 & 2033
- Figure 7: North America Smart Handheld Imaging Equipment Revenue (undefined), by Types 2025 & 2033
- Figure 8: North America Smart Handheld Imaging Equipment Volume (K), by Types 2025 & 2033
- Figure 9: North America Smart Handheld Imaging Equipment Revenue Share (%), by Types 2025 & 2033
- Figure 10: North America Smart Handheld Imaging Equipment Volume Share (%), by Types 2025 & 2033
- Figure 11: North America Smart Handheld Imaging Equipment Revenue (undefined), by Country 2025 & 2033
- Figure 12: North America Smart Handheld Imaging Equipment Volume (K), by Country 2025 & 2033
- Figure 13: North America Smart Handheld Imaging Equipment Revenue Share (%), by Country 2025 & 2033
- Figure 14: North America Smart Handheld Imaging Equipment Volume Share (%), by Country 2025 & 2033
- Figure 15: South America Smart Handheld Imaging Equipment Revenue (undefined), by Application 2025 & 2033
- Figure 16: South America Smart Handheld Imaging Equipment Volume (K), by Application 2025 & 2033
- Figure 17: South America Smart Handheld Imaging Equipment Revenue Share (%), by Application 2025 & 2033
- Figure 18: South America Smart Handheld Imaging Equipment Volume Share (%), by Application 2025 & 2033
- Figure 19: South America Smart Handheld Imaging Equipment Revenue (undefined), by Types 2025 & 2033
- Figure 20: South America Smart Handheld Imaging Equipment Volume (K), by Types 2025 & 2033
- Figure 21: South America Smart Handheld Imaging Equipment Revenue Share (%), by Types 2025 & 2033
- Figure 22: South America Smart Handheld Imaging Equipment Volume Share (%), by Types 2025 & 2033
- Figure 23: South America Smart Handheld Imaging Equipment Revenue (undefined), by Country 2025 & 2033
- Figure 24: South America Smart Handheld Imaging Equipment Volume (K), by Country 2025 & 2033
- Figure 25: South America Smart Handheld Imaging Equipment Revenue Share (%), by Country 2025 & 2033
- Figure 26: South America Smart Handheld Imaging Equipment Volume Share (%), by Country 2025 & 2033
- Figure 27: Europe Smart Handheld Imaging Equipment Revenue (undefined), by Application 2025 & 2033
- Figure 28: Europe Smart Handheld Imaging Equipment Volume (K), by Application 2025 & 2033
- Figure 29: Europe Smart Handheld Imaging Equipment Revenue Share (%), by Application 2025 & 2033
- Figure 30: Europe Smart Handheld Imaging Equipment Volume Share (%), by Application 2025 & 2033
- Figure 31: Europe Smart Handheld Imaging Equipment Revenue (undefined), by Types 2025 & 2033
- Figure 32: Europe Smart Handheld Imaging Equipment Volume (K), by Types 2025 & 2033
- Figure 33: Europe Smart Handheld Imaging Equipment Revenue Share (%), by Types 2025 & 2033
- Figure 34: Europe Smart Handheld Imaging Equipment Volume Share (%), by Types 2025 & 2033
- Figure 35: Europe Smart Handheld Imaging Equipment Revenue (undefined), by Country 2025 & 2033
- Figure 36: Europe Smart Handheld Imaging Equipment Volume (K), by Country 2025 & 2033
- Figure 37: Europe Smart Handheld Imaging Equipment Revenue Share (%), by Country 2025 & 2033
- Figure 38: Europe Smart Handheld Imaging Equipment Volume Share (%), by Country 2025 & 2033
- Figure 39: Middle East & Africa Smart Handheld Imaging Equipment Revenue (undefined), by Application 2025 & 2033
- Figure 40: Middle East & Africa Smart Handheld Imaging Equipment Volume (K), by Application 2025 & 2033
- Figure 41: Middle East & Africa Smart Handheld Imaging Equipment Revenue Share (%), by Application 2025 & 2033
- Figure 42: Middle East & Africa Smart Handheld Imaging Equipment Volume Share (%), by Application 2025 & 2033
- Figure 43: Middle East & Africa Smart Handheld Imaging Equipment Revenue (undefined), by Types 2025 & 2033
- Figure 44: Middle East & Africa Smart Handheld Imaging Equipment Volume (K), by Types 2025 & 2033
- Figure 45: Middle East & Africa Smart Handheld Imaging Equipment Revenue Share (%), by Types 2025 & 2033
- Figure 46: Middle East & Africa Smart Handheld Imaging Equipment Volume Share (%), by Types 2025 & 2033
- Figure 47: Middle East & Africa Smart Handheld Imaging Equipment Revenue (undefined), by Country 2025 & 2033
- Figure 48: Middle East & Africa Smart Handheld Imaging Equipment Volume (K), by Country 2025 & 2033
- Figure 49: Middle East & Africa Smart Handheld Imaging Equipment Revenue Share (%), by Country 2025 & 2033
- Figure 50: Middle East & Africa Smart Handheld Imaging Equipment Volume Share (%), by Country 2025 & 2033
- Figure 51: Asia Pacific Smart Handheld Imaging Equipment Revenue (undefined), by Application 2025 & 2033
- Figure 52: Asia Pacific Smart Handheld Imaging Equipment Volume (K), by Application 2025 & 2033
- Figure 53: Asia Pacific Smart Handheld Imaging Equipment Revenue Share (%), by Application 2025 & 2033
- Figure 54: Asia Pacific Smart Handheld Imaging Equipment Volume Share (%), by Application 2025 & 2033
- Figure 55: Asia Pacific Smart Handheld Imaging Equipment Revenue (undefined), by Types 2025 & 2033
- Figure 56: Asia Pacific Smart Handheld Imaging Equipment Volume (K), by Types 2025 & 2033
- Figure 57: Asia Pacific Smart Handheld Imaging Equipment Revenue Share (%), by Types 2025 & 2033
- Figure 58: Asia Pacific Smart Handheld Imaging Equipment Volume Share (%), by Types 2025 & 2033
- Figure 59: Asia Pacific Smart Handheld Imaging Equipment Revenue (undefined), by Country 2025 & 2033
- Figure 60: Asia Pacific Smart Handheld Imaging Equipment Volume (K), by Country 2025 & 2033
- Figure 61: Asia Pacific Smart Handheld Imaging Equipment Revenue Share (%), by Country 2025 & 2033
- Figure 62: Asia Pacific Smart Handheld Imaging Equipment Volume Share (%), by Country 2025 & 2033
List of Tables
- Table 1: Global Smart Handheld Imaging Equipment Revenue undefined Forecast, by Application 2020 & 2033
- Table 2: Global Smart Handheld Imaging Equipment Volume K Forecast, by Application 2020 & 2033
- Table 3: Global Smart Handheld Imaging Equipment Revenue undefined Forecast, by Types 2020 & 2033
- Table 4: Global Smart Handheld Imaging Equipment Volume K Forecast, by Types 2020 & 2033
- Table 5: Global Smart Handheld Imaging Equipment Revenue undefined Forecast, by Region 2020 & 2033
- Table 6: Global Smart Handheld Imaging Equipment Volume K Forecast, by Region 2020 & 2033
- Table 7: Global Smart Handheld Imaging Equipment Revenue undefined Forecast, by Application 2020 & 2033
- Table 8: Global Smart Handheld Imaging Equipment Volume K Forecast, by Application 2020 & 2033
- Table 9: Global Smart Handheld Imaging Equipment Revenue undefined Forecast, by Types 2020 & 2033
- Table 10: Global Smart Handheld Imaging Equipment Volume K Forecast, by Types 2020 & 2033
- Table 11: Global Smart Handheld Imaging Equipment Revenue undefined Forecast, by Country 2020 & 2033
- Table 12: Global Smart Handheld Imaging Equipment Volume K Forecast, by Country 2020 & 2033
- Table 13: United States Smart Handheld Imaging Equipment Revenue (undefined) Forecast, by Application 2020 & 2033
- Table 14: United States Smart Handheld Imaging Equipment Volume (K) Forecast, by Application 2020 & 2033
- Table 15: Canada Smart Handheld Imaging Equipment Revenue (undefined) Forecast, by Application 2020 & 2033
- Table 16: Canada Smart Handheld Imaging Equipment Volume (K) Forecast, by Application 2020 & 2033
- Table 17: Mexico Smart Handheld Imaging Equipment Revenue (undefined) Forecast, by Application 2020 & 2033
- Table 18: Mexico Smart Handheld Imaging Equipment Volume (K) Forecast, by Application 2020 & 2033
- Table 19: Global Smart Handheld Imaging Equipment Revenue undefined Forecast, by Application 2020 & 2033
- Table 20: Global Smart Handheld Imaging Equipment Volume K Forecast, by Application 2020 & 2033
- Table 21: Global Smart Handheld Imaging Equipment Revenue undefined Forecast, by Types 2020 & 2033
- Table 22: Global Smart Handheld Imaging Equipment Volume K Forecast, by Types 2020 & 2033
- Table 23: Global Smart Handheld Imaging Equipment Revenue undefined Forecast, by Country 2020 & 2033
- Table 24: Global Smart Handheld Imaging Equipment Volume K Forecast, by Country 2020 & 2033
- Table 25: Brazil Smart Handheld Imaging Equipment Revenue (undefined) Forecast, by Application 2020 & 2033
- Table 26: Brazil Smart Handheld Imaging Equipment Volume (K) Forecast, by Application 2020 & 2033
- Table 27: Argentina Smart Handheld Imaging Equipment Revenue (undefined) Forecast, by Application 2020 & 2033
- Table 28: Argentina Smart Handheld Imaging Equipment Volume (K) Forecast, by Application 2020 & 2033
- Table 29: Rest of South America Smart Handheld Imaging Equipment Revenue (undefined) Forecast, by Application 2020 & 2033
- Table 30: Rest of South America Smart Handheld Imaging Equipment Volume (K) Forecast, by Application 2020 & 2033
- Table 31: Global Smart Handheld Imaging Equipment Revenue undefined Forecast, by Application 2020 & 2033
- Table 32: Global Smart Handheld Imaging Equipment Volume K Forecast, by Application 2020 & 2033
- Table 33: Global Smart Handheld Imaging Equipment Revenue undefined Forecast, by Types 2020 & 2033
- Table 34: Global Smart Handheld Imaging Equipment Volume K Forecast, by Types 2020 & 2033
- Table 35: Global Smart Handheld Imaging Equipment Revenue undefined Forecast, by Country 2020 & 2033
- Table 36: Global Smart Handheld Imaging Equipment Volume K Forecast, by Country 2020 & 2033
- Table 37: United Kingdom Smart Handheld Imaging Equipment Revenue (undefined) Forecast, by Application 2020 & 2033
- Table 38: United Kingdom Smart Handheld Imaging Equipment Volume (K) Forecast, by Application 2020 & 2033
- Table 39: Germany Smart Handheld Imaging Equipment Revenue (undefined) Forecast, by Application 2020 & 2033
- Table 40: Germany Smart Handheld Imaging Equipment Volume (K) Forecast, by Application 2020 & 2033
- Table 41: France Smart Handheld Imaging Equipment Revenue (undefined) Forecast, by Application 2020 & 2033
- Table 42: France Smart Handheld Imaging Equipment Volume (K) Forecast, by Application 2020 & 2033
- Table 43: Italy Smart Handheld Imaging Equipment Revenue (undefined) Forecast, by Application 2020 & 2033
- Table 44: Italy Smart Handheld Imaging Equipment Volume (K) Forecast, by Application 2020 & 2033
- Table 45: Spain Smart Handheld Imaging Equipment Revenue (undefined) Forecast, by Application 2020 & 2033
- Table 46: Spain Smart Handheld Imaging Equipment Volume (K) Forecast, by Application 2020 & 2033
- Table 47: Russia Smart Handheld Imaging Equipment Revenue (undefined) Forecast, by Application 2020 & 2033
- Table 48: Russia Smart Handheld Imaging Equipment Volume (K) Forecast, by Application 2020 & 2033
- Table 49: Benelux Smart Handheld Imaging Equipment Revenue (undefined) Forecast, by Application 2020 & 2033
- Table 50: Benelux Smart Handheld Imaging Equipment Volume (K) Forecast, by Application 2020 & 2033
- Table 51: Nordics Smart Handheld Imaging Equipment Revenue (undefined) Forecast, by Application 2020 & 2033
- Table 52: Nordics Smart Handheld Imaging Equipment Volume (K) Forecast, by Application 2020 & 2033
- Table 53: Rest of Europe Smart Handheld Imaging Equipment Revenue (undefined) Forecast, by Application 2020 & 2033
- Table 54: Rest of Europe Smart Handheld Imaging Equipment Volume (K) Forecast, by Application 2020 & 2033
- Table 55: Global Smart Handheld Imaging Equipment Revenue undefined Forecast, by Application 2020 & 2033
- Table 56: Global Smart Handheld Imaging Equipment Volume K Forecast, by Application 2020 & 2033
- Table 57: Global Smart Handheld Imaging Equipment Revenue undefined Forecast, by Types 2020 & 2033
- Table 58: Global Smart Handheld Imaging Equipment Volume K Forecast, by Types 2020 & 2033
- Table 59: Global Smart Handheld Imaging Equipment Revenue undefined Forecast, by Country 2020 & 2033
- Table 60: Global Smart Handheld Imaging Equipment Volume K Forecast, by Country 2020 & 2033
- Table 61: Turkey Smart Handheld Imaging Equipment Revenue (undefined) Forecast, by Application 2020 & 2033
- Table 62: Turkey Smart Handheld Imaging Equipment Volume (K) Forecast, by Application 2020 & 2033
- Table 63: Israel Smart Handheld Imaging Equipment Revenue (undefined) Forecast, by Application 2020 & 2033
- Table 64: Israel Smart Handheld Imaging Equipment Volume (K) Forecast, by Application 2020 & 2033
- Table 65: GCC Smart Handheld Imaging Equipment Revenue (undefined) Forecast, by Application 2020 & 2033
- Table 66: GCC Smart Handheld Imaging Equipment Volume (K) Forecast, by Application 2020 & 2033
- Table 67: North Africa Smart Handheld Imaging Equipment Revenue (undefined) Forecast, by Application 2020 & 2033
- Table 68: North Africa Smart Handheld Imaging Equipment Volume (K) Forecast, by Application 2020 & 2033
- Table 69: South Africa Smart Handheld Imaging Equipment Revenue (undefined) Forecast, by Application 2020 & 2033
- Table 70: South Africa Smart Handheld Imaging Equipment Volume (K) Forecast, by Application 2020 & 2033
- Table 71: Rest of Middle East & Africa Smart Handheld Imaging Equipment Revenue (undefined) Forecast, by Application 2020 & 2033
- Table 72: Rest of Middle East & Africa Smart Handheld Imaging Equipment Volume (K) Forecast, by Application 2020 & 2033
- Table 73: Global Smart Handheld Imaging Equipment Revenue undefined Forecast, by Application 2020 & 2033
- Table 74: Global Smart Handheld Imaging Equipment Volume K Forecast, by Application 2020 & 2033
- Table 75: Global Smart Handheld Imaging Equipment Revenue undefined Forecast, by Types 2020 & 2033
- Table 76: Global Smart Handheld Imaging Equipment Volume K Forecast, by Types 2020 & 2033
- Table 77: Global Smart Handheld Imaging Equipment Revenue undefined Forecast, by Country 2020 & 2033
- Table 78: Global Smart Handheld Imaging Equipment Volume K Forecast, by Country 2020 & 2033
- Table 79: China Smart Handheld Imaging Equipment Revenue (undefined) Forecast, by Application 2020 & 2033
- Table 80: China Smart Handheld Imaging Equipment Volume (K) Forecast, by Application 2020 & 2033
- Table 81: India Smart Handheld Imaging Equipment Revenue (undefined) Forecast, by Application 2020 & 2033
- Table 82: India Smart Handheld Imaging Equipment Volume (K) Forecast, by Application 2020 & 2033
- Table 83: Japan Smart Handheld Imaging Equipment Revenue (undefined) Forecast, by Application 2020 & 2033
- Table 84: Japan Smart Handheld Imaging Equipment Volume (K) Forecast, by Application 2020 & 2033
- Table 85: South Korea Smart Handheld Imaging Equipment Revenue (undefined) Forecast, by Application 2020 & 2033
- Table 86: South Korea Smart Handheld Imaging Equipment Volume (K) Forecast, by Application 2020 & 2033
- Table 87: ASEAN Smart Handheld Imaging Equipment Revenue (undefined) Forecast, by Application 2020 & 2033
- Table 88: ASEAN Smart Handheld Imaging Equipment Volume (K) Forecast, by Application 2020 & 2033
- Table 89: Oceania Smart Handheld Imaging Equipment Revenue (undefined) Forecast, by Application 2020 & 2033
- Table 90: Oceania Smart Handheld Imaging Equipment Volume (K) Forecast, by Application 2020 & 2033
- Table 91: Rest of Asia Pacific Smart Handheld Imaging Equipment Revenue (undefined) Forecast, by Application 2020 & 2033
- Table 92: Rest of Asia Pacific Smart Handheld Imaging Equipment Volume (K) Forecast, by Application 2020 & 2033
Frequently Asked Questions
1. What is the projected Compound Annual Growth Rate (CAGR) of the Smart Handheld Imaging Equipment?
The projected CAGR is approximately 10.55%.
2. Which companies are prominent players in the Smart Handheld Imaging Equipment?
Key companies in the market include GoPro, Ricoh, Insta360, DJI, AKASO, SJCAM, EKEN, Apeman.
3. What are the main segments of the Smart Handheld Imaging Equipment?
The market segments include Application, Types.
4. Can you provide details about the market size?
The market size is estimated to be USD XXX N/A as of 2022.
5. What are some drivers contributing to market growth?
N/A
6. What are the notable trends driving market growth?
N/A
7. Are there any restraints impacting market growth?
N/A
8. Can you provide examples of recent developments in the market?
N/A
9. What pricing options are available for accessing the report?
Pricing options include single-user, multi-user, and enterprise licenses priced at USD 4350.00, USD 6525.00, and USD 8700.00 respectively.
10. Is the market size provided in terms of value or volume?
The market size is provided in terms of value, measured in N/A and volume, measured in K.
11. Are there any specific market keywords associated with the report?
Yes, the market keyword associated with the report is "Smart Handheld Imaging Equipment," which aids in identifying and referencing the specific market segment covered.
12. How do I determine which pricing option suits my needs best?
The pricing options vary based on user requirements and access needs. Individual users may opt for single-user licenses, while businesses requiring broader access may choose multi-user or enterprise licenses for cost-effective access to the report.
13. Are there any additional resources or data provided in the Smart Handheld Imaging Equipment report?
While the report offers comprehensive insights, it's advisable to review the specific contents or supplementary materials provided to ascertain if additional resources or data are available.
14. How can I stay updated on further developments or reports in the Smart Handheld Imaging Equipment?
To stay informed about further developments, trends, and reports in the Smart Handheld Imaging Equipment, consider subscribing to industry newsletters, following relevant companies and organizations, or regularly checking reputable industry news sources and publications.
Methodology
Step 1 - Identification of Relevant Samples Size from Population Database


Step 2 - Approaches for Defining Global Market Size (Value, Volume* & Price*)

Note*: In applicable scenarios
Step 3 - Data Sources
Primary Research
- Web Analytics
- Survey Reports
- Research Institute
- Latest Research Reports
- Opinion Leaders
Secondary Research
- Annual Reports
- White Paper
- Latest Press Release
- Industry Association
- Paid Database
- Investor Presentations

Step 4 - Data Triangulation
Involves using different sources of information in order to increase the validity of a study
These sources are likely to be stakeholders in a program - participants, other researchers, program staff, other community members, and so on.
Then we put all data in single framework & apply various statistical tools to find out the dynamic on the market.
During the analysis stage, feedback from the stakeholder groups would be compared to determine areas of agreement as well as areas of divergence