
Key Insights
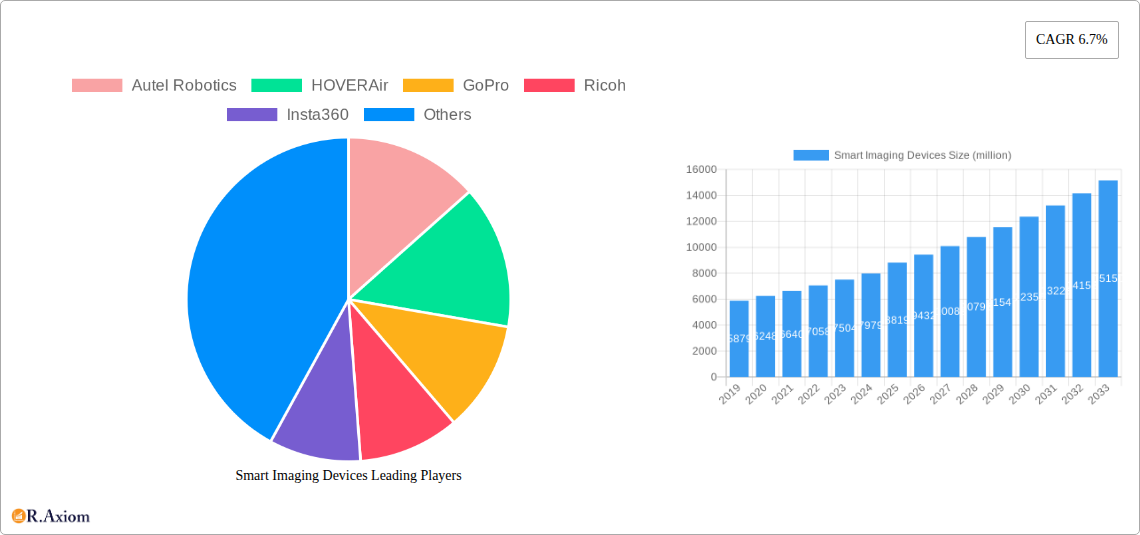
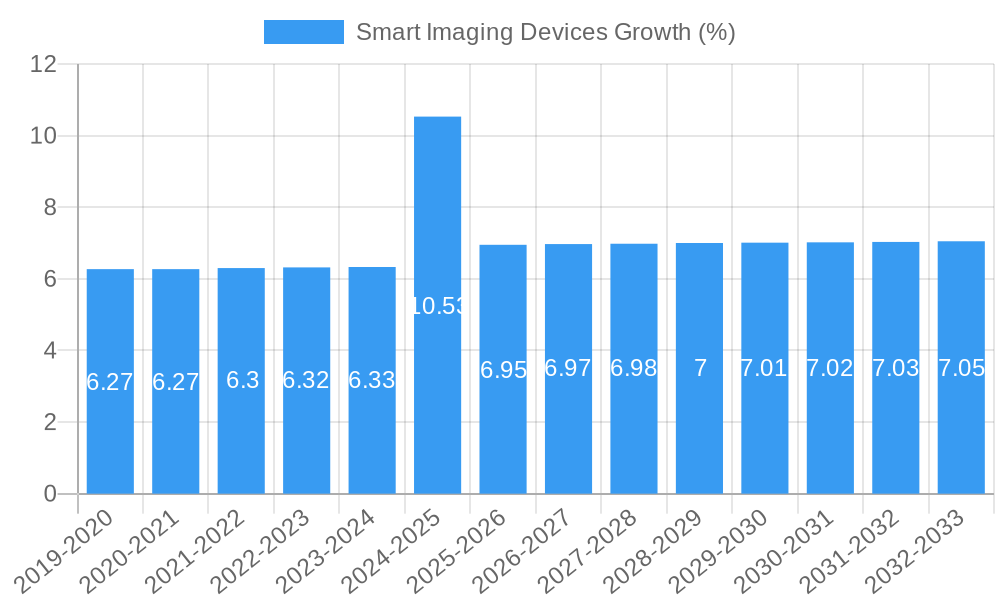
The global Smart Imaging Devices market is poised for substantial growth, projected to reach \$8,819 million by 2025, with a robust Compound Annual Growth Rate (CAGR) of 6.7% anticipated throughout the forecast period of 2025-2033. This expansion is fueled by a confluence of technological advancements and evolving consumer demands. Key drivers include the increasing integration of artificial intelligence and machine learning in imaging devices, enabling more sophisticated functionalities like object recognition, enhanced image stabilization, and intelligent content creation. The proliferation of smart home ecosystems and the growing adoption of connected devices further bolster market expansion, as smart imaging devices seamlessly integrate into these networked environments. Furthermore, the burgeoning demand for high-quality visual content across social media platforms, professional photography, and videography is a significant catalyst. Innovations in miniaturization, battery life, and connectivity are making these devices more accessible and versatile for a wider consumer base, from casual users to professional creators.
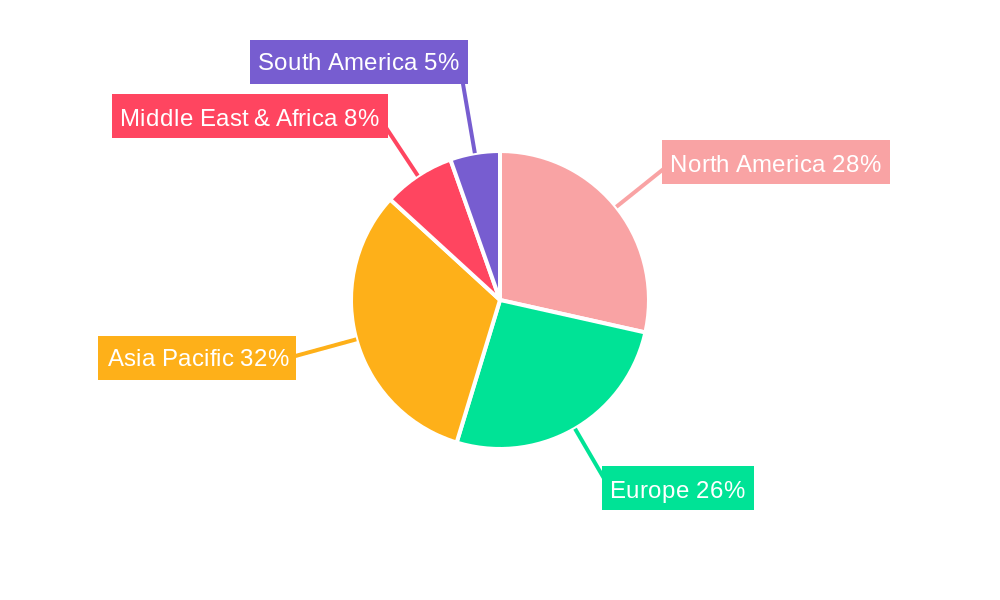
The market is characterized by dynamic segmentation, with "Online Sales" emerging as a dominant channel, reflecting the convenience and reach offered by e-commerce platforms. In terms of device types, "Handheld Smart Imaging Devices" are expected to lead, driven by their portability and ease of use in capturing dynamic moments. However, the "Smart Imaging Device Platform" segment also presents significant growth potential, indicating a shift towards integrated solutions and comprehensive imaging ecosystems. Geographically, the Asia Pacific region, particularly China and India, is anticipated to be a major growth engine due to its large, tech-savvy population and rapid urbanization. North America and Europe will continue to be significant markets, driven by early adoption of advanced technologies and a strong consumer appetite for innovative gadgets. While the market demonstrates strong upward momentum, potential restraints such as high initial costs for premium devices and evolving data privacy regulations may pose challenges that manufacturers will need to address through competitive pricing strategies and robust security measures.
Smart Imaging Devices Market Concentration & Innovation
The Smart Imaging Devices market exhibits a moderate to high concentration, with key players like DJI, Autel Robotics, and GoPro holding significant market share. Innovation is a primary driver, fueled by advancements in Artificial Intelligence (AI), miniaturization of sensors, and enhanced battery technology. Regulatory frameworks are evolving, focusing on data privacy, drone usage, and imaging standards, which can impact market entry and product development. Product substitutes, such as traditional cameras and smartphones with advanced imaging capabilities, pose a competitive threat, though smart imaging devices offer unique functionalities like real-time data capture, automation, and mobility. End-user trends indicate a growing demand for portable, user-friendly, and high-resolution imaging solutions across professional and consumer sectors. Mergers and acquisitions (M&A) are actively shaping the competitive landscape, with strategic consolidations aimed at expanding product portfolios and technological capabilities. For instance, the value of M&A deals in this sector is estimated to be in the hundreds of millions, reflecting the strategic importance of acquiring innovative technologies and market access. Companies are investing millions in R&D to stay ahead, contributing to a dynamic and evolving market. The estimated market share for leading players is in the tens of millions of units annually.
Smart Imaging Devices Industry Trends & Insights
The Smart Imaging Devices market is experiencing robust growth, driven by several interconnected trends. The increasing demand for visual content across social media platforms, professional photography, videography, and industrial applications is a significant market growth driver. Technological disruptions, particularly in AI-powered image processing, object recognition, and autonomous navigation for drones, are revolutionizing the capabilities of these devices, enabling new use cases and enhancing user experience. Consumer preferences are shifting towards more intuitive, connected, and intelligent imaging solutions. Features like advanced stabilization, high-resolution sensors (e.g., 8K video recording), and seamless integration with cloud platforms are becoming standard expectations. The competitive dynamics are intensifying, with established players continuously innovating and new entrants emerging with specialized offerings. The market penetration of smart imaging devices, especially in consumer electronics and professional surveillance, is steadily increasing, projected to reach millions of households and businesses globally. The Compound Annual Growth Rate (CAGR) for the smart imaging devices market is estimated at approximately 15% over the forecast period, reflecting strong underlying demand and technological advancements. Millions of units are expected to be sold annually, with market value reaching billions. The integration of IoT capabilities and advanced connectivity features further fuels market expansion.
Dominant Markets & Segments in Smart Imaging Devices
The global Smart Imaging Devices market demonstrates significant regional variations in dominance and segment penetration. North America and Asia-Pacific currently lead in market size and adoption, driven by a strong consumer electronics market, burgeoning e-commerce presence, and increasing investment in smart city initiatives and industrial automation. In terms of Application, Online Sales are a dominant channel, projected to account for over 60% of total sales by 2033, with an estimated market value in the billions. This growth is attributed to the convenience, wider product selection, and competitive pricing offered by e-commerce platforms. Offline Sales, while still substantial, are projected to grow at a slower pace.
Within the Types segmentation, Handheld Smart Imaging Devices, including advanced action cameras and smartphones with sophisticated imaging capabilities, currently command the largest market share, estimated in the tens of millions of units sold annually. Their portability and versatility for everyday use and professional content creation are key drivers. Non-Handheld Smart Imaging Devices, such as professional drones and surveillance cameras, are experiencing rapid growth, driven by their application in industries like agriculture, construction, and security, with a market value projected to reach billions. The Smart Imaging Device Platform segment, encompassing integrated software and hardware solutions for data management and analysis, is an emerging area with significant future potential, driven by the growing need for actionable insights from captured imagery. Economic policies promoting technological adoption, robust digital infrastructure, and high disposable incomes in key countries like the United States, China, and South Korea contribute to the dominance of these regions. Government initiatives supporting innovation and the adoption of smart technologies further bolster market growth.
Smart Imaging Devices Product Developments
Product developments in the smart imaging devices sector are characterized by rapid technological integration and user-centric design. Innovations focus on enhancing image quality through higher resolution sensors, improved low-light performance, and advanced computational photography. Miniaturization and increased battery life are critical for portable devices. AI capabilities are being integrated for intelligent scene recognition, object tracking, and automated editing. The development of robust connectivity options, including 5G and Wi-Fi 6, ensures seamless data transfer and cloud integration. Competitive advantages are being built around unique form factors, specialized features for niche applications (e.g., thermal imaging for industrial inspection), and intuitive user interfaces that democratize advanced imaging capabilities.
Report Scope & Segmentation Analysis
This report provides a comprehensive analysis of the Smart Imaging Devices market, encompassing a detailed segmentation by Application and Type.
- Application: The market is segmented into Online Sales and Offline Sales. Online Sales are expected to witness a significant CAGR of approximately 18% through 2033, driven by global e-commerce expansion and reaching a market size in the billions. Offline Sales are projected to grow at a more moderate rate of 12%, with a market value in the billions.
- Types: Segmentation includes Handheld Smart Imaging Devices, Non-Handheld Smart Imaging Devices, and Smart Imaging Device Platforms. Handheld devices are anticipated to maintain a substantial market share, with a CAGR of 14% and a market value in the billions. Non-Handheld devices are poised for rapid expansion, with an estimated CAGR of 20% and a market value also reaching billions. The Smart Imaging Device Platform segment is an emerging area with high growth potential.
Key Drivers of Smart Imaging Devices Growth
The growth of the Smart Imaging Devices market is propelled by several interconnected factors. Technological advancements, particularly in AI, sensor technology, and miniaturization, are enabling more sophisticated and user-friendly devices. The increasing demand for high-quality visual content across diverse sectors, from social media to industrial inspection, is a primary economic driver. Furthermore, supportive government initiatives promoting digital transformation and smart technologies, coupled with rising disposable incomes in key emerging economies, contribute significantly to market expansion.
Challenges in the Smart Imaging Devices Sector
Despite strong growth, the Smart Imaging Devices sector faces several challenges. Intense competition and the rapid pace of technological obsolescence necessitate continuous R&D investment, impacting profit margins for some players. Regulatory hurdles, particularly concerning data privacy and the usage of advanced imaging technologies like drones in certain regions, can hinder market access. Supply chain disruptions, as witnessed in recent years, can impact production volumes and lead times, potentially affecting market availability and pricing.
Emerging Opportunities in Smart Imaging Devices
Emerging opportunities lie in the expansion of AI-powered features for enhanced automation and data analysis, catering to industries requiring advanced visual intelligence. The growing demand for specialized devices in sectors like healthcare (e.g., medical imaging), agriculture (e.g., precision farming), and environmental monitoring presents significant untapped potential. The development of integrated ecosystems and cloud-based platforms for seamless data management and collaboration also offers substantial growth avenues.
Leading Players in the Smart Imaging Devices Market
- DJI
- Autel Robotics
- HOVERAir
- GoPro
- Ricoh
- Insta360
- AKASO
- SJCAM
- EKEN
- Apeman
- Zero Zero Robotics
- S. Bower
Key Developments in Smart Imaging Devices Industry
- 2023/Q4: Launch of advanced AI-powered object tracking algorithms in flagship drones, enhancing professional cinematography capabilities.
- 2024/Q1: Introduction of compact, ultra-high-resolution action cameras with extended battery life, targeting outdoor enthusiasts.
- 2024/Q2: Strategic partnership formed between a leading drone manufacturer and a cloud analytics provider to offer integrated aerial data solutions for industrial clients.
- 2024/Q3: Major investment in R&D for next-generation sensor technology aimed at improving low-light performance and image stabilization in handheld devices.
- 2025/Q1: Release of a new line of smart imaging devices with enhanced cybersecurity features to address growing data privacy concerns.
Strategic Outlook for Smart Imaging Devices Market
The strategic outlook for the Smart Imaging Devices market remains highly optimistic, driven by ongoing technological innovation and expanding application landscapes. Future growth will be catalyzed by the integration of AI for greater automation, the development of specialized devices for emerging industries, and the creation of comprehensive data management platforms. Companies focusing on user experience, sustainable manufacturing, and robust cybersecurity will be well-positioned to capitalize on evolving consumer and enterprise demands, ensuring continued market expansion and value creation in the billions.
Smart Imaging Devices Segmentation
-
1. Application
- 1.1. Online Sales
- 1.2. Offline Sales
-
2. Types
- 2.1. Handheld Smart Imaging Device
- 2.2. Non-Handheld Smart Imaging Device
- 2.3. Smart Imaging Device Platform
Smart Imaging Devices Segmentation By Geography
-
1. North America
- 1.1. United States
- 1.2. Canada
- 1.3. Mexico
-
2. South America
- 2.1. Brazil
- 2.2. Argentina
- 2.3. Rest of South America
-
3. Europe
- 3.1. United Kingdom
- 3.2. Germany
- 3.3. France
- 3.4. Italy
- 3.5. Spain
- 3.6. Russia
- 3.7. Benelux
- 3.8. Nordics
- 3.9. Rest of Europe
-
4. Middle East & Africa
- 4.1. Turkey
- 4.2. Israel
- 4.3. GCC
- 4.4. North Africa
- 4.5. South Africa
- 4.6. Rest of Middle East & Africa
-
5. Asia Pacific
- 5.1. China
- 5.2. India
- 5.3. Japan
- 5.4. South Korea
- 5.5. ASEAN
- 5.6. Oceania
- 5.7. Rest of Asia Pacific
Smart Imaging Devices REPORT HIGHLIGHTS
| Aspects | Details |
|---|---|
| Study Period | 2019-2033 |
| Base Year | 2024 |
| Estimated Year | 2025 |
| Forecast Period | 2025-2033 |
| Historical Period | 2019-2024 |
| Growth Rate | CAGR of 6.7% from 2019-2033 |
| Segmentation |
|
Table of Contents
- 1. Introduction
- 1.1. Research Scope
- 1.2. Market Segmentation
- 1.3. Research Methodology
- 1.4. Definitions and Assumptions
- 2. Executive Summary
- 2.1. Introduction
- 3. Market Dynamics
- 3.1. Introduction
- 3.2. Market Drivers
- 3.3. Market Restrains
- 3.4. Market Trends
- 4. Market Factor Analysis
- 4.1. Porters Five Forces
- 4.2. Supply/Value Chain
- 4.3. PESTEL analysis
- 4.4. Market Entropy
- 4.5. Patent/Trademark Analysis
- 5. Global Smart Imaging Devices Analysis, Insights and Forecast, 2019-2031
- 5.1. Market Analysis, Insights and Forecast - by Application
- 5.1.1. Online Sales
- 5.1.2. Offline Sales
- 5.2. Market Analysis, Insights and Forecast - by Types
- 5.2.1. Handheld Smart Imaging Device
- 5.2.2. Non-Handheld Smart Imaging Device
- 5.2.3. Smart Imaging Device Platform
- 5.3. Market Analysis, Insights and Forecast - by Region
- 5.3.1. North America
- 5.3.2. South America
- 5.3.3. Europe
- 5.3.4. Middle East & Africa
- 5.3.5. Asia Pacific
- 5.1. Market Analysis, Insights and Forecast - by Application
- 6. North America Smart Imaging Devices Analysis, Insights and Forecast, 2019-2031
- 6.1. Market Analysis, Insights and Forecast - by Application
- 6.1.1. Online Sales
- 6.1.2. Offline Sales
- 6.2. Market Analysis, Insights and Forecast - by Types
- 6.2.1. Handheld Smart Imaging Device
- 6.2.2. Non-Handheld Smart Imaging Device
- 6.2.3. Smart Imaging Device Platform
- 6.1. Market Analysis, Insights and Forecast - by Application
- 7. South America Smart Imaging Devices Analysis, Insights and Forecast, 2019-2031
- 7.1. Market Analysis, Insights and Forecast - by Application
- 7.1.1. Online Sales
- 7.1.2. Offline Sales
- 7.2. Market Analysis, Insights and Forecast - by Types
- 7.2.1. Handheld Smart Imaging Device
- 7.2.2. Non-Handheld Smart Imaging Device
- 7.2.3. Smart Imaging Device Platform
- 7.1. Market Analysis, Insights and Forecast - by Application
- 8. Europe Smart Imaging Devices Analysis, Insights and Forecast, 2019-2031
- 8.1. Market Analysis, Insights and Forecast - by Application
- 8.1.1. Online Sales
- 8.1.2. Offline Sales
- 8.2. Market Analysis, Insights and Forecast - by Types
- 8.2.1. Handheld Smart Imaging Device
- 8.2.2. Non-Handheld Smart Imaging Device
- 8.2.3. Smart Imaging Device Platform
- 8.1. Market Analysis, Insights and Forecast - by Application
- 9. Middle East & Africa Smart Imaging Devices Analysis, Insights and Forecast, 2019-2031
- 9.1. Market Analysis, Insights and Forecast - by Application
- 9.1.1. Online Sales
- 9.1.2. Offline Sales
- 9.2. Market Analysis, Insights and Forecast - by Types
- 9.2.1. Handheld Smart Imaging Device
- 9.2.2. Non-Handheld Smart Imaging Device
- 9.2.3. Smart Imaging Device Platform
- 9.1. Market Analysis, Insights and Forecast - by Application
- 10. Asia Pacific Smart Imaging Devices Analysis, Insights and Forecast, 2019-2031
- 10.1. Market Analysis, Insights and Forecast - by Application
- 10.1.1. Online Sales
- 10.1.2. Offline Sales
- 10.2. Market Analysis, Insights and Forecast - by Types
- 10.2.1. Handheld Smart Imaging Device
- 10.2.2. Non-Handheld Smart Imaging Device
- 10.2.3. Smart Imaging Device Platform
- 10.1. Market Analysis, Insights and Forecast - by Application
- 11. Competitive Analysis
- 11.1. Global Market Share Analysis 2024
- 11.2. Company Profiles
- 11.2.1 Autel Robotics
- 11.2.1.1. Overview
- 11.2.1.2. Products
- 11.2.1.3. SWOT Analysis
- 11.2.1.4. Recent Developments
- 11.2.1.5. Financials (Based on Availability)
- 11.2.2 HOVERAir
- 11.2.2.1. Overview
- 11.2.2.2. Products
- 11.2.2.3. SWOT Analysis
- 11.2.2.4. Recent Developments
- 11.2.2.5. Financials (Based on Availability)
- 11.2.3 GoPro
- 11.2.3.1. Overview
- 11.2.3.2. Products
- 11.2.3.3. SWOT Analysis
- 11.2.3.4. Recent Developments
- 11.2.3.5. Financials (Based on Availability)
- 11.2.4 Ricoh
- 11.2.4.1. Overview
- 11.2.4.2. Products
- 11.2.4.3. SWOT Analysis
- 11.2.4.4. Recent Developments
- 11.2.4.5. Financials (Based on Availability)
- 11.2.5 Insta360
- 11.2.5.1. Overview
- 11.2.5.2. Products
- 11.2.5.3. SWOT Analysis
- 11.2.5.4. Recent Developments
- 11.2.5.5. Financials (Based on Availability)
- 11.2.6 DJI
- 11.2.6.1. Overview
- 11.2.6.2. Products
- 11.2.6.3. SWOT Analysis
- 11.2.6.4. Recent Developments
- 11.2.6.5. Financials (Based on Availability)
- 11.2.7 AKASO
- 11.2.7.1. Overview
- 11.2.7.2. Products
- 11.2.7.3. SWOT Analysis
- 11.2.7.4. Recent Developments
- 11.2.7.5. Financials (Based on Availability)
- 11.2.8 SJCAM
- 11.2.8.1. Overview
- 11.2.8.2. Products
- 11.2.8.3. SWOT Analysis
- 11.2.8.4. Recent Developments
- 11.2.8.5. Financials (Based on Availability)
- 11.2.9 EKEN
- 11.2.9.1. Overview
- 11.2.9.2. Products
- 11.2.9.3. SWOT Analysis
- 11.2.9.4. Recent Developments
- 11.2.9.5. Financials (Based on Availability)
- 11.2.10 Apeman
- 11.2.10.1. Overview
- 11.2.10.2. Products
- 11.2.10.3. SWOT Analysis
- 11.2.10.4. Recent Developments
- 11.2.10.5. Financials (Based on Availability)
- 11.2.11 Zero Zero Robotics
- 11.2.11.1. Overview
- 11.2.11.2. Products
- 11.2.11.3. SWOT Analysis
- 11.2.11.4. Recent Developments
- 11.2.11.5. Financials (Based on Availability)
- 11.2.12 S. Bower
- 11.2.12.1. Overview
- 11.2.12.2. Products
- 11.2.12.3. SWOT Analysis
- 11.2.12.4. Recent Developments
- 11.2.12.5. Financials (Based on Availability)
- 11.2.1 Autel Robotics
List of Figures
- Figure 1: Global Smart Imaging Devices Revenue Breakdown (million, %) by Region 2024 & 2032
- Figure 2: Global Smart Imaging Devices Volume Breakdown (K, %) by Region 2024 & 2032
- Figure 3: North America Smart Imaging Devices Revenue (million), by Application 2024 & 2032
- Figure 4: North America Smart Imaging Devices Volume (K), by Application 2024 & 2032
- Figure 5: North America Smart Imaging Devices Revenue Share (%), by Application 2024 & 2032
- Figure 6: North America Smart Imaging Devices Volume Share (%), by Application 2024 & 2032
- Figure 7: North America Smart Imaging Devices Revenue (million), by Types 2024 & 2032
- Figure 8: North America Smart Imaging Devices Volume (K), by Types 2024 & 2032
- Figure 9: North America Smart Imaging Devices Revenue Share (%), by Types 2024 & 2032
- Figure 10: North America Smart Imaging Devices Volume Share (%), by Types 2024 & 2032
- Figure 11: North America Smart Imaging Devices Revenue (million), by Country 2024 & 2032
- Figure 12: North America Smart Imaging Devices Volume (K), by Country 2024 & 2032
- Figure 13: North America Smart Imaging Devices Revenue Share (%), by Country 2024 & 2032
- Figure 14: North America Smart Imaging Devices Volume Share (%), by Country 2024 & 2032
- Figure 15: South America Smart Imaging Devices Revenue (million), by Application 2024 & 2032
- Figure 16: South America Smart Imaging Devices Volume (K), by Application 2024 & 2032
- Figure 17: South America Smart Imaging Devices Revenue Share (%), by Application 2024 & 2032
- Figure 18: South America Smart Imaging Devices Volume Share (%), by Application 2024 & 2032
- Figure 19: South America Smart Imaging Devices Revenue (million), by Types 2024 & 2032
- Figure 20: South America Smart Imaging Devices Volume (K), by Types 2024 & 2032
- Figure 21: South America Smart Imaging Devices Revenue Share (%), by Types 2024 & 2032
- Figure 22: South America Smart Imaging Devices Volume Share (%), by Types 2024 & 2032
- Figure 23: South America Smart Imaging Devices Revenue (million), by Country 2024 & 2032
- Figure 24: South America Smart Imaging Devices Volume (K), by Country 2024 & 2032
- Figure 25: South America Smart Imaging Devices Revenue Share (%), by Country 2024 & 2032
- Figure 26: South America Smart Imaging Devices Volume Share (%), by Country 2024 & 2032
- Figure 27: Europe Smart Imaging Devices Revenue (million), by Application 2024 & 2032
- Figure 28: Europe Smart Imaging Devices Volume (K), by Application 2024 & 2032
- Figure 29: Europe Smart Imaging Devices Revenue Share (%), by Application 2024 & 2032
- Figure 30: Europe Smart Imaging Devices Volume Share (%), by Application 2024 & 2032
- Figure 31: Europe Smart Imaging Devices Revenue (million), by Types 2024 & 2032
- Figure 32: Europe Smart Imaging Devices Volume (K), by Types 2024 & 2032
- Figure 33: Europe Smart Imaging Devices Revenue Share (%), by Types 2024 & 2032
- Figure 34: Europe Smart Imaging Devices Volume Share (%), by Types 2024 & 2032
- Figure 35: Europe Smart Imaging Devices Revenue (million), by Country 2024 & 2032
- Figure 36: Europe Smart Imaging Devices Volume (K), by Country 2024 & 2032
- Figure 37: Europe Smart Imaging Devices Revenue Share (%), by Country 2024 & 2032
- Figure 38: Europe Smart Imaging Devices Volume Share (%), by Country 2024 & 2032
- Figure 39: Middle East & Africa Smart Imaging Devices Revenue (million), by Application 2024 & 2032
- Figure 40: Middle East & Africa Smart Imaging Devices Volume (K), by Application 2024 & 2032
- Figure 41: Middle East & Africa Smart Imaging Devices Revenue Share (%), by Application 2024 & 2032
- Figure 42: Middle East & Africa Smart Imaging Devices Volume Share (%), by Application 2024 & 2032
- Figure 43: Middle East & Africa Smart Imaging Devices Revenue (million), by Types 2024 & 2032
- Figure 44: Middle East & Africa Smart Imaging Devices Volume (K), by Types 2024 & 2032
- Figure 45: Middle East & Africa Smart Imaging Devices Revenue Share (%), by Types 2024 & 2032
- Figure 46: Middle East & Africa Smart Imaging Devices Volume Share (%), by Types 2024 & 2032
- Figure 47: Middle East & Africa Smart Imaging Devices Revenue (million), by Country 2024 & 2032
- Figure 48: Middle East & Africa Smart Imaging Devices Volume (K), by Country 2024 & 2032
- Figure 49: Middle East & Africa Smart Imaging Devices Revenue Share (%), by Country 2024 & 2032
- Figure 50: Middle East & Africa Smart Imaging Devices Volume Share (%), by Country 2024 & 2032
- Figure 51: Asia Pacific Smart Imaging Devices Revenue (million), by Application 2024 & 2032
- Figure 52: Asia Pacific Smart Imaging Devices Volume (K), by Application 2024 & 2032
- Figure 53: Asia Pacific Smart Imaging Devices Revenue Share (%), by Application 2024 & 2032
- Figure 54: Asia Pacific Smart Imaging Devices Volume Share (%), by Application 2024 & 2032
- Figure 55: Asia Pacific Smart Imaging Devices Revenue (million), by Types 2024 & 2032
- Figure 56: Asia Pacific Smart Imaging Devices Volume (K), by Types 2024 & 2032
- Figure 57: Asia Pacific Smart Imaging Devices Revenue Share (%), by Types 2024 & 2032
- Figure 58: Asia Pacific Smart Imaging Devices Volume Share (%), by Types 2024 & 2032
- Figure 59: Asia Pacific Smart Imaging Devices Revenue (million), by Country 2024 & 2032
- Figure 60: Asia Pacific Smart Imaging Devices Volume (K), by Country 2024 & 2032
- Figure 61: Asia Pacific Smart Imaging Devices Revenue Share (%), by Country 2024 & 2032
- Figure 62: Asia Pacific Smart Imaging Devices Volume Share (%), by Country 2024 & 2032
List of Tables
- Table 1: Global Smart Imaging Devices Revenue million Forecast, by Region 2019 & 2032
- Table 2: Global Smart Imaging Devices Volume K Forecast, by Region 2019 & 2032
- Table 3: Global Smart Imaging Devices Revenue million Forecast, by Application 2019 & 2032
- Table 4: Global Smart Imaging Devices Volume K Forecast, by Application 2019 & 2032
- Table 5: Global Smart Imaging Devices Revenue million Forecast, by Types 2019 & 2032
- Table 6: Global Smart Imaging Devices Volume K Forecast, by Types 2019 & 2032
- Table 7: Global Smart Imaging Devices Revenue million Forecast, by Region 2019 & 2032
- Table 8: Global Smart Imaging Devices Volume K Forecast, by Region 2019 & 2032
- Table 9: Global Smart Imaging Devices Revenue million Forecast, by Application 2019 & 2032
- Table 10: Global Smart Imaging Devices Volume K Forecast, by Application 2019 & 2032
- Table 11: Global Smart Imaging Devices Revenue million Forecast, by Types 2019 & 2032
- Table 12: Global Smart Imaging Devices Volume K Forecast, by Types 2019 & 2032
- Table 13: Global Smart Imaging Devices Revenue million Forecast, by Country 2019 & 2032
- Table 14: Global Smart Imaging Devices Volume K Forecast, by Country 2019 & 2032
- Table 15: United States Smart Imaging Devices Revenue (million) Forecast, by Application 2019 & 2032
- Table 16: United States Smart Imaging Devices Volume (K) Forecast, by Application 2019 & 2032
- Table 17: Canada Smart Imaging Devices Revenue (million) Forecast, by Application 2019 & 2032
- Table 18: Canada Smart Imaging Devices Volume (K) Forecast, by Application 2019 & 2032
- Table 19: Mexico Smart Imaging Devices Revenue (million) Forecast, by Application 2019 & 2032
- Table 20: Mexico Smart Imaging Devices Volume (K) Forecast, by Application 2019 & 2032
- Table 21: Global Smart Imaging Devices Revenue million Forecast, by Application 2019 & 2032
- Table 22: Global Smart Imaging Devices Volume K Forecast, by Application 2019 & 2032
- Table 23: Global Smart Imaging Devices Revenue million Forecast, by Types 2019 & 2032
- Table 24: Global Smart Imaging Devices Volume K Forecast, by Types 2019 & 2032
- Table 25: Global Smart Imaging Devices Revenue million Forecast, by Country 2019 & 2032
- Table 26: Global Smart Imaging Devices Volume K Forecast, by Country 2019 & 2032
- Table 27: Brazil Smart Imaging Devices Revenue (million) Forecast, by Application 2019 & 2032
- Table 28: Brazil Smart Imaging Devices Volume (K) Forecast, by Application 2019 & 2032
- Table 29: Argentina Smart Imaging Devices Revenue (million) Forecast, by Application 2019 & 2032
- Table 30: Argentina Smart Imaging Devices Volume (K) Forecast, by Application 2019 & 2032
- Table 31: Rest of South America Smart Imaging Devices Revenue (million) Forecast, by Application 2019 & 2032
- Table 32: Rest of South America Smart Imaging Devices Volume (K) Forecast, by Application 2019 & 2032
- Table 33: Global Smart Imaging Devices Revenue million Forecast, by Application 2019 & 2032
- Table 34: Global Smart Imaging Devices Volume K Forecast, by Application 2019 & 2032
- Table 35: Global Smart Imaging Devices Revenue million Forecast, by Types 2019 & 2032
- Table 36: Global Smart Imaging Devices Volume K Forecast, by Types 2019 & 2032
- Table 37: Global Smart Imaging Devices Revenue million Forecast, by Country 2019 & 2032
- Table 38: Global Smart Imaging Devices Volume K Forecast, by Country 2019 & 2032
- Table 39: United Kingdom Smart Imaging Devices Revenue (million) Forecast, by Application 2019 & 2032
- Table 40: United Kingdom Smart Imaging Devices Volume (K) Forecast, by Application 2019 & 2032
- Table 41: Germany Smart Imaging Devices Revenue (million) Forecast, by Application 2019 & 2032
- Table 42: Germany Smart Imaging Devices Volume (K) Forecast, by Application 2019 & 2032
- Table 43: France Smart Imaging Devices Revenue (million) Forecast, by Application 2019 & 2032
- Table 44: France Smart Imaging Devices Volume (K) Forecast, by Application 2019 & 2032
- Table 45: Italy Smart Imaging Devices Revenue (million) Forecast, by Application 2019 & 2032
- Table 46: Italy Smart Imaging Devices Volume (K) Forecast, by Application 2019 & 2032
- Table 47: Spain Smart Imaging Devices Revenue (million) Forecast, by Application 2019 & 2032
- Table 48: Spain Smart Imaging Devices Volume (K) Forecast, by Application 2019 & 2032
- Table 49: Russia Smart Imaging Devices Revenue (million) Forecast, by Application 2019 & 2032
- Table 50: Russia Smart Imaging Devices Volume (K) Forecast, by Application 2019 & 2032
- Table 51: Benelux Smart Imaging Devices Revenue (million) Forecast, by Application 2019 & 2032
- Table 52: Benelux Smart Imaging Devices Volume (K) Forecast, by Application 2019 & 2032
- Table 53: Nordics Smart Imaging Devices Revenue (million) Forecast, by Application 2019 & 2032
- Table 54: Nordics Smart Imaging Devices Volume (K) Forecast, by Application 2019 & 2032
- Table 55: Rest of Europe Smart Imaging Devices Revenue (million) Forecast, by Application 2019 & 2032
- Table 56: Rest of Europe Smart Imaging Devices Volume (K) Forecast, by Application 2019 & 2032
- Table 57: Global Smart Imaging Devices Revenue million Forecast, by Application 2019 & 2032
- Table 58: Global Smart Imaging Devices Volume K Forecast, by Application 2019 & 2032
- Table 59: Global Smart Imaging Devices Revenue million Forecast, by Types 2019 & 2032
- Table 60: Global Smart Imaging Devices Volume K Forecast, by Types 2019 & 2032
- Table 61: Global Smart Imaging Devices Revenue million Forecast, by Country 2019 & 2032
- Table 62: Global Smart Imaging Devices Volume K Forecast, by Country 2019 & 2032
- Table 63: Turkey Smart Imaging Devices Revenue (million) Forecast, by Application 2019 & 2032
- Table 64: Turkey Smart Imaging Devices Volume (K) Forecast, by Application 2019 & 2032
- Table 65: Israel Smart Imaging Devices Revenue (million) Forecast, by Application 2019 & 2032
- Table 66: Israel Smart Imaging Devices Volume (K) Forecast, by Application 2019 & 2032
- Table 67: GCC Smart Imaging Devices Revenue (million) Forecast, by Application 2019 & 2032
- Table 68: GCC Smart Imaging Devices Volume (K) Forecast, by Application 2019 & 2032
- Table 69: North Africa Smart Imaging Devices Revenue (million) Forecast, by Application 2019 & 2032
- Table 70: North Africa Smart Imaging Devices Volume (K) Forecast, by Application 2019 & 2032
- Table 71: South Africa Smart Imaging Devices Revenue (million) Forecast, by Application 2019 & 2032
- Table 72: South Africa Smart Imaging Devices Volume (K) Forecast, by Application 2019 & 2032
- Table 73: Rest of Middle East & Africa Smart Imaging Devices Revenue (million) Forecast, by Application 2019 & 2032
- Table 74: Rest of Middle East & Africa Smart Imaging Devices Volume (K) Forecast, by Application 2019 & 2032
- Table 75: Global Smart Imaging Devices Revenue million Forecast, by Application 2019 & 2032
- Table 76: Global Smart Imaging Devices Volume K Forecast, by Application 2019 & 2032
- Table 77: Global Smart Imaging Devices Revenue million Forecast, by Types 2019 & 2032
- Table 78: Global Smart Imaging Devices Volume K Forecast, by Types 2019 & 2032
- Table 79: Global Smart Imaging Devices Revenue million Forecast, by Country 2019 & 2032
- Table 80: Global Smart Imaging Devices Volume K Forecast, by Country 2019 & 2032
- Table 81: China Smart Imaging Devices Revenue (million) Forecast, by Application 2019 & 2032
- Table 82: China Smart Imaging Devices Volume (K) Forecast, by Application 2019 & 2032
- Table 83: India Smart Imaging Devices Revenue (million) Forecast, by Application 2019 & 2032
- Table 84: India Smart Imaging Devices Volume (K) Forecast, by Application 2019 & 2032
- Table 85: Japan Smart Imaging Devices Revenue (million) Forecast, by Application 2019 & 2032
- Table 86: Japan Smart Imaging Devices Volume (K) Forecast, by Application 2019 & 2032
- Table 87: South Korea Smart Imaging Devices Revenue (million) Forecast, by Application 2019 & 2032
- Table 88: South Korea Smart Imaging Devices Volume (K) Forecast, by Application 2019 & 2032
- Table 89: ASEAN Smart Imaging Devices Revenue (million) Forecast, by Application 2019 & 2032
- Table 90: ASEAN Smart Imaging Devices Volume (K) Forecast, by Application 2019 & 2032
- Table 91: Oceania Smart Imaging Devices Revenue (million) Forecast, by Application 2019 & 2032
- Table 92: Oceania Smart Imaging Devices Volume (K) Forecast, by Application 2019 & 2032
- Table 93: Rest of Asia Pacific Smart Imaging Devices Revenue (million) Forecast, by Application 2019 & 2032
- Table 94: Rest of Asia Pacific Smart Imaging Devices Volume (K) Forecast, by Application 2019 & 2032
Frequently Asked Questions
1. What is the projected Compound Annual Growth Rate (CAGR) of the Smart Imaging Devices?
The projected CAGR is approximately 6.7%.
2. Which companies are prominent players in the Smart Imaging Devices?
Key companies in the market include Autel Robotics, HOVERAir, GoPro, Ricoh, Insta360, DJI, AKASO, SJCAM, EKEN, Apeman, Zero Zero Robotics, S. Bower.
3. What are the main segments of the Smart Imaging Devices?
The market segments include Application, Types.
4. Can you provide details about the market size?
The market size is estimated to be USD 8819 million as of 2022.
5. What are some drivers contributing to market growth?
N/A
6. What are the notable trends driving market growth?
N/A
7. Are there any restraints impacting market growth?
N/A
8. Can you provide examples of recent developments in the market?
N/A
9. What pricing options are available for accessing the report?
Pricing options include single-user, multi-user, and enterprise licenses priced at USD 3950.00, USD 5925.00, and USD 7900.00 respectively.
10. Is the market size provided in terms of value or volume?
The market size is provided in terms of value, measured in million and volume, measured in K.
11. Are there any specific market keywords associated with the report?
Yes, the market keyword associated with the report is "Smart Imaging Devices," which aids in identifying and referencing the specific market segment covered.
12. How do I determine which pricing option suits my needs best?
The pricing options vary based on user requirements and access needs. Individual users may opt for single-user licenses, while businesses requiring broader access may choose multi-user or enterprise licenses for cost-effective access to the report.
13. Are there any additional resources or data provided in the Smart Imaging Devices report?
While the report offers comprehensive insights, it's advisable to review the specific contents or supplementary materials provided to ascertain if additional resources or data are available.
14. How can I stay updated on further developments or reports in the Smart Imaging Devices?
To stay informed about further developments, trends, and reports in the Smart Imaging Devices, consider subscribing to industry newsletters, following relevant companies and organizations, or regularly checking reputable industry news sources and publications.
Methodology
Step 1 - Identification of Relevant Samples Size from Population Database


Step 2 - Approaches for Defining Global Market Size (Value, Volume* & Price*)

Note*: In applicable scenarios
Step 3 - Data Sources
Primary Research
- Web Analytics
- Survey Reports
- Research Institute
- Latest Research Reports
- Opinion Leaders
Secondary Research
- Annual Reports
- White Paper
- Latest Press Release
- Industry Association
- Paid Database
- Investor Presentations

Step 4 - Data Triangulation
Involves using different sources of information in order to increase the validity of a study
These sources are likely to be stakeholders in a program - participants, other researchers, program staff, other community members, and so on.
Then we put all data in single framework & apply various statistical tools to find out the dynamic on the market.
During the analysis stage, feedback from the stakeholder groups would be compared to determine areas of agreement as well as areas of divergence


