
Key Insights
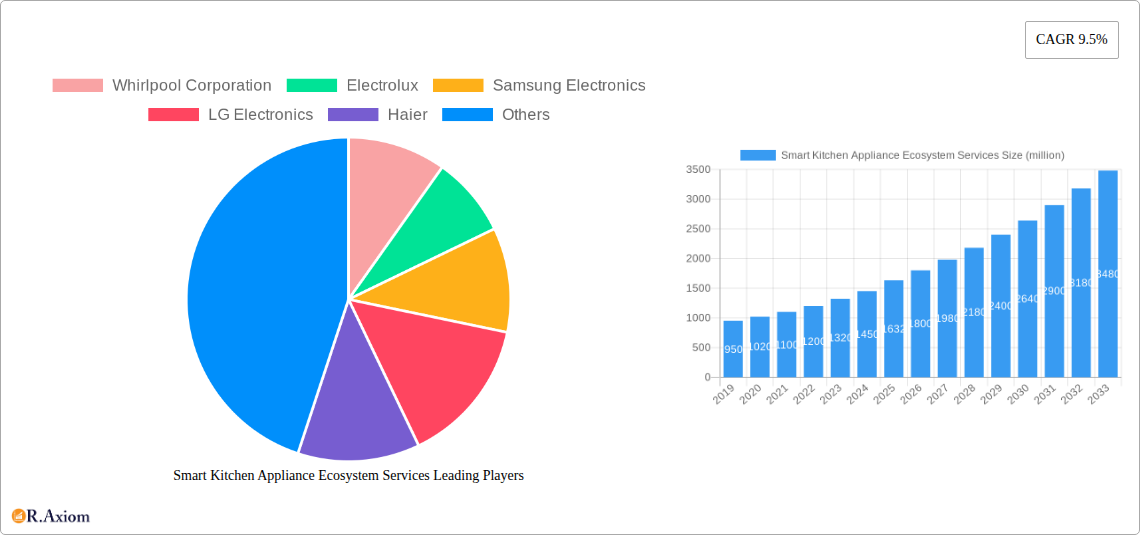
The Smart Kitchen Appliance Ecosystem Services market is poised for significant expansion, projected to reach approximately $1632 million by 2025, with a robust Compound Annual Growth Rate (CAGR) of 9.5% anticipated through 2033. This remarkable growth is fueled by an evolving consumer demand for convenience, enhanced culinary experiences, and greater control over home environments. The integration of artificial intelligence, IoT connectivity, and sophisticated user interfaces is transforming traditional kitchen appliances into intelligent hubs. Key drivers include the increasing adoption of smart home technologies, a rising disposable income enabling investment in premium appliances, and a growing awareness of energy efficiency and sustainability features offered by smart devices. Furthermore, the convenience of remote monitoring and control, recipe integration, and personalized cooking recommendations are major attractions for modern households. The market's trajectory is also shaped by ongoing innovation, with manufacturers continually introducing new functionalities and seamless integration capabilities across various appliance types, including refrigerators, cookware, and range hoods, designed to cater to diverse household applications.
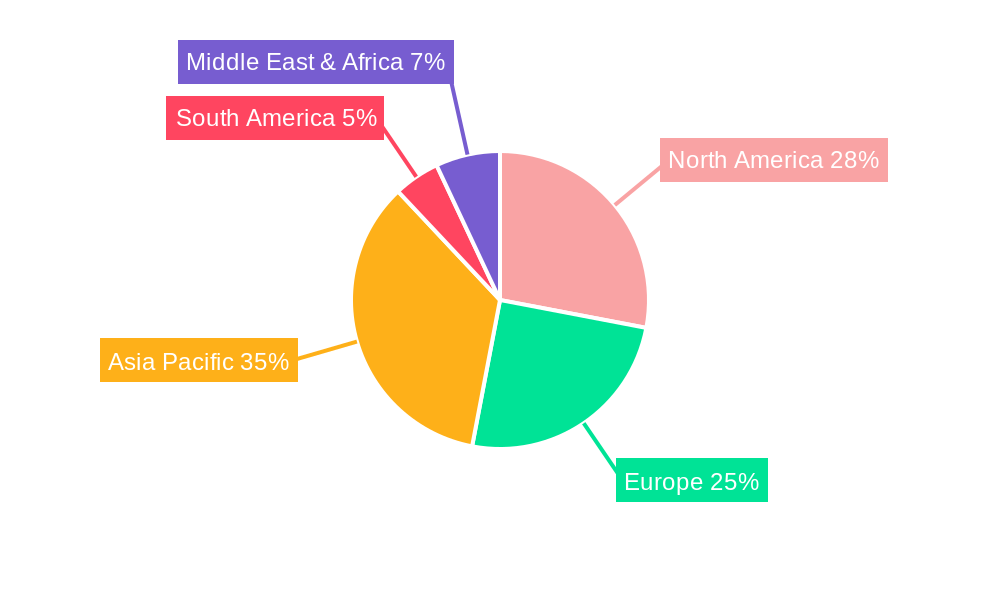
The market is segmented by application into Family, Hotel, and Others, with the Family segment likely dominating due to increasing nuclear households and a desire for efficient home management. By type, the market encompasses Refrigerator, Cookware, Range Hood, and Others, each contributing to the overall ecosystem. Leading companies such as Whirlpool Corporation, Electrolux, Samsung Electronics, LG Electronics, and Haier are at the forefront of this innovation, investing heavily in research and development to capture market share. Geographical expansion is also a critical aspect, with Asia Pacific, particularly China and India, expected to be a significant growth engine due to rapid urbanization and a burgeoning middle class. North America and Europe, with their established smart home infrastructure and high consumer adoption rates, will continue to be major markets. Restraints, such as the initial high cost of smart appliances and potential concerns regarding data privacy and cybersecurity, are being addressed through technological advancements and evolving consumer trust. The market's future growth will be intrinsically linked to the development of a more interconnected and intuitive smart kitchen experience.
Smart Kitchen Appliance Ecosystem Services Market Concentration & Innovation
The global smart kitchen appliance ecosystem services market is characterized by a moderate to high level of concentration, driven by the significant R&D investments and brand recognition of leading players. Companies such as Whirlpool Corporation, Samsung Electronics, LG Electronics, and Haier are at the forefront, investing millions in developing integrated solutions that go beyond individual appliance functionality. Innovation is a critical differentiator, with a substantial portion of revenue, estimated at over $2,000 million annually, reinvested into research and development. This focus is particularly evident in areas like AI-powered recipe generation, predictive maintenance, and seamless multi-device connectivity.
Regulatory frameworks are evolving to accommodate the increasing interconnectivity and data privacy concerns surrounding smart home devices. While currently not a significant barrier, proactive engagement with bodies governing data security and consumer protection, estimated to cost millions in compliance, is crucial for sustained growth. Product substitutes, while present in the form of conventional appliances, are increasingly being challenged by the convenience and enhanced user experience offered by smart ecosystems. The long-term viability of non-smart alternatives is diminishing, with a projected decline of over 15% in market share by 2033. End-user trends are overwhelmingly in favor of convenience, health, and sustainability. Consumers are increasingly willing to invest in smart appliances that offer time-saving features, personalized cooking experiences, and energy efficiency, with a willingness-to-pay premium estimated at an average of 25%. Mergers and acquisitions (M&A) activities are moderate but strategic, with deal values in the hundreds of millions of dollars, aimed at acquiring innovative startups or expanding technological portfolios. For instance, acquisitions in the AI and IoT software space are particularly sought after.
Smart Kitchen Appliance Ecosystem Services Industry Trends & Insights
The smart kitchen appliance ecosystem services market is experiencing robust growth, projected to expand at a Compound Annual Growth Rate (CAGR) of approximately 18% from 2025 to 2033. This expansion is fueled by a confluence of factors, including rapid technological advancements, increasing consumer disposable incomes, and a growing awareness of the benefits offered by connected home devices. The base year of 2025 sees the market valued at over $50,000 million, with significant potential for future penetration.
Technological disruptions are at the heart of this market's evolution. The integration of Artificial Intelligence (AI) and Machine Learning (ML) is transforming kitchen appliances from mere tools into intelligent assistants. AI-powered refrigerators can now track inventory, suggest recipes based on available ingredients, and even reorder groceries. Smart ovens can adjust cooking times and temperatures autonomously, ensuring perfectly cooked meals every time. The Internet of Things (IoT) acts as the connective tissue, enabling seamless communication between various appliances, smartphones, and cloud platforms. This interconnectedness enhances convenience, allowing users to preheat ovens remotely, monitor cooking progress, and receive alerts on their mobile devices. The rise of voice control, powered by virtual assistants like Alexa and Google Assistant, has further simplified user interaction, making smart kitchens more accessible and intuitive.
Consumer preferences are shifting towards solutions that offer enhanced convenience, personalized experiences, and improved health and wellness outcomes. The demand for appliances that simplify meal preparation, reduce food waste, and promote healthier cooking habits is on the rise. Consumers are also increasingly prioritizing energy efficiency and sustainability, driving the adoption of smart appliances that can optimize energy consumption. The competitive dynamics within the market are intensifying, with established players like Samsung Electronics, LG Electronics, and Whirlpool Corporation investing heavily in R&D and strategic partnerships to maintain their market share. New entrants and specialized startups are also emerging, bringing innovative technologies and niche solutions to the market, thus fostering a dynamic and competitive landscape. The market penetration of smart kitchen appliances, while still in its early stages in some regions, is steadily increasing, with projections indicating a significant jump in adoption rates over the forecast period. This growth is propelled by falling prices of smart components, improved connectivity infrastructure, and a greater understanding of the value proposition by consumers.
Dominant Markets & Segments in Smart Kitchen Appliance Ecosystem Services
The smart kitchen appliance ecosystem services market exhibits distinct dominance across various regions and segments, driven by a combination of economic factors, technological adoption rates, and consumer lifestyle trends. North America currently leads the market, with an estimated market share exceeding 30% in 2025, propelled by high disposable incomes, early adoption of smart home technologies, and a strong presence of major manufacturers. Within North America, the United States accounts for the lion's share due to its well-developed infrastructure and a consumer base highly receptive to technological innovation.
The Family application segment is the most dominant, representing over 60% of the market in 2025. This is attributed to the growing emphasis on convenience and time-saving solutions for busy households, coupled with a desire for enhanced cooking experiences that cater to diverse family needs. Parents are increasingly looking for smart appliances that can assist with meal planning, preparation, and even educational aspects of cooking for children.
In terms of appliance Type, the Refrigerator segment holds a significant leading position, accounting for over 35% of the market in 2025. Smart refrigerators offer advanced features such as inventory management, recipe suggestions based on available food items, and even integration with grocery delivery services, which are highly valued by consumers. The ability to reduce food waste and optimize grocery shopping contributes to its strong market presence.
The Cookware segment, while smaller, is experiencing rapid growth, driven by innovation in smart induction cooktops and connected oven accessories that offer precise temperature control and automated cooking programs. The Range Hood segment is also seeing increased adoption of smart features, including automatic vent adjustments based on cooking intensity and integration with other smart cooking appliances for a cohesive kitchen experience.
Key drivers of this dominance include strong economic policies supporting technological adoption, advanced digital infrastructure facilitating seamless connectivity, and a consumer predisposition towards premium and feature-rich home appliances. Government initiatives promoting smart city development and the adoption of energy-efficient technologies further bolster the growth of this sector. For instance, incentives for energy-saving appliances in the US and Canada contribute significantly to the market's expansion. The projected market size for the smart kitchen appliance ecosystem services in 2025 is over $50,000 million, with North America leading this valuation.
Smart Kitchen Appliance Ecosystem Services Product Developments
Product innovation in the smart kitchen appliance ecosystem services sector is rapidly advancing, focusing on creating a more integrated and intuitive user experience. Key developments include AI-powered refrigerators capable of recognizing food items and suggesting recipes, smart ovens with precise temperature control and automated cooking programs, and connected cookware that communicates cooking parameters to other appliances. These innovations enhance convenience, reduce cooking errors, and enable personalized culinary experiences. Competitive advantages are being derived from seamless connectivity between devices, advanced sensor technologies for real-time monitoring, and intuitive user interfaces accessible via mobile applications and voice assistants. The market is witnessing a surge in feature enhancements like predictive maintenance alerts, energy consumption optimization, and integration with broader smart home ecosystems, offering consumers a holistic approach to kitchen management and culinary endeavors.
Report Scope & Segmentation Analysis
This report meticulously analyzes the global Smart Kitchen Appliance Ecosystem Services market, segmented across key dimensions. The Application segmentation encompasses Family households, Hotel establishments, and Others, with the Family segment projected to lead the market with a significant share. The Type segmentation breaks down the market into Refrigerator, Cookware, Range Hood, and Others. The Refrigerator segment is expected to hold the largest market share due to its extensive feature set and widespread adoption. Each segment is analyzed for its market size, projected growth, and competitive dynamics, offering a comprehensive view of the market landscape. Projections indicate substantial growth across all segments, driven by increasing consumer demand for connected living and technological advancements in the kitchen.
Key Drivers of Smart Kitchen Appliance Ecosystem Services Growth
The growth of the smart kitchen appliance ecosystem services market is propelled by several key drivers. Technologically, the pervasive integration of the Internet of Things (IoT) and advancements in Artificial Intelligence (AI) are enabling more sophisticated functionalities and seamless connectivity between appliances. Economically, rising disposable incomes globally and a growing middle class with a propensity to invest in premium home technologies are significant catalysts. Consumer preferences are shifting towards convenience, efficiency, and personalized experiences, with smart appliances offering solutions that reduce time spent on domestic chores and enhance culinary creativity. Furthermore, increasing awareness of energy efficiency and sustainability is driving demand for smart appliances that optimize power consumption. Government initiatives promoting smart home adoption and the development of digital infrastructure also play a crucial role.
Challenges in the Smart Kitchen Appliance Ecosystem Services Sector
Despite the robust growth, the smart kitchen appliance ecosystem services sector faces several challenges. High initial costs of smart appliances can be a deterrent for a significant portion of the consumer base, despite falling component prices. Data privacy and security concerns remain paramount, as connected appliances collect substantial user data, necessitating robust cybersecurity measures and clear privacy policies. Interoperability issues between appliances from different manufacturers can hinder a truly seamless ecosystem experience, leading to consumer frustration. The need for consistent and reliable internet connectivity is another constraint, particularly in regions with underdeveloped digital infrastructure. Finally, consumer education and awareness regarding the benefits and usage of smart kitchen appliances are still evolving, requiring ongoing marketing and outreach efforts to overcome potential adoption barriers. The estimated cost of addressing these challenges, particularly in cybersecurity and interoperability standards, runs into millions of dollars annually.
Emerging Opportunities in Smart Kitchen Appliance Ecosystem Services
The smart kitchen appliance ecosystem services market presents numerous emerging opportunities. The increasing demand for personalized health and wellness solutions is creating a market for appliances that can assist with dietary tracking, allergen management, and specialized cooking for specific health needs. The growing trend of home cooking and the desire for restaurant-quality meals at home are driving innovation in advanced cooking technologies and interactive recipe guidance. Furthermore, the integration of smart kitchen appliances with broader smart home ecosystems offers opportunities for cross-selling and creating unified home management solutions. The expansion of services beyond hardware, such as subscription-based meal planning or remote diagnostic services, represents a significant revenue stream. Geographically, untapped markets in developing economies, with their burgeoning middle class and increasing adoption of technology, present substantial growth potential.
Leading Players in the Smart Kitchen Appliance Ecosystem Services Market
- Whirlpool Corporation
- Electrolux
- Samsung Electronics
- LG Electronics
- Haier
- BSH
- Miele
- Panasonic
- Robam
- Midea
Key Developments in Smart Kitchen Appliance Ecosystem Services Industry
- 2023 Q4: Samsung Electronics launches its Bespoke AI™-equipped lineup, focusing on personalized user experiences and enhanced connectivity, further strengthening its market position.
- 2024 Q1: LG Electronics announces strategic partnerships to expand its ThinQ AI platform, integrating with more third-party smart home devices and services, aiming for a more comprehensive ecosystem.
- 2024 Q2: Whirlpool Corporation invests in a new AI research facility to accelerate the development of predictive maintenance and adaptive cooking technologies for its appliance range, projecting millions in future R&D expenditure.
- 2024 Q3: Haier showcases its advanced smart kitchen solutions, emphasizing energy efficiency and integration with smart grids, aligning with growing consumer demand for sustainable appliances.
- 2024 Q4: Electrolux unveils new smart cookware with advanced temperature sensing capabilities, further enhancing its premium offerings and competing in the niche high-end segment.
- 2025 Q1: BSH Home Appliances Group announces a roadmap for enhanced interoperability across its brands, aiming to simplify the smart kitchen experience for consumers.
- 2025 Q2: Miele introduces a new generation of connected ovens with enhanced AI features for automated cooking and self-cleaning cycles, targeting the luxury market.
- 2025 Q3: Panasonic expands its smart kitchen appliance offerings with the integration of advanced sensor technology for optimized food preservation and preparation.
- 2025 Q4: Robam focuses on user-friendly smart interfaces and intuitive controls for its smart range hoods and cooktops, aiming to simplify complex cooking processes.
- 2026 Q1: Midea announces significant investments in its smart appliance R&D, focusing on affordable smart kitchen solutions to cater to a broader market segment.
Strategic Outlook for Smart Kitchen Appliance Ecosystem Services Market
The strategic outlook for the smart kitchen appliance ecosystem services market is exceptionally positive, driven by sustained innovation and increasing consumer demand for connected living. Growth catalysts include the ongoing integration of advanced AI and IoT capabilities, leading to more intuitive and personalized user experiences. The expansion of service-based revenue models, such as subscription services for meal planning and maintenance, offers significant future potential. Strategic partnerships between appliance manufacturers, software developers, and service providers will be crucial for building robust and comprehensive ecosystems. Furthermore, the increasing focus on sustainability and energy efficiency will continue to drive the adoption of smart appliances that optimize resource consumption. The market is poised for continued expansion, with a projected increase in total market value to well over $100,000 million by 2033.
Smart Kitchen Appliance Ecosystem Services Segmentation
-
1. Application
- 1.1. Family
- 1.2. Hotel
- 1.3. Others
-
2. Type
- 2.1. Refrigerator
- 2.2. Cookware
- 2.3. Range Hood
- 2.4. Others
Smart Kitchen Appliance Ecosystem Services Segmentation By Geography
-
1. North America
- 1.1. United States
- 1.2. Canada
- 1.3. Mexico
-
2. South America
- 2.1. Brazil
- 2.2. Argentina
- 2.3. Rest of South America
-
3. Europe
- 3.1. United Kingdom
- 3.2. Germany
- 3.3. France
- 3.4. Italy
- 3.5. Spain
- 3.6. Russia
- 3.7. Benelux
- 3.8. Nordics
- 3.9. Rest of Europe
-
4. Middle East & Africa
- 4.1. Turkey
- 4.2. Israel
- 4.3. GCC
- 4.4. North Africa
- 4.5. South Africa
- 4.6. Rest of Middle East & Africa
-
5. Asia Pacific
- 5.1. China
- 5.2. India
- 5.3. Japan
- 5.4. South Korea
- 5.5. ASEAN
- 5.6. Oceania
- 5.7. Rest of Asia Pacific
Smart Kitchen Appliance Ecosystem Services REPORT HIGHLIGHTS
| Aspects | Details |
|---|---|
| Study Period | 2019-2033 |
| Base Year | 2024 |
| Estimated Year | 2025 |
| Forecast Period | 2025-2033 |
| Historical Period | 2019-2024 |
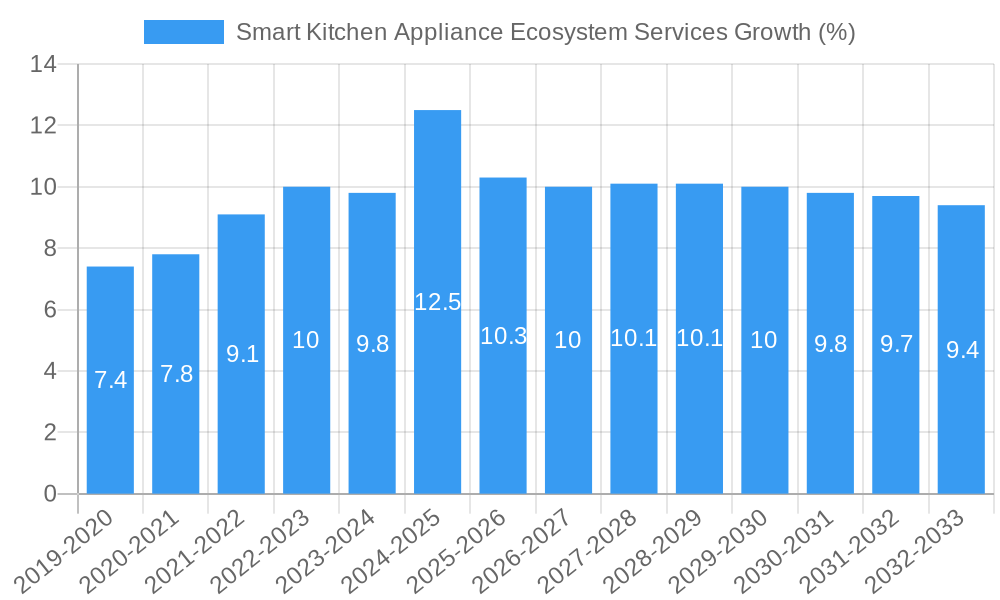
| Growth Rate | CAGR of 9.5% from 2019-2033 |
| Segmentation |
|
Table of Contents
- 1. Introduction
- 1.1. Research Scope
- 1.2. Market Segmentation
- 1.3. Research Methodology
- 1.4. Definitions and Assumptions
- 2. Executive Summary
- 2.1. Introduction
- 3. Market Dynamics
- 3.1. Introduction
- 3.2. Market Drivers
- 3.3. Market Restrains
- 3.4. Market Trends
- 4. Market Factor Analysis
- 4.1. Porters Five Forces
- 4.2. Supply/Value Chain
- 4.3. PESTEL analysis
- 4.4. Market Entropy
- 4.5. Patent/Trademark Analysis
- 5. Global Smart Kitchen Appliance Ecosystem Services Analysis, Insights and Forecast, 2019-2031
- 5.1. Market Analysis, Insights and Forecast - by Application
- 5.1.1. Family
- 5.1.2. Hotel
- 5.1.3. Others
- 5.2. Market Analysis, Insights and Forecast - by Type
- 5.2.1. Refrigerator
- 5.2.2. Cookware
- 5.2.3. Range Hood
- 5.2.4. Others
- 5.3. Market Analysis, Insights and Forecast - by Region
- 5.3.1. North America
- 5.3.2. South America
- 5.3.3. Europe
- 5.3.4. Middle East & Africa
- 5.3.5. Asia Pacific
- 5.1. Market Analysis, Insights and Forecast - by Application
- 6. North America Smart Kitchen Appliance Ecosystem Services Analysis, Insights and Forecast, 2019-2031
- 6.1. Market Analysis, Insights and Forecast - by Application
- 6.1.1. Family
- 6.1.2. Hotel
- 6.1.3. Others
- 6.2. Market Analysis, Insights and Forecast - by Type
- 6.2.1. Refrigerator
- 6.2.2. Cookware
- 6.2.3. Range Hood
- 6.2.4. Others
- 6.1. Market Analysis, Insights and Forecast - by Application
- 7. South America Smart Kitchen Appliance Ecosystem Services Analysis, Insights and Forecast, 2019-2031
- 7.1. Market Analysis, Insights and Forecast - by Application
- 7.1.1. Family
- 7.1.2. Hotel
- 7.1.3. Others
- 7.2. Market Analysis, Insights and Forecast - by Type
- 7.2.1. Refrigerator
- 7.2.2. Cookware
- 7.2.3. Range Hood
- 7.2.4. Others
- 7.1. Market Analysis, Insights and Forecast - by Application
- 8. Europe Smart Kitchen Appliance Ecosystem Services Analysis, Insights and Forecast, 2019-2031
- 8.1. Market Analysis, Insights and Forecast - by Application
- 8.1.1. Family
- 8.1.2. Hotel
- 8.1.3. Others
- 8.2. Market Analysis, Insights and Forecast - by Type
- 8.2.1. Refrigerator
- 8.2.2. Cookware
- 8.2.3. Range Hood
- 8.2.4. Others
- 8.1. Market Analysis, Insights and Forecast - by Application
- 9. Middle East & Africa Smart Kitchen Appliance Ecosystem Services Analysis, Insights and Forecast, 2019-2031
- 9.1. Market Analysis, Insights and Forecast - by Application
- 9.1.1. Family
- 9.1.2. Hotel
- 9.1.3. Others
- 9.2. Market Analysis, Insights and Forecast - by Type
- 9.2.1. Refrigerator
- 9.2.2. Cookware
- 9.2.3. Range Hood
- 9.2.4. Others
- 9.1. Market Analysis, Insights and Forecast - by Application
- 10. Asia Pacific Smart Kitchen Appliance Ecosystem Services Analysis, Insights and Forecast, 2019-2031
- 10.1. Market Analysis, Insights and Forecast - by Application
- 10.1.1. Family
- 10.1.2. Hotel
- 10.1.3. Others
- 10.2. Market Analysis, Insights and Forecast - by Type
- 10.2.1. Refrigerator
- 10.2.2. Cookware
- 10.2.3. Range Hood
- 10.2.4. Others
- 10.1. Market Analysis, Insights and Forecast - by Application
- 11. Competitive Analysis
- 11.1. Global Market Share Analysis 2024
- 11.2. Company Profiles
- 11.2.1 Whirlpool Corporation
- 11.2.1.1. Overview
- 11.2.1.2. Products
- 11.2.1.3. SWOT Analysis
- 11.2.1.4. Recent Developments
- 11.2.1.5. Financials (Based on Availability)
- 11.2.2 Electrolux
- 11.2.2.1. Overview
- 11.2.2.2. Products
- 11.2.2.3. SWOT Analysis
- 11.2.2.4. Recent Developments
- 11.2.2.5. Financials (Based on Availability)
- 11.2.3 Samsung Electronics
- 11.2.3.1. Overview
- 11.2.3.2. Products
- 11.2.3.3. SWOT Analysis
- 11.2.3.4. Recent Developments
- 11.2.3.5. Financials (Based on Availability)
- 11.2.4 LG Electronics
- 11.2.4.1. Overview
- 11.2.4.2. Products
- 11.2.4.3. SWOT Analysis
- 11.2.4.4. Recent Developments
- 11.2.4.5. Financials (Based on Availability)
- 11.2.5 Haier
- 11.2.5.1. Overview
- 11.2.5.2. Products
- 11.2.5.3. SWOT Analysis
- 11.2.5.4. Recent Developments
- 11.2.5.5. Financials (Based on Availability)
- 11.2.6 BSH
- 11.2.6.1. Overview
- 11.2.6.2. Products
- 11.2.6.3. SWOT Analysis
- 11.2.6.4. Recent Developments
- 11.2.6.5. Financials (Based on Availability)
- 11.2.7 Miele
- 11.2.7.1. Overview
- 11.2.7.2. Products
- 11.2.7.3. SWOT Analysis
- 11.2.7.4. Recent Developments
- 11.2.7.5. Financials (Based on Availability)
- 11.2.8 Panasonic
- 11.2.8.1. Overview
- 11.2.8.2. Products
- 11.2.8.3. SWOT Analysis
- 11.2.8.4. Recent Developments
- 11.2.8.5. Financials (Based on Availability)
- 11.2.9 Robam
- 11.2.9.1. Overview
- 11.2.9.2. Products
- 11.2.9.3. SWOT Analysis
- 11.2.9.4. Recent Developments
- 11.2.9.5. Financials (Based on Availability)
- 11.2.10 Midea
- 11.2.10.1. Overview
- 11.2.10.2. Products
- 11.2.10.3. SWOT Analysis
- 11.2.10.4. Recent Developments
- 11.2.10.5. Financials (Based on Availability)
- 11.2.1 Whirlpool Corporation
List of Figures
- Figure 1: Global Smart Kitchen Appliance Ecosystem Services Revenue Breakdown (million, %) by Region 2024 & 2032
- Figure 2: North America Smart Kitchen Appliance Ecosystem Services Revenue (million), by Application 2024 & 2032
- Figure 3: North America Smart Kitchen Appliance Ecosystem Services Revenue Share (%), by Application 2024 & 2032
- Figure 4: North America Smart Kitchen Appliance Ecosystem Services Revenue (million), by Type 2024 & 2032
- Figure 5: North America Smart Kitchen Appliance Ecosystem Services Revenue Share (%), by Type 2024 & 2032
- Figure 6: North America Smart Kitchen Appliance Ecosystem Services Revenue (million), by Country 2024 & 2032
- Figure 7: North America Smart Kitchen Appliance Ecosystem Services Revenue Share (%), by Country 2024 & 2032
- Figure 8: South America Smart Kitchen Appliance Ecosystem Services Revenue (million), by Application 2024 & 2032
- Figure 9: South America Smart Kitchen Appliance Ecosystem Services Revenue Share (%), by Application 2024 & 2032
- Figure 10: South America Smart Kitchen Appliance Ecosystem Services Revenue (million), by Type 2024 & 2032
- Figure 11: South America Smart Kitchen Appliance Ecosystem Services Revenue Share (%), by Type 2024 & 2032
- Figure 12: South America Smart Kitchen Appliance Ecosystem Services Revenue (million), by Country 2024 & 2032
- Figure 13: South America Smart Kitchen Appliance Ecosystem Services Revenue Share (%), by Country 2024 & 2032
- Figure 14: Europe Smart Kitchen Appliance Ecosystem Services Revenue (million), by Application 2024 & 2032
- Figure 15: Europe Smart Kitchen Appliance Ecosystem Services Revenue Share (%), by Application 2024 & 2032
- Figure 16: Europe Smart Kitchen Appliance Ecosystem Services Revenue (million), by Type 2024 & 2032
- Figure 17: Europe Smart Kitchen Appliance Ecosystem Services Revenue Share (%), by Type 2024 & 2032
- Figure 18: Europe Smart Kitchen Appliance Ecosystem Services Revenue (million), by Country 2024 & 2032
- Figure 19: Europe Smart Kitchen Appliance Ecosystem Services Revenue Share (%), by Country 2024 & 2032
- Figure 20: Middle East & Africa Smart Kitchen Appliance Ecosystem Services Revenue (million), by Application 2024 & 2032
- Figure 21: Middle East & Africa Smart Kitchen Appliance Ecosystem Services Revenue Share (%), by Application 2024 & 2032
- Figure 22: Middle East & Africa Smart Kitchen Appliance Ecosystem Services Revenue (million), by Type 2024 & 2032
- Figure 23: Middle East & Africa Smart Kitchen Appliance Ecosystem Services Revenue Share (%), by Type 2024 & 2032
- Figure 24: Middle East & Africa Smart Kitchen Appliance Ecosystem Services Revenue (million), by Country 2024 & 2032
- Figure 25: Middle East & Africa Smart Kitchen Appliance Ecosystem Services Revenue Share (%), by Country 2024 & 2032
- Figure 26: Asia Pacific Smart Kitchen Appliance Ecosystem Services Revenue (million), by Application 2024 & 2032
- Figure 27: Asia Pacific Smart Kitchen Appliance Ecosystem Services Revenue Share (%), by Application 2024 & 2032
- Figure 28: Asia Pacific Smart Kitchen Appliance Ecosystem Services Revenue (million), by Type 2024 & 2032
- Figure 29: Asia Pacific Smart Kitchen Appliance Ecosystem Services Revenue Share (%), by Type 2024 & 2032
- Figure 30: Asia Pacific Smart Kitchen Appliance Ecosystem Services Revenue (million), by Country 2024 & 2032
- Figure 31: Asia Pacific Smart Kitchen Appliance Ecosystem Services Revenue Share (%), by Country 2024 & 2032
List of Tables
- Table 1: Global Smart Kitchen Appliance Ecosystem Services Revenue million Forecast, by Region 2019 & 2032
- Table 2: Global Smart Kitchen Appliance Ecosystem Services Revenue million Forecast, by Application 2019 & 2032
- Table 3: Global Smart Kitchen Appliance Ecosystem Services Revenue million Forecast, by Type 2019 & 2032
- Table 4: Global Smart Kitchen Appliance Ecosystem Services Revenue million Forecast, by Region 2019 & 2032
- Table 5: Global Smart Kitchen Appliance Ecosystem Services Revenue million Forecast, by Application 2019 & 2032
- Table 6: Global Smart Kitchen Appliance Ecosystem Services Revenue million Forecast, by Type 2019 & 2032
- Table 7: Global Smart Kitchen Appliance Ecosystem Services Revenue million Forecast, by Country 2019 & 2032
- Table 8: United States Smart Kitchen Appliance Ecosystem Services Revenue (million) Forecast, by Application 2019 & 2032
- Table 9: Canada Smart Kitchen Appliance Ecosystem Services Revenue (million) Forecast, by Application 2019 & 2032
- Table 10: Mexico Smart Kitchen Appliance Ecosystem Services Revenue (million) Forecast, by Application 2019 & 2032
- Table 11: Global Smart Kitchen Appliance Ecosystem Services Revenue million Forecast, by Application 2019 & 2032
- Table 12: Global Smart Kitchen Appliance Ecosystem Services Revenue million Forecast, by Type 2019 & 2032
- Table 13: Global Smart Kitchen Appliance Ecosystem Services Revenue million Forecast, by Country 2019 & 2032
- Table 14: Brazil Smart Kitchen Appliance Ecosystem Services Revenue (million) Forecast, by Application 2019 & 2032
- Table 15: Argentina Smart Kitchen Appliance Ecosystem Services Revenue (million) Forecast, by Application 2019 & 2032
- Table 16: Rest of South America Smart Kitchen Appliance Ecosystem Services Revenue (million) Forecast, by Application 2019 & 2032
- Table 17: Global Smart Kitchen Appliance Ecosystem Services Revenue million Forecast, by Application 2019 & 2032
- Table 18: Global Smart Kitchen Appliance Ecosystem Services Revenue million Forecast, by Type 2019 & 2032
- Table 19: Global Smart Kitchen Appliance Ecosystem Services Revenue million Forecast, by Country 2019 & 2032
- Table 20: United Kingdom Smart Kitchen Appliance Ecosystem Services Revenue (million) Forecast, by Application 2019 & 2032
- Table 21: Germany Smart Kitchen Appliance Ecosystem Services Revenue (million) Forecast, by Application 2019 & 2032
- Table 22: France Smart Kitchen Appliance Ecosystem Services Revenue (million) Forecast, by Application 2019 & 2032
- Table 23: Italy Smart Kitchen Appliance Ecosystem Services Revenue (million) Forecast, by Application 2019 & 2032
- Table 24: Spain Smart Kitchen Appliance Ecosystem Services Revenue (million) Forecast, by Application 2019 & 2032
- Table 25: Russia Smart Kitchen Appliance Ecosystem Services Revenue (million) Forecast, by Application 2019 & 2032
- Table 26: Benelux Smart Kitchen Appliance Ecosystem Services Revenue (million) Forecast, by Application 2019 & 2032
- Table 27: Nordics Smart Kitchen Appliance Ecosystem Services Revenue (million) Forecast, by Application 2019 & 2032
- Table 28: Rest of Europe Smart Kitchen Appliance Ecosystem Services Revenue (million) Forecast, by Application 2019 & 2032
- Table 29: Global Smart Kitchen Appliance Ecosystem Services Revenue million Forecast, by Application 2019 & 2032
- Table 30: Global Smart Kitchen Appliance Ecosystem Services Revenue million Forecast, by Type 2019 & 2032
- Table 31: Global Smart Kitchen Appliance Ecosystem Services Revenue million Forecast, by Country 2019 & 2032
- Table 32: Turkey Smart Kitchen Appliance Ecosystem Services Revenue (million) Forecast, by Application 2019 & 2032
- Table 33: Israel Smart Kitchen Appliance Ecosystem Services Revenue (million) Forecast, by Application 2019 & 2032
- Table 34: GCC Smart Kitchen Appliance Ecosystem Services Revenue (million) Forecast, by Application 2019 & 2032
- Table 35: North Africa Smart Kitchen Appliance Ecosystem Services Revenue (million) Forecast, by Application 2019 & 2032
- Table 36: South Africa Smart Kitchen Appliance Ecosystem Services Revenue (million) Forecast, by Application 2019 & 2032
- Table 37: Rest of Middle East & Africa Smart Kitchen Appliance Ecosystem Services Revenue (million) Forecast, by Application 2019 & 2032
- Table 38: Global Smart Kitchen Appliance Ecosystem Services Revenue million Forecast, by Application 2019 & 2032
- Table 39: Global Smart Kitchen Appliance Ecosystem Services Revenue million Forecast, by Type 2019 & 2032
- Table 40: Global Smart Kitchen Appliance Ecosystem Services Revenue million Forecast, by Country 2019 & 2032
- Table 41: China Smart Kitchen Appliance Ecosystem Services Revenue (million) Forecast, by Application 2019 & 2032
- Table 42: India Smart Kitchen Appliance Ecosystem Services Revenue (million) Forecast, by Application 2019 & 2032
- Table 43: Japan Smart Kitchen Appliance Ecosystem Services Revenue (million) Forecast, by Application 2019 & 2032
- Table 44: South Korea Smart Kitchen Appliance Ecosystem Services Revenue (million) Forecast, by Application 2019 & 2032
- Table 45: ASEAN Smart Kitchen Appliance Ecosystem Services Revenue (million) Forecast, by Application 2019 & 2032
- Table 46: Oceania Smart Kitchen Appliance Ecosystem Services Revenue (million) Forecast, by Application 2019 & 2032
- Table 47: Rest of Asia Pacific Smart Kitchen Appliance Ecosystem Services Revenue (million) Forecast, by Application 2019 & 2032
Frequently Asked Questions
1. What is the projected Compound Annual Growth Rate (CAGR) of the Smart Kitchen Appliance Ecosystem Services?
The projected CAGR is approximately 9.5%.
2. Which companies are prominent players in the Smart Kitchen Appliance Ecosystem Services?
Key companies in the market include Whirlpool Corporation, Electrolux, Samsung Electronics, LG Electronics, Haier, BSH, Miele, Panasonic, Robam, Midea.
3. What are the main segments of the Smart Kitchen Appliance Ecosystem Services?
The market segments include Application, Type.
4. Can you provide details about the market size?
The market size is estimated to be USD 1632 million as of 2022.
5. What are some drivers contributing to market growth?
N/A
6. What are the notable trends driving market growth?
N/A
7. Are there any restraints impacting market growth?
N/A
8. Can you provide examples of recent developments in the market?
N/A
9. What pricing options are available for accessing the report?
Pricing options include single-user, multi-user, and enterprise licenses priced at USD 2900.00, USD 4350.00, and USD 5800.00 respectively.
10. Is the market size provided in terms of value or volume?
The market size is provided in terms of value, measured in million.
11. Are there any specific market keywords associated with the report?
Yes, the market keyword associated with the report is "Smart Kitchen Appliance Ecosystem Services," which aids in identifying and referencing the specific market segment covered.
12. How do I determine which pricing option suits my needs best?
The pricing options vary based on user requirements and access needs. Individual users may opt for single-user licenses, while businesses requiring broader access may choose multi-user or enterprise licenses for cost-effective access to the report.
13. Are there any additional resources or data provided in the Smart Kitchen Appliance Ecosystem Services report?
While the report offers comprehensive insights, it's advisable to review the specific contents or supplementary materials provided to ascertain if additional resources or data are available.
14. How can I stay updated on further developments or reports in the Smart Kitchen Appliance Ecosystem Services?
To stay informed about further developments, trends, and reports in the Smart Kitchen Appliance Ecosystem Services, consider subscribing to industry newsletters, following relevant companies and organizations, or regularly checking reputable industry news sources and publications.
Methodology
Step 1 - Identification of Relevant Samples Size from Population Database


Step 2 - Approaches for Defining Global Market Size (Value, Volume* & Price*)

Note*: In applicable scenarios
Step 3 - Data Sources
Primary Research
- Web Analytics
- Survey Reports
- Research Institute
- Latest Research Reports
- Opinion Leaders
Secondary Research
- Annual Reports
- White Paper
- Latest Press Release
- Industry Association
- Paid Database
- Investor Presentations

Step 4 - Data Triangulation
Involves using different sources of information in order to increase the validity of a study
These sources are likely to be stakeholders in a program - participants, other researchers, program staff, other community members, and so on.
Then we put all data in single framework & apply various statistical tools to find out the dynamic on the market.
During the analysis stage, feedback from the stakeholder groups would be compared to determine areas of agreement as well as areas of divergence


