Key Insights
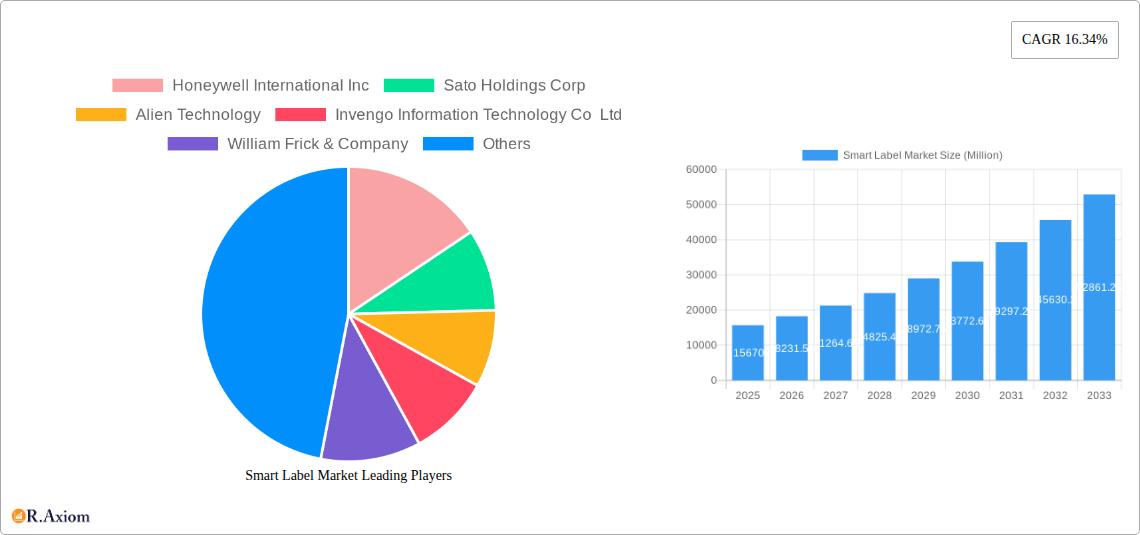
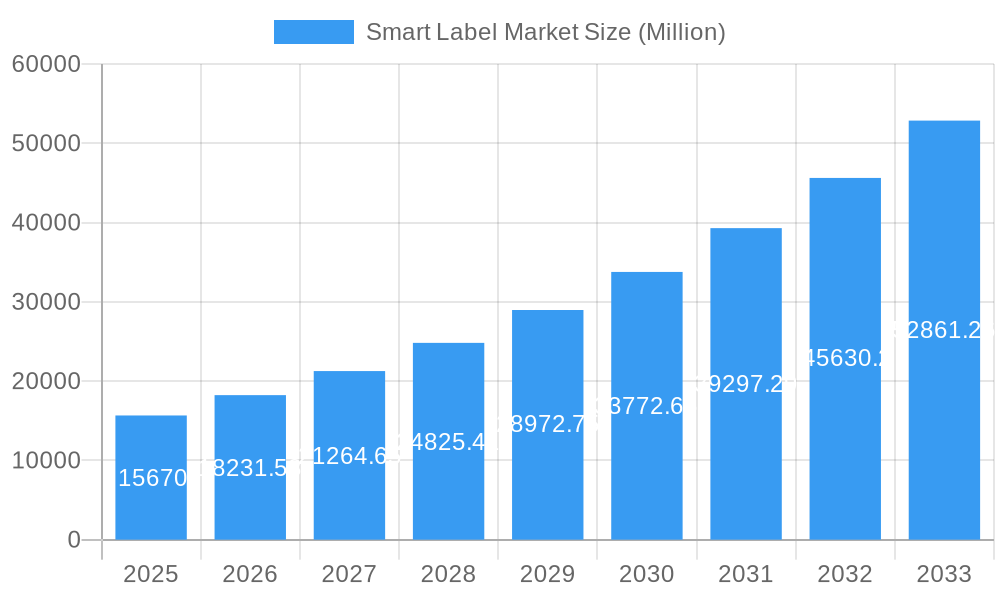
The global smart label market, valued at $15.67 billion in 2025, is projected to experience robust growth, driven by a compound annual growth rate (CAGR) of 16.34% from 2025 to 2033. This expansion is fueled by several key factors. The increasing adoption of smart labels across diverse sectors, including retail, healthcare, and logistics, is a primary driver. Retailers are leveraging smart labels for enhanced inventory management, improved supply chain efficiency, and engaging consumer experiences through interactive packaging. The healthcare and pharmaceutical industries utilize smart labels for anti-counterfeiting measures, track-and-trace capabilities, and improved patient safety. Simultaneously, the logistics sector benefits from improved shipment tracking and reduced loss or damage. Technological advancements, particularly in RFID and Electronic Shelf Labels (ESL), are further propelling market growth. RFID's ability to automatically identify and track items offers significant advantages over traditional barcodes, while ESLs provide real-time inventory updates and dynamic pricing capabilities, enhancing operational efficiency. However, factors like high initial investment costs for implementing smart label technologies and the need for robust infrastructure to support data management can act as restraints on market growth. The market is segmented by technology (EAS, RFID, Sensing Labels, NFC, ESL) and end-user industry, with retail currently dominating but substantial growth potential seen in other sectors such as healthcare and logistics. Major players such as Honeywell, Sato Holdings, and Zebra Technologies are strategically positioning themselves to capitalize on this growing market.
Smart Label Market Market Size (In Billion)
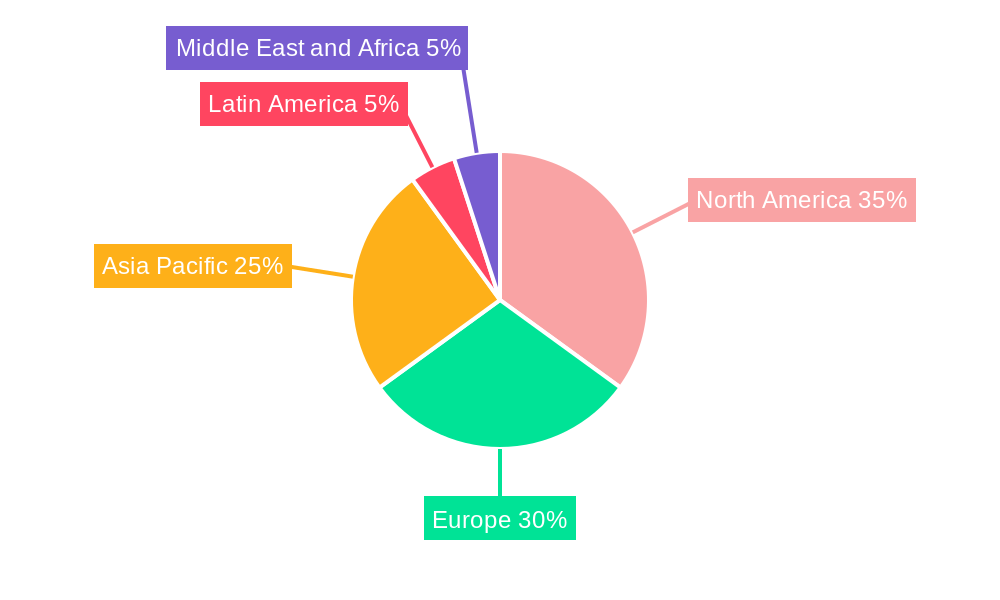
The market's geographical distribution reflects a global trend, with North America and Europe currently holding significant market shares. However, the Asia-Pacific region, particularly China and India, is expected to witness substantial growth owing to rapid industrialization, rising consumer demand, and increasing adoption of advanced technologies. Latin America and the Middle East and Africa are also emerging markets exhibiting promising growth potential, although currently holding smaller market shares compared to established regions. The continuous innovation in smart label technologies, focusing on improved functionality, cost reduction, and broader application, will further drive market expansion in the coming years. The market is expected to see a significant increase in the adoption of advanced analytics and AI to improve operational efficiency and gain insights from smart label data.
Smart Label Market Company Market Share
This comprehensive report provides a detailed analysis of the global Smart Label Market, offering actionable insights for industry stakeholders, investors, and strategic decision-makers. The study covers the period from 2019 to 2033, with 2025 as the base year and a forecast period extending to 2033. The report values are expressed in Millions. The analysis encompasses market segmentation by technology (Electronic Article Surveillance (EAS), RFID, Sensing Label, NFC, Electronic Shelf Label (ESL)) and end-user industry (Retail, Healthcare and Pharmaceutical, Logistics, Manufacturing, Other End-user Industries). Key players like Honeywell International Inc, Sato Holdings Corp, Alien Technology, Invengo Information Technology Co Ltd, William Frick & Company, Scanbuy Inc, CCL Industries Inc, Avery Dennison Corporation, and Zebra Technologies Corp are profiled, though the list is not exhaustive.
Smart Label Market Concentration & Innovation
The Smart Label Market exhibits a moderately concentrated landscape, with a few major players holding significant market share. However, the market is also characterized by ongoing innovation and the entry of new players, particularly in specialized segments like sensing labels and ESLs. The market share of the top five players in 2024 is estimated at xx%, indicating opportunities for both consolidation and expansion. Mergers and acquisitions (M&A) activity has been moderate, with deal values totaling approximately xx Million in the past five years. These deals are primarily focused on expanding technological capabilities and market reach.
- Market Concentration: Top 5 players hold approximately xx% market share (2024).
- Innovation Drivers: Advancements in RFID, NFC, and sensing technologies; growing demand for real-time inventory management and traceability.
- Regulatory Frameworks: Regulations regarding data privacy and product traceability are impacting market growth and adoption.
- Product Substitutes: Traditional labeling methods, though gradually being replaced due to the advantages offered by smart labels.
- End-User Trends: Increasing adoption of automation and digitalization across various industries is driving the demand for smart labels.
- M&A Activity: Significant M&A activity in the last 5 years totaled approximately xx Million, focused primarily on technology enhancement and market expansion.
Smart Label Market Industry Trends & Insights
The Smart Label Market is experiencing robust and dynamic growth, propelled by an increasing demand for optimized supply chain management, a heightened emphasis on product authenticity and traceability, and the widespread integration of digital technologies across diverse industries. This market is at the forefront of technological innovation, witnessing the emergence of sophisticated sensing technologies and advanced data analytics that significantly enhance the functionality and expand the application scope of smart labels. Furthermore, evolving consumer preferences for personalized experiences and a strong desire for transparent information regarding product origins are pivotal drivers of this market's expansion. Projections indicate a Compound Annual Growth Rate (CAGR) of **[Insert XX]%** during the forecast period (2025-2033), with market penetration expected to reach **[Insert XX]%** by 2033. The competitive landscape is characterized by intense rivalry, with key players heavily investing in research and development and strategically expanding their product portfolios to maintain and enhance their competitive positions. Market growth is also subject to influences from fluctuating raw material prices and broader economic conditions.
Dominant Markets & Segments in Smart Label Market
The Retail sector stands as the dominant force within the Smart Label Market, currently accounting for approximately [Insert XX]% of the overall market revenue in 2024. Geographically, North America and Europe are leading regions, leveraging their high technological adoption rates and thriving e-commerce ecosystems. However, the Asia-Pacific region is poised for substantial and accelerated growth, fueled by ongoing industrialization initiatives and a burgeoning consumer spending power.
-
By Technology:
- RFID (Radio-Frequency Identification): Continues to hold the largest market share, attributed to its inherent versatility and efficient long-range reading capabilities, making it ideal for various tracking and identification applications.
- ESL (Electronic Shelf Labels): Experiencing rapid adoption and growth, driven by the increasing demand for dynamic pricing strategies, real-time inventory updates, and improved in-store customer experiences.
- Other Technologies: Includes burgeoning segments like NFC (Near Field Communication) and advanced sensing labels, which offer unique functionalities and significant, albeit currently niche, growth potential.
-
By End-user Industry:
- Retail: Remains the dominant end-user due to its critical need for efficient inventory management, enhanced customer engagement, and streamlined operations. Key drivers include robust e-commerce expansion, the imperative for accurate inventory tracking, and a growing consumer demand for detailed product information.
- Healthcare and Pharmaceutical: A crucial sector, driven by the stringent requirement for secure drug serialization, counterfeit prevention, and enhanced patient safety through precise tracking and monitoring.
- Logistics: Plays a vital role in facilitating seamless and efficient tracking, monitoring, and management of goods throughout complex global supply chains, optimizing efficiency and reducing losses.
Smart Label Market Product Developments
Recent product innovations focus on miniaturization, improved sensor integration, enhanced data processing capabilities, and the development of more sustainable materials. The key competitive advantages stem from technological superiority, lower manufacturing costs, ease of use, and a superior user experience. The trend is towards integrating smart labels with other technologies, such as the Internet of Things (IoT), to create more sophisticated applications.
Report Scope & Segmentation Analysis
This comprehensive report meticulously segments the Smart Label Market based on key technological categories, including EAS (Electronic Article Surveillance), RFID, Sensing Labels, NFC, and ESL, as well as by diverse end-user industries such as Retail, Healthcare and Pharmaceutical, Logistics, Manufacturing, and Other emerging sectors. Each segment's market size, detailed growth projections, and evolving competitive dynamics are analyzed with granular precision. For instance, the RFID segment is projected to witness substantial expansion owing to its continuously enhanced capabilities. Concurrently, the ESL segment is gaining significant traction due to its direct application in dynamic pricing and real-time inventory management solutions. The retail sector consistently demonstrates high growth potential, while the healthcare and pharmaceutical industries are emerging as key drivers of adoption, primarily for their critical need for enhanced security, stringent traceability, and regulatory compliance.
Key Drivers of Smart Label Market Growth
The Smart Label Market's growth is fueled by several factors: increased demand for supply chain optimization, stringent regulatory requirements for product traceability, rising adoption of digital technologies across industries, and a growing emphasis on brand protection and counterfeiting prevention. For example, the implementation of GS1 standards and government regulations on product authenticity is driving adoption, while advancements in RFID and NFC technologies are expanding market potential.
Challenges in the Smart Label Market Sector
The Smart Label Market is not without its hurdles. Significant challenges include the substantial initial investment costs associated with implementation, the necessity for specialized infrastructure to support advanced functionalities, potential data security and privacy concerns, and the inherent integration complexities when interfacing with existing disparate enterprise systems. The reliance on specific, sometimes proprietary, reader technologies can also present a limitation for widespread adoption. Furthermore, unpredictable supply chain disruptions and fluctuations in raw material costs can directly impact manufacturing costs and overall profitability within the sector.
Emerging Opportunities in Smart Label Market
The future of the Smart Label Market is replete with exciting emerging opportunities. These include the ongoing development and integration of more sophisticated and multi-functional sensing technologies, seamless integration with the Internet of Things (IoT) platforms to create interconnected ecosystems, the strategic expansion of applications into rapidly developing emerging markets, and a growing industry-wide focus on sustainability and the development of eco-friendly materials for label production. The exploration and expansion of smart label applications into novel sectors, such as advanced agriculture and precision environmental monitoring, represent further significant avenues for growth and innovation.
Leading Players in the Smart Label Market Market
Key Developments in Smart Label Market Industry
- March 2023: The Premier League and Avery Dennison collaborated on a new font design for Premier League jerseys, enhancing visibility and impacting both on-field and off-field branding. This highlights the importance of smart labels in branding and visual communication.
- February 2023: Danavation Technologies Corp. secured contracts for four additional digital smart label installations in retail locations across Canada and the US, signaling growth in the digital smart label segment.
Strategic Outlook for Smart Label Market Market
The Smart Label Market is poised for continued expansion, driven by ongoing technological advancements, increased industry adoption, and the growing need for improved supply chain visibility and product traceability. The focus on sustainable materials and integration with IoT technologies will further propel market growth, creating significant opportunities for industry players and investors.
Smart Label Market Segmentation
-
1. Technology
- 1.1. Electronic Article Surveillance (EAS)
- 1.2. RFID
- 1.3. Sensing Label
- 1.4. NFC
- 1.5. Electronic Shelf Label (ESL)
-
2. End-user Industry
- 2.1. Retail
- 2.2. Healthcare and Pharmaceutical
- 2.3. Logistics
- 2.4. Manufacturing
- 2.5. Other End-user Industries
Smart Label Market Segmentation By Geography
-
1. North America
- 1.1. United States
- 1.2. Canada
-
2. Europe
- 2.1. United Kingdom
- 2.2. Germany
- 2.3. France
- 2.4. Rest of Europe
-
3. Asia Pacific
- 3.1. China
- 3.2. India
- 3.3. Japan
- 3.4. South Korea
- 3.5. Rest of Asia Pacific
- 4. Latin America
- 5. Middle East and Africa
Smart Label Market Regional Market Share
Geographic Coverage of Smart Label Market
Smart Label Market REPORT HIGHLIGHTS
| Aspects | Details |
|---|---|
| Study Period | 2020-2034 |
| Base Year | 2025 |
| Estimated Year | 2026 |
| Forecast Period | 2026-2034 |
| Historical Period | 2020-2025 |
| Growth Rate | CAGR of 16.34% from 2020-2034 |
| Segmentation |
|
Table of Contents
- 1. Introduction
- 1.1. Research Scope
- 1.2. Market Segmentation
- 1.3. Research Objective
- 1.4. Definitions and Assumptions
- 2. Executive Summary
- 2.1. Market Snapshot
- 3. Market Dynamics
- 3.1. Market Drivers
- 3.2. Market Restrains
- 3.3. Market Trends
- 3.4. Market Opportunities
- 4. Market Factor Analysis
- 4.1. Porters Five Forces
- 4.1.1. Bargaining Power of Suppliers
- 4.1.2. Bargaining Power of Buyers
- 4.1.3. Threat of New Entrants
- 4.1.4. Threat of Substitutes
- 4.1.5. Competitive Rivalry
- 4.2. PESTEL analysis
- 4.3. BCG Analysis
- 4.3.1. Stars (High Growth, High Market Share)
- 4.3.2. Cash Cows (Low Growth, High Market Share)
- 4.3.3. Question Mark (High Growth, Low Market Share)
- 4.3.4. Dogs (Low Growth, Low Market Share)
- 4.4. Ansoff Matrix Analysis
- 4.5. Supply Chain Analysis
- 4.6. Regulatory Landscape
- 4.7. Current Market Potential and Opportunity Assessment (TAM–SAM–SOM Framework)
- 4.8. RAX Analyst Note
- 4.1. Porters Five Forces
- 5. Market Analysis, Insights and Forecast 2021-2033
- 5.1. Market Analysis, Insights and Forecast - by Technology
- 5.1.1. Electronic Article Surveillance (EAS)
- 5.1.2. RFID
- 5.1.3. Sensing Label
- 5.1.4. NFC
- 5.1.5. Electronic Shelf Label (ESL)
- 5.2. Market Analysis, Insights and Forecast - by End-user Industry
- 5.2.1. Retail
- 5.2.2. Healthcare and Pharmaceutical
- 5.2.3. Logistics
- 5.2.4. Manufacturing
- 5.2.5. Other End-user Industries
- 5.3. Market Analysis, Insights and Forecast - by Region
- 5.3.1. North America
- 5.3.2. Europe
- 5.3.3. Asia Pacific
- 5.3.4. Latin America
- 5.3.5. Middle East and Africa
- 5.1. Market Analysis, Insights and Forecast - by Technology
- 6. Global Smart Label Market Analysis, Insights and Forecast, 2021-2033
- 6.1. Market Analysis, Insights and Forecast - by Technology
- 6.1.1. Electronic Article Surveillance (EAS)
- 6.1.2. RFID
- 6.1.3. Sensing Label
- 6.1.4. NFC
- 6.1.5. Electronic Shelf Label (ESL)
- 6.2. Market Analysis, Insights and Forecast - by End-user Industry
- 6.2.1. Retail
- 6.2.2. Healthcare and Pharmaceutical
- 6.2.3. Logistics
- 6.2.4. Manufacturing
- 6.2.5. Other End-user Industries
- 6.1. Market Analysis, Insights and Forecast - by Technology
- 7. North America Smart Label Market Analysis, Insights and Forecast, 2020-2032
- 7.1. Market Analysis, Insights and Forecast - by Technology
- 7.1.1. Electronic Article Surveillance (EAS)
- 7.1.2. RFID
- 7.1.3. Sensing Label
- 7.1.4. NFC
- 7.1.5. Electronic Shelf Label (ESL)
- 7.2. Market Analysis, Insights and Forecast - by End-user Industry
- 7.2.1. Retail
- 7.2.2. Healthcare and Pharmaceutical
- 7.2.3. Logistics
- 7.2.4. Manufacturing
- 7.2.5. Other End-user Industries
- 7.1. Market Analysis, Insights and Forecast - by Technology
- 8. Europe Smart Label Market Analysis, Insights and Forecast, 2020-2032
- 8.1. Market Analysis, Insights and Forecast - by Technology
- 8.1.1. Electronic Article Surveillance (EAS)
- 8.1.2. RFID
- 8.1.3. Sensing Label
- 8.1.4. NFC
- 8.1.5. Electronic Shelf Label (ESL)
- 8.2. Market Analysis, Insights and Forecast - by End-user Industry
- 8.2.1. Retail
- 8.2.2. Healthcare and Pharmaceutical
- 8.2.3. Logistics
- 8.2.4. Manufacturing
- 8.2.5. Other End-user Industries
- 8.1. Market Analysis, Insights and Forecast - by Technology
- 9. Asia Pacific Smart Label Market Analysis, Insights and Forecast, 2020-2032
- 9.1. Market Analysis, Insights and Forecast - by Technology
- 9.1.1. Electronic Article Surveillance (EAS)
- 9.1.2. RFID
- 9.1.3. Sensing Label
- 9.1.4. NFC
- 9.1.5. Electronic Shelf Label (ESL)
- 9.2. Market Analysis, Insights and Forecast - by End-user Industry
- 9.2.1. Retail
- 9.2.2. Healthcare and Pharmaceutical
- 9.2.3. Logistics
- 9.2.4. Manufacturing
- 9.2.5. Other End-user Industries
- 9.1. Market Analysis, Insights and Forecast - by Technology
- 10. Latin America Smart Label Market Analysis, Insights and Forecast, 2020-2032
- 10.1. Market Analysis, Insights and Forecast - by Technology
- 10.1.1. Electronic Article Surveillance (EAS)
- 10.1.2. RFID
- 10.1.3. Sensing Label
- 10.1.4. NFC
- 10.1.5. Electronic Shelf Label (ESL)
- 10.2. Market Analysis, Insights and Forecast - by End-user Industry
- 10.2.1. Retail
- 10.2.2. Healthcare and Pharmaceutical
- 10.2.3. Logistics
- 10.2.4. Manufacturing
- 10.2.5. Other End-user Industries
- 10.1. Market Analysis, Insights and Forecast - by Technology
- 11. Middle East and Africa Smart Label Market Analysis, Insights and Forecast, 2020-2032
- 11.1. Market Analysis, Insights and Forecast - by Technology
- 11.1.1. Electronic Article Surveillance (EAS)
- 11.1.2. RFID
- 11.1.3. Sensing Label
- 11.1.4. NFC
- 11.1.5. Electronic Shelf Label (ESL)
- 11.2. Market Analysis, Insights and Forecast - by End-user Industry
- 11.2.1. Retail
- 11.2.2. Healthcare and Pharmaceutical
- 11.2.3. Logistics
- 11.2.4. Manufacturing
- 11.2.5. Other End-user Industries
- 11.1. Market Analysis, Insights and Forecast - by Technology
- 12. Competitive Analysis
- 12.1. Company Profiles
- 12.1.1 Honeywell International Inc
- 12.1.1.1. Company Overview
- 12.1.1.2. Products
- 12.1.1.3. Company Financials
- 12.1.1.4. SWOT Analysis
- 12.1.2 Sato Holdings Corp
- 12.1.2.1. Company Overview
- 12.1.2.2. Products
- 12.1.2.3. Company Financials
- 12.1.2.4. SWOT Analysis
- 12.1.3 Alien Technology
- 12.1.3.1. Company Overview
- 12.1.3.2. Products
- 12.1.3.3. Company Financials
- 12.1.3.4. SWOT Analysis
- 12.1.4 Invengo Information Technology Co Ltd
- 12.1.4.1. Company Overview
- 12.1.4.2. Products
- 12.1.4.3. Company Financials
- 12.1.4.4. SWOT Analysis
- 12.1.5 William Frick & Company
- 12.1.5.1. Company Overview
- 12.1.5.2. Products
- 12.1.5.3. Company Financials
- 12.1.5.4. SWOT Analysis
- 12.1.6 Scanbuy Inc
- 12.1.6.1. Company Overview
- 12.1.6.2. Products
- 12.1.6.3. Company Financials
- 12.1.6.4. SWOT Analysis
- 12.1.7 CCL Industries Inc
- 12.1.7.1. Company Overview
- 12.1.7.2. Products
- 12.1.7.3. Company Financials
- 12.1.7.4. SWOT Analysis
- 12.1.8 Avery Dennison Corporation
- 12.1.8.1. Company Overview
- 12.1.8.2. Products
- 12.1.8.3. Company Financials
- 12.1.8.4. SWOT Analysis
- 12.1.9 Zebra Technologies Corp *List Not Exhaustive
- 12.1.9.1. Company Overview
- 12.1.9.2. Products
- 12.1.9.3. Company Financials
- 12.1.9.4. SWOT Analysis
- 12.1.1 Honeywell International Inc
- 12.2. Market Entropy
- 12.2.1 Company's Key Areas Served
- 12.2.2 Recent Developments
- 12.3. Company Market Share Analysis 2025
- 12.3.1 Top 5 Companies Market Share Analysis
- 12.3.2 Top 3 Companies Market Share Analysis
- 12.4. List of Potential Customers
- 13. Research Methodology
List of Figures
- Figure 1: Global Smart Label Market Revenue Breakdown (Million, %) by Region 2025 & 2033
- Figure 2: North America Smart Label Market Revenue (Million), by Technology 2025 & 2033
- Figure 3: North America Smart Label Market Revenue Share (%), by Technology 2025 & 2033
- Figure 4: North America Smart Label Market Revenue (Million), by End-user Industry 2025 & 2033
- Figure 5: North America Smart Label Market Revenue Share (%), by End-user Industry 2025 & 2033
- Figure 6: North America Smart Label Market Revenue (Million), by Country 2025 & 2033
- Figure 7: North America Smart Label Market Revenue Share (%), by Country 2025 & 2033
- Figure 8: Europe Smart Label Market Revenue (Million), by Technology 2025 & 2033
- Figure 9: Europe Smart Label Market Revenue Share (%), by Technology 2025 & 2033
- Figure 10: Europe Smart Label Market Revenue (Million), by End-user Industry 2025 & 2033
- Figure 11: Europe Smart Label Market Revenue Share (%), by End-user Industry 2025 & 2033
- Figure 12: Europe Smart Label Market Revenue (Million), by Country 2025 & 2033
- Figure 13: Europe Smart Label Market Revenue Share (%), by Country 2025 & 2033
- Figure 14: Asia Pacific Smart Label Market Revenue (Million), by Technology 2025 & 2033
- Figure 15: Asia Pacific Smart Label Market Revenue Share (%), by Technology 2025 & 2033
- Figure 16: Asia Pacific Smart Label Market Revenue (Million), by End-user Industry 2025 & 2033
- Figure 17: Asia Pacific Smart Label Market Revenue Share (%), by End-user Industry 2025 & 2033
- Figure 18: Asia Pacific Smart Label Market Revenue (Million), by Country 2025 & 2033
- Figure 19: Asia Pacific Smart Label Market Revenue Share (%), by Country 2025 & 2033
- Figure 20: Latin America Smart Label Market Revenue (Million), by Technology 2025 & 2033
- Figure 21: Latin America Smart Label Market Revenue Share (%), by Technology 2025 & 2033
- Figure 22: Latin America Smart Label Market Revenue (Million), by End-user Industry 2025 & 2033
- Figure 23: Latin America Smart Label Market Revenue Share (%), by End-user Industry 2025 & 2033
- Figure 24: Latin America Smart Label Market Revenue (Million), by Country 2025 & 2033
- Figure 25: Latin America Smart Label Market Revenue Share (%), by Country 2025 & 2033
- Figure 26: Middle East and Africa Smart Label Market Revenue (Million), by Technology 2025 & 2033
- Figure 27: Middle East and Africa Smart Label Market Revenue Share (%), by Technology 2025 & 2033
- Figure 28: Middle East and Africa Smart Label Market Revenue (Million), by End-user Industry 2025 & 2033
- Figure 29: Middle East and Africa Smart Label Market Revenue Share (%), by End-user Industry 2025 & 2033
- Figure 30: Middle East and Africa Smart Label Market Revenue (Million), by Country 2025 & 2033
- Figure 31: Middle East and Africa Smart Label Market Revenue Share (%), by Country 2025 & 2033
List of Tables
- Table 1: Global Smart Label Market Revenue Million Forecast, by Technology 2020 & 2033
- Table 2: Global Smart Label Market Revenue Million Forecast, by End-user Industry 2020 & 2033
- Table 3: Global Smart Label Market Revenue Million Forecast, by Region 2020 & 2033
- Table 4: Global Smart Label Market Revenue Million Forecast, by Technology 2020 & 2033
- Table 5: Global Smart Label Market Revenue Million Forecast, by End-user Industry 2020 & 2033
- Table 6: Global Smart Label Market Revenue Million Forecast, by Country 2020 & 2033
- Table 7: United States Smart Label Market Revenue (Million) Forecast, by Application 2020 & 2033
- Table 8: Canada Smart Label Market Revenue (Million) Forecast, by Application 2020 & 2033
- Table 9: Global Smart Label Market Revenue Million Forecast, by Technology 2020 & 2033
- Table 10: Global Smart Label Market Revenue Million Forecast, by End-user Industry 2020 & 2033
- Table 11: Global Smart Label Market Revenue Million Forecast, by Country 2020 & 2033
- Table 12: United Kingdom Smart Label Market Revenue (Million) Forecast, by Application 2020 & 2033
- Table 13: Germany Smart Label Market Revenue (Million) Forecast, by Application 2020 & 2033
- Table 14: France Smart Label Market Revenue (Million) Forecast, by Application 2020 & 2033
- Table 15: Rest of Europe Smart Label Market Revenue (Million) Forecast, by Application 2020 & 2033
- Table 16: Global Smart Label Market Revenue Million Forecast, by Technology 2020 & 2033
- Table 17: Global Smart Label Market Revenue Million Forecast, by End-user Industry 2020 & 2033
- Table 18: Global Smart Label Market Revenue Million Forecast, by Country 2020 & 2033
- Table 19: China Smart Label Market Revenue (Million) Forecast, by Application 2020 & 2033
- Table 20: India Smart Label Market Revenue (Million) Forecast, by Application 2020 & 2033
- Table 21: Japan Smart Label Market Revenue (Million) Forecast, by Application 2020 & 2033
- Table 22: South Korea Smart Label Market Revenue (Million) Forecast, by Application 2020 & 2033
- Table 23: Rest of Asia Pacific Smart Label Market Revenue (Million) Forecast, by Application 2020 & 2033
- Table 24: Global Smart Label Market Revenue Million Forecast, by Technology 2020 & 2033
- Table 25: Global Smart Label Market Revenue Million Forecast, by End-user Industry 2020 & 2033
- Table 26: Global Smart Label Market Revenue Million Forecast, by Country 2020 & 2033
- Table 27: Global Smart Label Market Revenue Million Forecast, by Technology 2020 & 2033
- Table 28: Global Smart Label Market Revenue Million Forecast, by End-user Industry 2020 & 2033
- Table 29: Global Smart Label Market Revenue Million Forecast, by Country 2020 & 2033
Frequently Asked Questions
1. What is the projected Compound Annual Growth Rate (CAGR) of the Smart Label Market?
The projected CAGR is approximately 16.34%.
2. Which companies are prominent players in the Smart Label Market?
Key companies in the market include Honeywell International Inc, Sato Holdings Corp, Alien Technology, Invengo Information Technology Co Ltd, William Frick & Company, Scanbuy Inc, CCL Industries Inc, Avery Dennison Corporation, Zebra Technologies Corp *List Not Exhaustive.
3. What are the main segments of the Smart Label Market?
The market segments include Technology, End-user Industry.
4. Can you provide details about the market size?
The market size is estimated to be USD 15.67 Million as of 2022.
5. What are some drivers contributing to market growth?
Increased Demand for Security and Tracking Solutions.
6. What are the notable trends driving market growth?
Retail End User Industry to Hold Significant Market Share.
7. Are there any restraints impacting market growth?
Lack of Ubiquitous Standards. Safety Concerns. and Inability to withstand Harsh Climatic Conditions.
8. Can you provide examples of recent developments in the market?
March 2023: The Premier League and Avery Dennison collaborated on the new font, which is only the fourth makeover in Premier League history. The new font has enhanced visibility and impacts both on and off the pitch due to an increase in number height and the incorporation of the Premier League's unique graphic design. The new numbers, names, and sleeve badges will be available in the spring, following the release of each Premier League club's 2023-24 season shirt.
9. What pricing options are available for accessing the report?
Pricing options include single-user, multi-user, and enterprise licenses priced at USD 4750, USD 5250, and USD 8750 respectively.
10. Is the market size provided in terms of value or volume?
The market size is provided in terms of value, measured in Million.
11. Are there any specific market keywords associated with the report?
Yes, the market keyword associated with the report is "Smart Label Market," which aids in identifying and referencing the specific market segment covered.
12. How do I determine which pricing option suits my needs best?
The pricing options vary based on user requirements and access needs. Individual users may opt for single-user licenses, while businesses requiring broader access may choose multi-user or enterprise licenses for cost-effective access to the report.
13. Are there any additional resources or data provided in the Smart Label Market report?
While the report offers comprehensive insights, it's advisable to review the specific contents or supplementary materials provided to ascertain if additional resources or data are available.
14. How can I stay updated on further developments or reports in the Smart Label Market?
To stay informed about further developments, trends, and reports in the Smart Label Market, consider subscribing to industry newsletters, following relevant companies and organizations, or regularly checking reputable industry news sources and publications.
Methodology
Step 1 - Identification of Relevant Samples Size from Population Database


Step 2 - Approaches for Defining Global Market Size (Value, Volume* & Price*)

Note*: In applicable scenarios
Step 3 - Data Sources
Primary Research
- Web Analytics
- Survey Reports
- Research Institute
- Latest Research Reports
- Opinion Leaders
Secondary Research
- Annual Reports
- White Paper
- Latest Press Release
- Industry Association
- Paid Database
- Investor Presentations

Step 4 - Data Triangulation
Involves using different sources of information in order to increase the validity of a study
These sources are likely to be stakeholders in a program - participants, other researchers, program staff, other community members, and so on.
Then we put all data in single framework & apply various statistical tools to find out the dynamic on the market.
During the analysis stage, feedback from the stakeholder groups would be compared to determine areas of agreement as well as areas of divergence

