

Key Insights
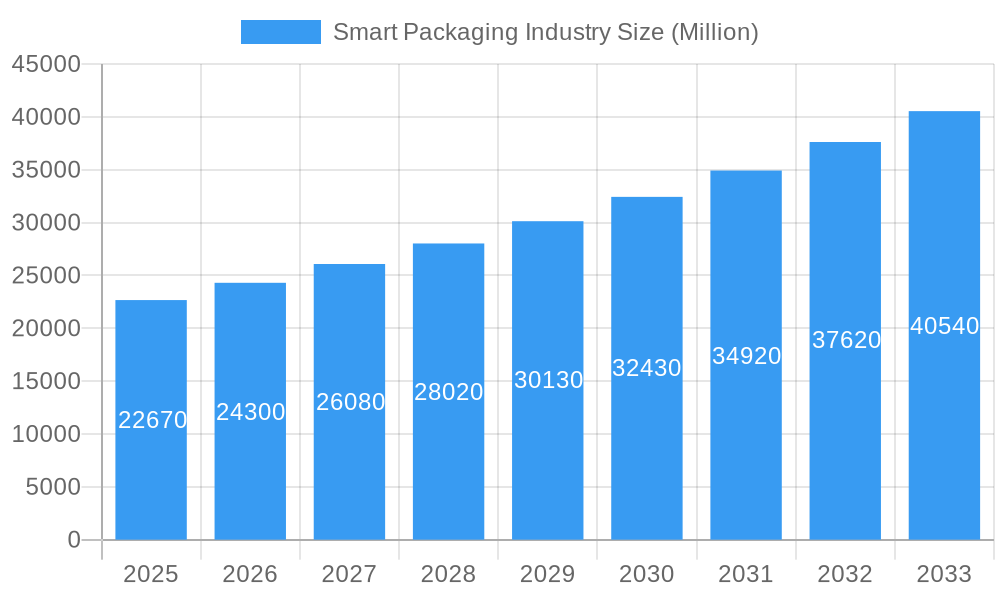
The smart packaging market, valued at $22.67 billion in 2025, is projected to experience robust growth, driven by increasing demand for enhanced product traceability, improved supply chain efficiency, and the rising consumer preference for convenient and informative packaging. A Compound Annual Growth Rate (CAGR) of 7.12% from 2025 to 2033 indicates a significant expansion of this market. Key growth drivers include the increasing adoption of technologies like RFID and sensor integration for real-time tracking and condition monitoring, coupled with the expanding e-commerce sector that necessitates improved packaging solutions. The food and beverage industry is a major contributor, leveraging smart packaging for extended shelf life and improved consumer engagement through interactive features. However, high initial investment costs associated with implementing smart packaging technologies and concerns regarding data security and privacy present challenges to market growth. The market is segmented by technology (active and intelligent packaging) and end-user vertical (food, beverage, healthcare, personal care, and others), with regional variations driven by factors like technological advancements, regulatory frameworks, and consumer behavior. North America and Europe currently hold significant market share due to advanced technological infrastructure and high consumer awareness, but the Asia-Pacific region is poised for significant growth due to its burgeoning e-commerce sector and increasing disposable incomes.
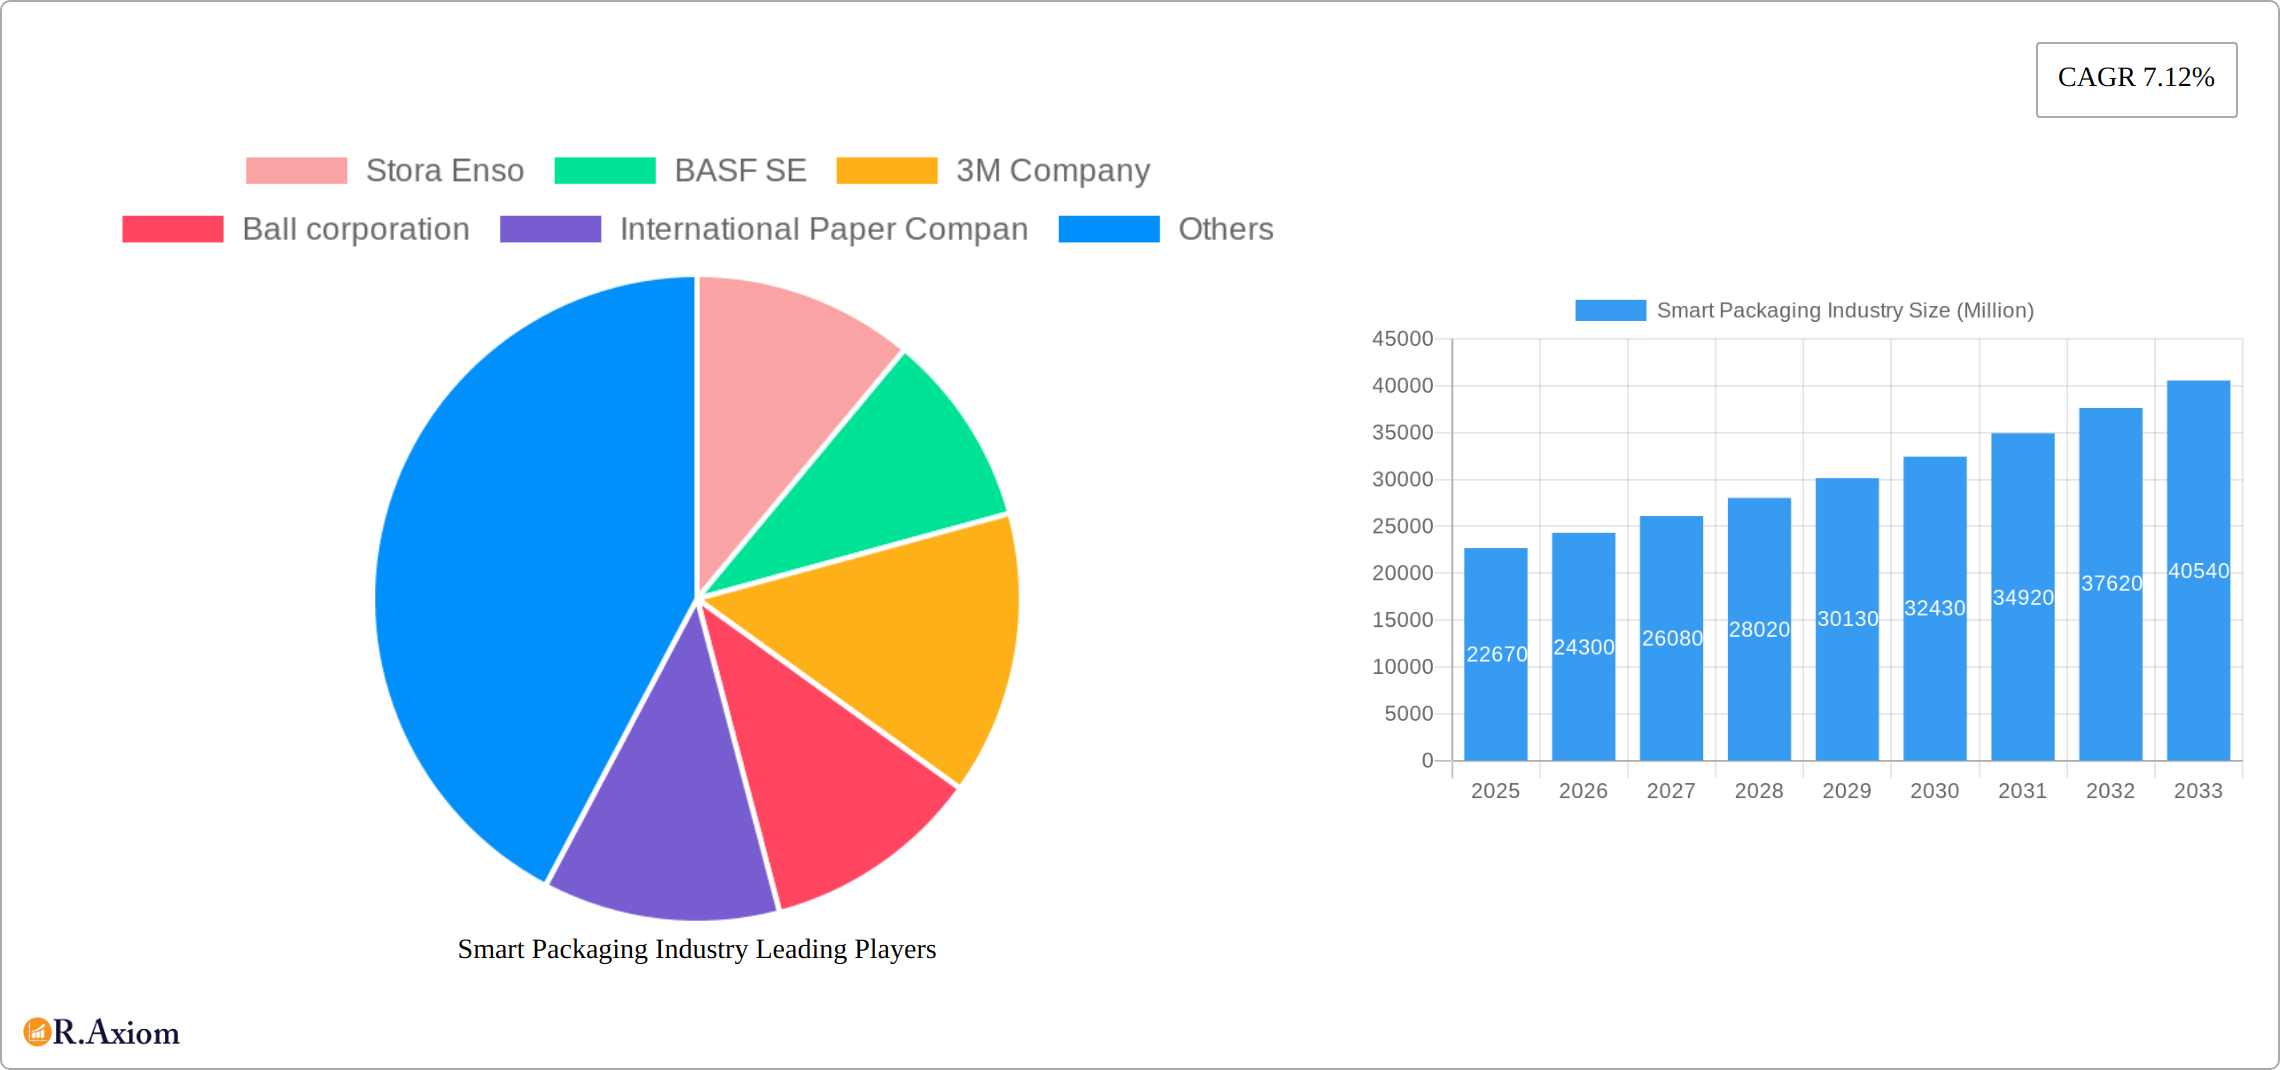
Smart Packaging Industry Market Size (In Billion)
The competitive landscape is dynamic, with key players like Stora Enso, BASF SE, 3M Company, Ball Corporation, and Amcor PLC constantly innovating to improve their offerings. Strategic partnerships and collaborations are becoming increasingly common as companies strive to integrate advanced technologies and expand their market reach. Future growth will likely be influenced by the development of sustainable and environmentally friendly smart packaging solutions, addressing concerns around plastic waste and promoting circular economy principles. Furthermore, advancements in sensor technology, data analytics, and the Internet of Things (IoT) will further propel the adoption of smart packaging across various industries. The market is expected to witness a shift towards more sophisticated and integrated smart packaging systems, enhancing brand interaction and improving overall supply chain transparency.
Smart Packaging Industry Company Market Share
Smart Packaging Industry Market Report: 2019-2033
This comprehensive report provides an in-depth analysis of the global smart packaging market, offering invaluable insights for industry stakeholders, investors, and strategic decision-makers. The study period covers 2019-2033, with 2025 as the base year and a forecast period of 2025-2033. The report projects a market value exceeding xx Million by 2033, driven by significant technological advancements and evolving consumer preferences. This report meticulously analyzes market concentration, innovation, trends, dominant segments, product developments, and challenges, while highlighting key players and emerging opportunities.
Smart Packaging Industry Market Concentration & Innovation
The smart packaging market is moderately concentrated, with leading players like Amcor PLC, Stora Enso, and Avery Dennison Corporation holding substantial market share. However, a dynamic competitive landscape is emerging, fueled by both established players and innovative newcomers. While the top five companies currently control an estimated xx% of the market, significant opportunities remain for smaller, agile businesses. Innovation is paramount, driven by the surging demand for sustainable, secure, and consumer-centric packaging solutions. Stringent regulatory frameworks, emphasizing sustainability and food safety, are major catalysts shaping market behavior. The widespread adoption of RFID and other advanced tracking technologies is accelerating innovation, though competition from traditional packaging materials persists. Robust mergers and acquisitions (M&A) activity, with deal values exceeding xx million USD over the past five years, underscores the industry's dynamism. Recent M&A activity reflects strategies focused on expanding product portfolios, integrating cutting-edge technologies, and securing stronger market positions in key geographical regions.
- Market Share (Top 5 Players): xx%
- M&A Deal Value (2019-2024): xx Million USD
- Key Innovation Drivers: Sustainability, enhanced traceability, improved consumer engagement, robust anti-counterfeiting measures, and data-driven insights.
- Regulatory Impact: Increasingly stringent regulations focused on recyclability, compostability, and adherence to rigorous food safety standards are significantly influencing product development and market strategy.
Smart Packaging Industry Industry Trends & Insights
The smart packaging market is experiencing robust growth, projected at a CAGR of xx% from 2025 to 2033. This expansion is fueled by increasing consumer demand for convenient, secure, and environmentally responsible packaging solutions, alongside rapid advancements in sensor technology, RFID, and data analytics. The burgeoning e-commerce sector and its demand for heightened supply chain transparency are key drivers of market growth. Disruptive technologies, including the integration of IoT and AI within packaging, are revolutionizing the industry, enhancing traceability, enabling real-time monitoring, and creating personalized consumer experiences. The growing preference for sustainable packaging options is compelling manufacturers to adopt eco-friendly materials and manufacturing processes. Intense competition among established and emerging companies is spurring innovation and price optimization, providing a diverse range of smart packaging solutions across various price points. Market penetration of smart packaging solutions is estimated to reach xx% by 2033.
Dominant Markets & Segments in Smart Packaging Industry
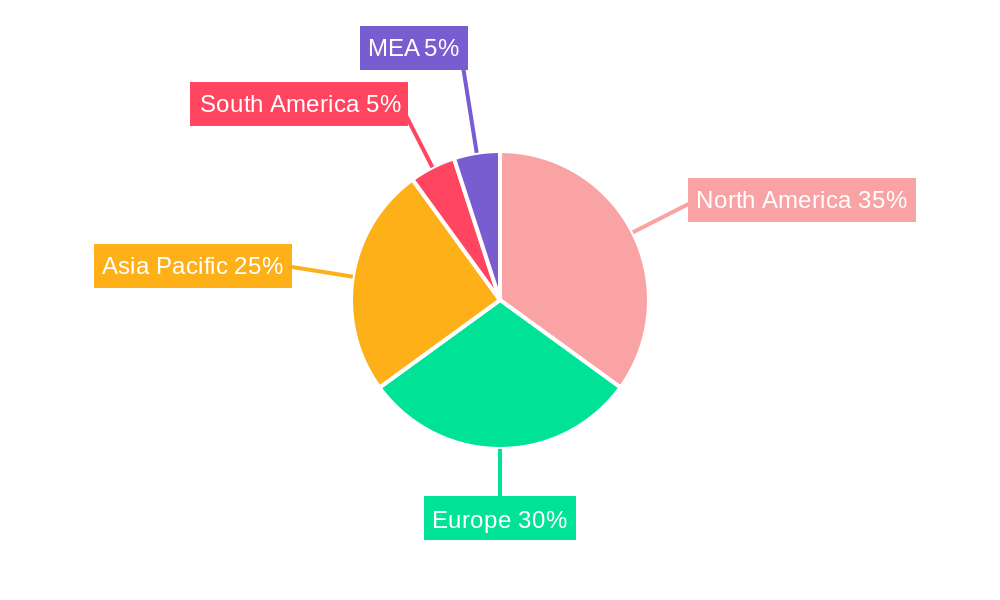
The North American region currently holds the largest market share, followed by Europe and Asia-Pacific. This dominance stems from high consumer spending power, robust infrastructure, and the early adoption of smart packaging technologies. Within the technological segments, Intelligent Packaging dominates due to its advanced functionalities and ability to provide real-time information on product condition and location. The Food and Beverage industry is the largest end-user vertical, driven by the increasing demand for food safety and traceability.
- Dominant Region: North America
- Leading Technology Segment: Intelligent Packaging
- Largest End-User Vertical: Food & Beverage
Key Drivers for North American Dominance:
- High consumer disposable income
- Advanced technological infrastructure
- Stringent regulatory frameworks promoting smart packaging
- Early adoption of innovative packaging solutions
Key Drivers for Intelligent Packaging Segment:
- Enhanced product safety and traceability
- Improved supply chain visibility and efficiency
- Growing demand for personalized consumer experiences
Key Drivers for Food and Beverage End-User Vertical:
- Stringent food safety regulations
- Growing consumer demand for freshness and authenticity
- Need for efficient supply chain management
Smart Packaging Industry Product Developments
Recent product innovations include the integration of sensors for real-time temperature and humidity monitoring, RFID tags for enhanced traceability and anti-counterfeiting measures, and time-temperature indicators to ensure product safety. These advancements offer enhanced product quality, improved supply chain efficiency, and reduced product waste. Companies are focusing on developing sustainable and eco-friendly packaging solutions to meet the growing consumer demand for environmentally conscious products. The integration of digital technologies such as augmented reality (AR) and QR codes enhances consumer engagement and product information accessibility.
Report Scope & Segmentation Analysis
This report provides a comprehensive segmentation analysis of the smart packaging market, categorized by technology (Active Packaging and Intelligent Packaging) and end-user vertical (Food, Beverage, Healthcare, Personal Care, and Other End-User Verticals). Each segment's growth projections, market size, and competitive landscape are analyzed. Active Packaging focuses on extending shelf life, while Intelligent Packaging provides additional functionalities like tracking and real-time information. The food and beverage industry dominates due to its scale and stringent safety regulations. Healthcare and personal care industries also contribute significantly, emphasizing product authenticity and security. The “Other” segment shows xx Million USD market value in 2025 and xx Million USD projected in 2033.
Key Drivers of Smart Packaging Industry Growth
Several factors drive the growth of the smart packaging industry. Technological advancements in sensor technology, RFID, and data analytics offer improved product safety, traceability, and supply chain efficiency. The rising adoption of e-commerce necessitates effective supply chain management, increasing the demand for smart packaging solutions. Growing consumer awareness of product authenticity and safety is also a key driver, with consumers increasingly valuing the information and convenience provided by smart packaging. Stringent government regulations concerning food safety and product traceability are pushing industries towards adopting smart packaging solutions.
Challenges in the Smart Packaging Industry Sector
The smart packaging industry faces several challenges, including high initial investment costs associated with implementing smart packaging technologies. Supply chain disruptions and the complexity of integrating different technologies across the supply chain also pose significant hurdles. Regulatory compliance and standardization issues can create uncertainty and hinder market expansion. The potential for data security breaches and privacy concerns related to data collection and storage need careful consideration. Intense competition among established and emerging players leads to price pressure and margin compression.
Emerging Opportunities in Smart Packaging Industry
The smart packaging market presents a wealth of opportunities. The escalating demand for sustainable and eco-friendly packaging solutions creates a significant opportunity for businesses to develop and market innovative, recyclable, and compostable packaging materials. The integration of advanced technologies, including AI and IoT, unlocks new avenues for improved product traceability, real-time monitoring, and personalized consumer interactions. Expansion into new and emerging markets, especially in developing economies, offers substantial growth potential. The increasing consumer desire for personalized and interactive packaging experiences provides further opportunities for businesses to differentiate themselves and enhance customer engagement.
Leading Players in the Smart Packaging Industry Market
Key Developments in Smart Packaging Industry Industry
- January 2023: Avery Dennison announced a significant investment (over USD 100 Million) to expand its RFID manufacturing capacity in Mexico, aiming to become the world's leading RFID provider and enhance supply chain transparency globally.
- March 2023: Amcor partnered with NfiniteNanotechnology Inc. to conduct research into groundbreaking nanocoating technology to enhance the recyclability and compostability of packaging materials.
- [Add more recent key developments here with dates and brief descriptions]
Strategic Outlook for Smart Packaging Industry Market
The smart packaging market is poised for substantial growth, driven by technological innovation, the rising consumer demand for sustainable and convenient packaging, and increasingly stringent regulatory requirements. The integration of sophisticated technologies, such as AI and IoT, will further amplify product traceability, supply chain visibility, and consumer engagement. Companies that effectively adapt to the dynamic market landscape and successfully cater to evolving consumer needs will be ideally positioned to capitalize on significant growth opportunities. The escalating focus on sustainability and eco-friendly packaging solutions will continue to profoundly shape future market trends and dynamics.
Smart Packaging Industry Segmentation
-
1. Technology
- 1.1. Active Packaging
- 1.2. Intelligent Packaging
-
2. End-user Vertical
- 2.1. Food
- 2.2. Beverage
- 2.3. Healthcare
- 2.4. Personal Care
- 2.5. Other End-user Verticals
Smart Packaging Industry Segmentation By Geography
-
1. North America
- 1.1. United States
- 1.2. Canada
-
2. Europe
- 2.1. Germany
- 2.2. United Kingdom
- 2.3. France
- 2.4. Rest of Europe
-
3. Asia Pacific
- 3.1. China
- 3.2. Japan
- 3.3. India
- 3.4. Rest of Asia Pacific
- 4. Latin America
- 5. Middle East and Africa
Smart Packaging Industry Regional Market Share
Geographic Coverage of Smart Packaging Industry
Smart Packaging Industry REPORT HIGHLIGHTS
| Aspects | Details |
|---|---|
| Study Period | 2020-2034 |
| Base Year | 2025 |
| Estimated Year | 2026 |
| Forecast Period | 2026-2034 |
| Historical Period | 2020-2025 |
| Growth Rate | CAGR of 7.12% from 2020-2034 |
| Segmentation |
|
Table of Contents
- 1. Introduction
- 1.1. Research Scope
- 1.2. Market Segmentation
- 1.3. Research Objective
- 1.4. Definitions and Assumptions
- 2. Executive Summary
- 2.1. Market Snapshot
- 3. Market Dynamics
- 3.1. Market Drivers
- 3.2. Market Restrains
- 3.3. Market Trends
- 3.4. Market Opportunities
- 4. Market Factor Analysis
- 4.1. Porters Five Forces
- 4.1.1. Bargaining Power of Suppliers
- 4.1.2. Bargaining Power of Buyers
- 4.1.3. Threat of New Entrants
- 4.1.4. Threat of Substitutes
- 4.1.5. Competitive Rivalry
- 4.2. PESTEL analysis
- 4.3. BCG Analysis
- 4.3.1. Stars (High Growth, High Market Share)
- 4.3.2. Cash Cows (Low Growth, High Market Share)
- 4.3.3. Question Mark (High Growth, Low Market Share)
- 4.3.4. Dogs (Low Growth, Low Market Share)
- 4.4. Ansoff Matrix Analysis
- 4.5. Supply Chain Analysis
- 4.6. Regulatory Landscape
- 4.7. Current Market Potential and Opportunity Assessment (TAM–SAM–SOM Framework)
- 4.8. RAX Analyst Note
- 4.1. Porters Five Forces
- 5. Market Analysis, Insights and Forecast 2021-2033
- 5.1. Market Analysis, Insights and Forecast - by Technology
- 5.1.1. Active Packaging
- 5.1.2. Intelligent Packaging
- 5.2. Market Analysis, Insights and Forecast - by End-user Vertical
- 5.2.1. Food
- 5.2.2. Beverage
- 5.2.3. Healthcare
- 5.2.4. Personal Care
- 5.2.5. Other End-user Verticals
- 5.3. Market Analysis, Insights and Forecast - by Region
- 5.3.1. North America
- 5.3.2. Europe
- 5.3.3. Asia Pacific
- 5.3.4. Latin America
- 5.3.5. Middle East and Africa
- 5.1. Market Analysis, Insights and Forecast - by Technology
- 6. Global Smart Packaging Industry Analysis, Insights and Forecast, 2021-2033
- 6.1. Market Analysis, Insights and Forecast - by Technology
- 6.1.1. Active Packaging
- 6.1.2. Intelligent Packaging
- 6.2. Market Analysis, Insights and Forecast - by End-user Vertical
- 6.2.1. Food
- 6.2.2. Beverage
- 6.2.3. Healthcare
- 6.2.4. Personal Care
- 6.2.5. Other End-user Verticals
- 6.1. Market Analysis, Insights and Forecast - by Technology
- 7. North America Smart Packaging Industry Analysis, Insights and Forecast, 2020-2032
- 7.1. Market Analysis, Insights and Forecast - by Technology
- 7.1.1. Active Packaging
- 7.1.2. Intelligent Packaging
- 7.2. Market Analysis, Insights and Forecast - by End-user Vertical
- 7.2.1. Food
- 7.2.2. Beverage
- 7.2.3. Healthcare
- 7.2.4. Personal Care
- 7.2.5. Other End-user Verticals
- 7.1. Market Analysis, Insights and Forecast - by Technology
- 8. Europe Smart Packaging Industry Analysis, Insights and Forecast, 2020-2032
- 8.1. Market Analysis, Insights and Forecast - by Technology
- 8.1.1. Active Packaging
- 8.1.2. Intelligent Packaging
- 8.2. Market Analysis, Insights and Forecast - by End-user Vertical
- 8.2.1. Food
- 8.2.2. Beverage
- 8.2.3. Healthcare
- 8.2.4. Personal Care
- 8.2.5. Other End-user Verticals
- 8.1. Market Analysis, Insights and Forecast - by Technology
- 9. Asia Pacific Smart Packaging Industry Analysis, Insights and Forecast, 2020-2032
- 9.1. Market Analysis, Insights and Forecast - by Technology
- 9.1.1. Active Packaging
- 9.1.2. Intelligent Packaging
- 9.2. Market Analysis, Insights and Forecast - by End-user Vertical
- 9.2.1. Food
- 9.2.2. Beverage
- 9.2.3. Healthcare
- 9.2.4. Personal Care
- 9.2.5. Other End-user Verticals
- 9.1. Market Analysis, Insights and Forecast - by Technology
- 10. Latin America Smart Packaging Industry Analysis, Insights and Forecast, 2020-2032
- 10.1. Market Analysis, Insights and Forecast - by Technology
- 10.1.1. Active Packaging
- 10.1.2. Intelligent Packaging
- 10.2. Market Analysis, Insights and Forecast - by End-user Vertical
- 10.2.1. Food
- 10.2.2. Beverage
- 10.2.3. Healthcare
- 10.2.4. Personal Care
- 10.2.5. Other End-user Verticals
- 10.1. Market Analysis, Insights and Forecast - by Technology
- 11. Middle East and Africa Smart Packaging Industry Analysis, Insights and Forecast, 2020-2032
- 11.1. Market Analysis, Insights and Forecast - by Technology
- 11.1.1. Active Packaging
- 11.1.2. Intelligent Packaging
- 11.2. Market Analysis, Insights and Forecast - by End-user Vertical
- 11.2.1. Food
- 11.2.2. Beverage
- 11.2.3. Healthcare
- 11.2.4. Personal Care
- 11.2.5. Other End-user Verticals
- 11.1. Market Analysis, Insights and Forecast - by Technology
- 12. Competitive Analysis
- 12.1. Company Profiles
- 12.1.1 Stora Enso
- 12.1.1.1. Company Overview
- 12.1.1.2. Products
- 12.1.1.3. Company Financials
- 12.1.1.4. SWOT Analysis
- 12.1.2 BASF SE
- 12.1.2.1. Company Overview
- 12.1.2.2. Products
- 12.1.2.3. Company Financials
- 12.1.2.4. SWOT Analysis
- 12.1.3 3M Company
- 12.1.3.1. Company Overview
- 12.1.3.2. Products
- 12.1.3.3. Company Financials
- 12.1.3.4. SWOT Analysis
- 12.1.4 Ball corporation
- 12.1.4.1. Company Overview
- 12.1.4.2. Products
- 12.1.4.3. Company Financials
- 12.1.4.4. SWOT Analysis
- 12.1.5 International Paper Compan
- 12.1.5.1. Company Overview
- 12.1.5.2. Products
- 12.1.5.3. Company Financials
- 12.1.5.4. SWOT Analysis
- 12.1.6 Amcor PLC
- 12.1.6.1. Company Overview
- 12.1.6.2. Products
- 12.1.6.3. Company Financials
- 12.1.6.4. SWOT Analysis
- 12.1.7 Avery Dennison Corporation
- 12.1.7.1. Company Overview
- 12.1.7.2. Products
- 12.1.7.3. Company Financials
- 12.1.7.4. SWOT Analysis
- 12.1.8 Huhtamaki OYJ
- 12.1.8.1. Company Overview
- 12.1.8.2. Products
- 12.1.8.3. Company Financials
- 12.1.8.4. SWOT Analysis
- 12.1.9 Zebra Technologies Corporation
- 12.1.9.1. Company Overview
- 12.1.9.2. Products
- 12.1.9.3. Company Financials
- 12.1.9.4. SWOT Analysis
- 12.1.10 Sealed Air Corporation
- 12.1.10.1. Company Overview
- 12.1.10.2. Products
- 12.1.10.3. Company Financials
- 12.1.10.4. SWOT Analysis
- 12.1.1 Stora Enso
- 12.2. Market Entropy
- 12.2.1 Company's Key Areas Served
- 12.2.2 Recent Developments
- 12.3. Company Market Share Analysis 2025
- 12.3.1 Top 5 Companies Market Share Analysis
- 12.3.2 Top 3 Companies Market Share Analysis
- 12.4. List of Potential Customers
- 13. Research Methodology
List of Figures
- Figure 1: Global Smart Packaging Industry Revenue Breakdown (Million, %) by Region 2025 & 2033
- Figure 2: North America Smart Packaging Industry Revenue (Million), by Technology 2025 & 2033
- Figure 3: North America Smart Packaging Industry Revenue Share (%), by Technology 2025 & 2033
- Figure 4: North America Smart Packaging Industry Revenue (Million), by End-user Vertical 2025 & 2033
- Figure 5: North America Smart Packaging Industry Revenue Share (%), by End-user Vertical 2025 & 2033
- Figure 6: North America Smart Packaging Industry Revenue (Million), by Country 2025 & 2033
- Figure 7: North America Smart Packaging Industry Revenue Share (%), by Country 2025 & 2033
- Figure 8: Europe Smart Packaging Industry Revenue (Million), by Technology 2025 & 2033
- Figure 9: Europe Smart Packaging Industry Revenue Share (%), by Technology 2025 & 2033
- Figure 10: Europe Smart Packaging Industry Revenue (Million), by End-user Vertical 2025 & 2033
- Figure 11: Europe Smart Packaging Industry Revenue Share (%), by End-user Vertical 2025 & 2033
- Figure 12: Europe Smart Packaging Industry Revenue (Million), by Country 2025 & 2033
- Figure 13: Europe Smart Packaging Industry Revenue Share (%), by Country 2025 & 2033
- Figure 14: Asia Pacific Smart Packaging Industry Revenue (Million), by Technology 2025 & 2033
- Figure 15: Asia Pacific Smart Packaging Industry Revenue Share (%), by Technology 2025 & 2033
- Figure 16: Asia Pacific Smart Packaging Industry Revenue (Million), by End-user Vertical 2025 & 2033
- Figure 17: Asia Pacific Smart Packaging Industry Revenue Share (%), by End-user Vertical 2025 & 2033
- Figure 18: Asia Pacific Smart Packaging Industry Revenue (Million), by Country 2025 & 2033
- Figure 19: Asia Pacific Smart Packaging Industry Revenue Share (%), by Country 2025 & 2033
- Figure 20: Latin America Smart Packaging Industry Revenue (Million), by Technology 2025 & 2033
- Figure 21: Latin America Smart Packaging Industry Revenue Share (%), by Technology 2025 & 2033
- Figure 22: Latin America Smart Packaging Industry Revenue (Million), by End-user Vertical 2025 & 2033
- Figure 23: Latin America Smart Packaging Industry Revenue Share (%), by End-user Vertical 2025 & 2033
- Figure 24: Latin America Smart Packaging Industry Revenue (Million), by Country 2025 & 2033
- Figure 25: Latin America Smart Packaging Industry Revenue Share (%), by Country 2025 & 2033
- Figure 26: Middle East and Africa Smart Packaging Industry Revenue (Million), by Technology 2025 & 2033
- Figure 27: Middle East and Africa Smart Packaging Industry Revenue Share (%), by Technology 2025 & 2033
- Figure 28: Middle East and Africa Smart Packaging Industry Revenue (Million), by End-user Vertical 2025 & 2033
- Figure 29: Middle East and Africa Smart Packaging Industry Revenue Share (%), by End-user Vertical 2025 & 2033
- Figure 30: Middle East and Africa Smart Packaging Industry Revenue (Million), by Country 2025 & 2033
- Figure 31: Middle East and Africa Smart Packaging Industry Revenue Share (%), by Country 2025 & 2033
List of Tables
- Table 1: Global Smart Packaging Industry Revenue Million Forecast, by Technology 2020 & 2033
- Table 2: Global Smart Packaging Industry Revenue Million Forecast, by End-user Vertical 2020 & 2033
- Table 3: Global Smart Packaging Industry Revenue Million Forecast, by Region 2020 & 2033
- Table 4: Global Smart Packaging Industry Revenue Million Forecast, by Technology 2020 & 2033
- Table 5: Global Smart Packaging Industry Revenue Million Forecast, by End-user Vertical 2020 & 2033
- Table 6: Global Smart Packaging Industry Revenue Million Forecast, by Country 2020 & 2033
- Table 7: United States Smart Packaging Industry Revenue (Million) Forecast, by Application 2020 & 2033
- Table 8: Canada Smart Packaging Industry Revenue (Million) Forecast, by Application 2020 & 2033
- Table 9: Global Smart Packaging Industry Revenue Million Forecast, by Technology 2020 & 2033
- Table 10: Global Smart Packaging Industry Revenue Million Forecast, by End-user Vertical 2020 & 2033
- Table 11: Global Smart Packaging Industry Revenue Million Forecast, by Country 2020 & 2033
- Table 12: Germany Smart Packaging Industry Revenue (Million) Forecast, by Application 2020 & 2033
- Table 13: United Kingdom Smart Packaging Industry Revenue (Million) Forecast, by Application 2020 & 2033
- Table 14: France Smart Packaging Industry Revenue (Million) Forecast, by Application 2020 & 2033
- Table 15: Rest of Europe Smart Packaging Industry Revenue (Million) Forecast, by Application 2020 & 2033
- Table 16: Global Smart Packaging Industry Revenue Million Forecast, by Technology 2020 & 2033
- Table 17: Global Smart Packaging Industry Revenue Million Forecast, by End-user Vertical 2020 & 2033
- Table 18: Global Smart Packaging Industry Revenue Million Forecast, by Country 2020 & 2033
- Table 19: China Smart Packaging Industry Revenue (Million) Forecast, by Application 2020 & 2033
- Table 20: Japan Smart Packaging Industry Revenue (Million) Forecast, by Application 2020 & 2033
- Table 21: India Smart Packaging Industry Revenue (Million) Forecast, by Application 2020 & 2033
- Table 22: Rest of Asia Pacific Smart Packaging Industry Revenue (Million) Forecast, by Application 2020 & 2033
- Table 23: Global Smart Packaging Industry Revenue Million Forecast, by Technology 2020 & 2033
- Table 24: Global Smart Packaging Industry Revenue Million Forecast, by End-user Vertical 2020 & 2033
- Table 25: Global Smart Packaging Industry Revenue Million Forecast, by Country 2020 & 2033
- Table 26: Global Smart Packaging Industry Revenue Million Forecast, by Technology 2020 & 2033
- Table 27: Global Smart Packaging Industry Revenue Million Forecast, by End-user Vertical 2020 & 2033
- Table 28: Global Smart Packaging Industry Revenue Million Forecast, by Country 2020 & 2033
Frequently Asked Questions
1. What is the projected Compound Annual Growth Rate (CAGR) of the Smart Packaging Industry?
The projected CAGR is approximately 7.12%.
2. Which companies are prominent players in the Smart Packaging Industry?
Key companies in the market include Stora Enso, BASF SE, 3M Company, Ball corporation, International Paper Compan, Amcor PLC, Avery Dennison Corporation, Huhtamaki OYJ, Zebra Technologies Corporation, Sealed Air Corporation.
3. What are the main segments of the Smart Packaging Industry?
The market segments include Technology, End-user Vertical.
4. Can you provide details about the market size?
The market size is estimated to be USD 22.67 Million as of 2022.
5. What are some drivers contributing to market growth?
Advancement in Technology in Food Packaging for Quality Inspection; Rising Awareness Regarding Food Safety; Development in the Printing Industry Due to Various Applications of Smart Packaging.
6. What are the notable trends driving market growth?
Active Packaging to Hold Major Share in the Market.
7. Are there any restraints impacting market growth?
High Costs Due to Initial Requirement.
8. Can you provide examples of recent developments in the market?
March 2023: Amcor, a company that creates and manufactures environment-friendly packaging solutions, announced a joint research project agreement with NfiniteNanotechnology Inc. to validate the application of Nfinite's nanocoating technology to improve packaging that can be recycled and composted.
9. What pricing options are available for accessing the report?
Pricing options include single-user, multi-user, and enterprise licenses priced at USD 4750, USD 5250, and USD 8750 respectively.
10. Is the market size provided in terms of value or volume?
The market size is provided in terms of value, measured in Million.
11. Are there any specific market keywords associated with the report?
Yes, the market keyword associated with the report is "Smart Packaging Industry," which aids in identifying and referencing the specific market segment covered.
12. How do I determine which pricing option suits my needs best?
The pricing options vary based on user requirements and access needs. Individual users may opt for single-user licenses, while businesses requiring broader access may choose multi-user or enterprise licenses for cost-effective access to the report.
13. Are there any additional resources or data provided in the Smart Packaging Industry report?
While the report offers comprehensive insights, it's advisable to review the specific contents or supplementary materials provided to ascertain if additional resources or data are available.
14. How can I stay updated on further developments or reports in the Smart Packaging Industry?
To stay informed about further developments, trends, and reports in the Smart Packaging Industry, consider subscribing to industry newsletters, following relevant companies and organizations, or regularly checking reputable industry news sources and publications.
Methodology
Step 1 - Identification of Relevant Samples Size from Population Database


Step 2 - Approaches for Defining Global Market Size (Value, Volume* & Price*)

Note*: In applicable scenarios
Step 3 - Data Sources
Primary Research
- Web Analytics
- Survey Reports
- Research Institute
- Latest Research Reports
- Opinion Leaders
Secondary Research
- Annual Reports
- White Paper
- Latest Press Release
- Industry Association
- Paid Database
- Investor Presentations

Step 4 - Data Triangulation
Involves using different sources of information in order to increase the validity of a study
These sources are likely to be stakeholders in a program - participants, other researchers, program staff, other community members, and so on.
Then we put all data in single framework & apply various statistical tools to find out the dynamic on the market.
During the analysis stage, feedback from the stakeholder groups would be compared to determine areas of agreement as well as areas of divergence