

Key Insights
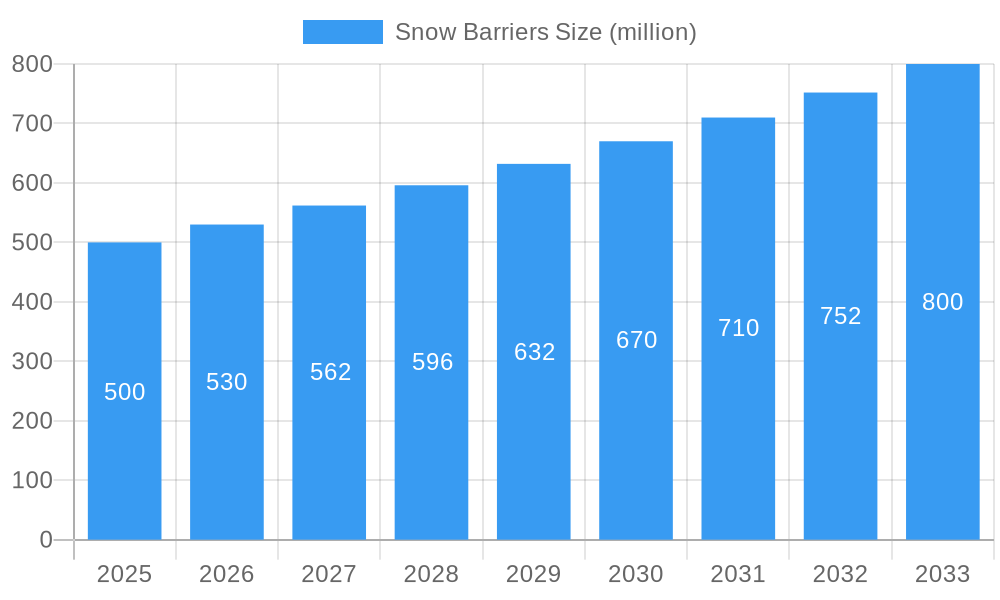
The global snow barrier market is experiencing robust growth, driven by increasing infrastructure development in snow-prone regions, stricter building codes emphasizing safety and structural integrity, and a rising awareness of the dangers of snow accumulation on rooftops and slopes. The market, estimated at $500 million in 2025, is projected to maintain a healthy Compound Annual Growth Rate (CAGR) of 6% from 2025 to 2033, reaching approximately $800 million by 2033. This growth is fueled by several key trends, including the adoption of innovative snow barrier designs utilizing lighter, stronger materials like high-tensile steel and advanced polymers. Furthermore, the integration of smart technologies for monitoring snow load and automated snow removal systems is adding value and driving demand. However, the market faces certain restraints, primarily the high initial investment cost associated with snow barrier installation and potential regional variations in snowfall patterns influencing adoption rates. Market segmentation reveals strong demand across residential, commercial, and industrial sectors, with North America and Europe currently dominating the market share. Key players like Alpine SnowGuards, Beilharz, and Maccaferri are driving innovation and competition within the sector, focusing on product differentiation and expanding their geographical reach.
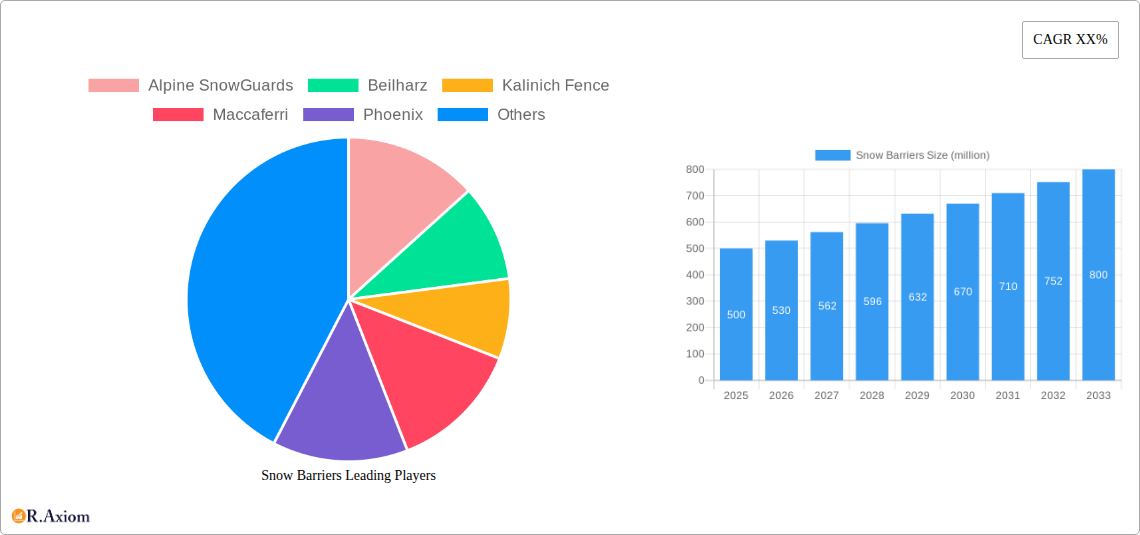
Snow Barriers Market Size (In Million)
The competitive landscape is characterized by a mix of established players and smaller, specialized companies. Established companies are leveraging their extensive experience and distribution networks to maintain market leadership, while smaller firms are focusing on niche applications and technological advancements. Future growth will likely be influenced by government regulations related to snow safety, advancements in material science leading to more effective and aesthetically pleasing barriers, and the increasing adoption of sustainable and environmentally friendly barrier systems. The market’s expansion will be particularly pronounced in regions experiencing increased snowfall frequency or intensity due to climate change, highlighting the importance of robust and reliable snow barrier solutions. The sustained growth trajectory indicates a promising future for the snow barrier market, attracting further investment and innovation in this critical sector for safety and infrastructure protection.
Snow Barriers Company Market Share
Snow Barriers Market Report: 2019-2033 - A Comprehensive Analysis
This comprehensive report provides a detailed analysis of the global snow barriers market, encompassing market size, growth drivers, challenges, and future opportunities from 2019 to 2033. The study period covers the historical period (2019-2024), the base year (2025), and the forecast period (2025-2033). Valuations are expressed in millions of USD. The report offers actionable insights for industry stakeholders, including manufacturers, suppliers, distributors, and investors.
Snow Barriers Market Concentration & Innovation
The global snow barriers market exhibits a moderately concentrated landscape with several key players holding significant market share. In 2025, the top five companies – Alpine SnowGuards, Maccaferri, Rocky Mountain Snow Guards, Tenax Corporation, and SSAB – are estimated to collectively hold approximately xx% of the market share. However, the presence of numerous regional and niche players fosters competition and drives innovation. The market is witnessing significant innovation in material science, leading to the development of lighter, stronger, and more durable snow barriers. Regulatory frameworks, particularly concerning safety and environmental standards, are influencing product design and manufacturing processes. Product substitutes, such as specialized landscaping techniques and snow removal services, present a competitive challenge, but the demand for robust and reliable snow barriers remains strong in high-snowfall regions. End-user trends indicate a growing preference for aesthetically pleasing and easy-to-install solutions. Recent M&A activity in the snow barriers market has been relatively modest, with an estimated total deal value of $xx million in the past five years. These activities primarily focus on expanding geographical reach and product portfolios.
- Market Concentration: Top 5 players holding approximately xx% market share (2025).
- Innovation Drivers: Advances in material science, regulatory pressures, and end-user demands.
- M&A Activity: Total deal value estimated at $xx million (2019-2024).
Snow Barriers Industry Trends & Insights
The global snow barriers market is projected to experience robust growth during the forecast period (2025-2033), with a Compound Annual Growth Rate (CAGR) of xx%. This growth is primarily driven by increasing infrastructure development in snow-prone regions, rising awareness of avalanche safety, and stricter building codes mandating snow barrier installation. Technological advancements, such as the use of high-strength polymers and improved anchoring systems, are enhancing product performance and durability. Consumer preferences are shifting towards aesthetically pleasing and environmentally friendly solutions, creating opportunities for innovative product designs. The competitive landscape is characterized by both price competition and differentiation based on product features, performance, and brand reputation. Market penetration is highest in North America and Europe, while emerging markets in Asia and South America offer significant growth potential.
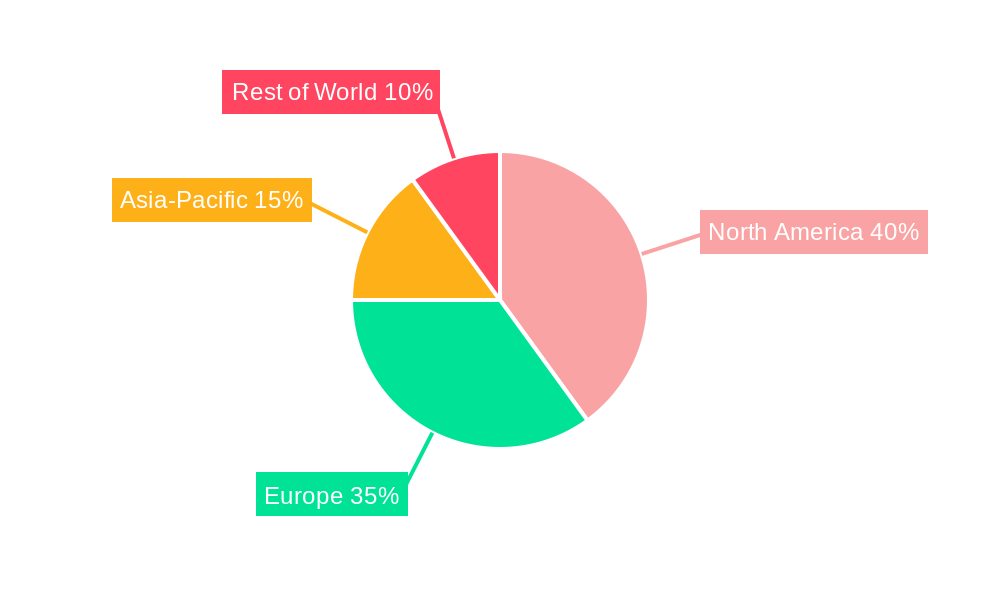
Dominant Markets & Segments in Snow Barriers
North America, particularly the United States and Canada, holds the largest market share in the global snow barriers market. This dominance is attributed to several key factors:
- Stringent building codes and safety regulations: These regulations mandate the use of snow barriers in many high-snowfall areas.
- Extensive infrastructure development: Ongoing construction projects in mountainous regions drive demand for snow barriers.
- High snowfall levels and associated risks: The high incidence of snowstorms and avalanches increases the need for effective snow barrier systems.
- High disposable income and purchasing power: Consumers in North America are more likely to invest in premium snow barrier solutions.
Europe also represents a significant market, driven by similar factors but with variations based on specific national regulations and geographic conditions. The market is segmented by product type (e.g., wire mesh, polymer, metal), application (e.g., residential, commercial, industrial), and end-user (e.g., construction companies, government agencies).
Snow Barriers Product Developments
Recent product innovations in the snow barriers market focus on enhancing durability, ease of installation, and aesthetic appeal. The use of advanced materials such as high-strength polymers and composite materials offers improved performance and resistance to harsh weather conditions. New designs incorporate features that simplify installation, reduce labor costs, and enhance system integration. The market is also witnessing the development of aesthetically pleasing snow barriers that blend seamlessly with the surrounding environment. These innovations contribute to increased market acceptance and enhance the competitive advantage of manufacturers.
Report Scope & Segmentation Analysis
This report provides a comprehensive analysis of the global snow barriers market, segmented by product type, application, and region. The product type segment includes wire mesh, polymer, and metal snow barriers, each with unique characteristics and applications. The application segment covers residential, commercial, and industrial uses, highlighting specific requirements and growth potential within each sector. Regional analysis covers North America, Europe, Asia Pacific, South America, and the Middle East & Africa, offering insights into regional variations in market dynamics. Each segment provides growth projections, market sizes, and detailed competitive analysis, including market share data for key players.
Key Drivers of Snow Barriers Growth
The growth of the snow barriers market is driven by several factors:
- Increasing infrastructure development in mountainous regions: This leads to a greater demand for effective snow protection measures.
- Stringent safety regulations and building codes: These regulations mandate the use of snow barriers in many high-snowfall areas.
- Technological advancements: Improvements in material science and design are leading to more efficient and durable snow barriers.
- Growing awareness of avalanche safety: This increased awareness drives demand for effective snow protection solutions.
Challenges in the Snow Barriers Sector
The snow barriers sector faces several challenges including:
- Fluctuations in raw material prices: This impacts manufacturing costs and profit margins.
- Stringent regulatory compliance requirements: Meeting these standards can be costly and time-consuming.
- Competition from substitute products: Alternative snow management techniques pose a competitive threat.
- Supply chain disruptions: These can lead to delays in manufacturing and project completion.
Emerging Opportunities in Snow Barriers
Emerging opportunities in the snow barriers market include:
- Growing demand in developing countries: Rapid urbanization and infrastructure development in snow-prone regions create significant growth potential.
- Development of smart snow barriers: Integration of sensors and IoT technologies for improved monitoring and control.
- Focus on sustainable and eco-friendly materials: This addresses environmental concerns and offers a competitive advantage.
- Expansion into new applications: This includes protective barriers for solar farms and other infrastructure in snow-prone areas.
Leading Players in the Snow Barriers Market
- Alpine SnowGuards
- Beilharz
- Kalinich Fence
- Maccaferri
- Phoenix
- Rocky Mountain Snow Guards
- WalMax
- Roma Fence Group
- Sno Gem
- SSAB
- Tenax Corporation
Key Developments in Snow Barriers Industry
- 2022, Q4: Maccaferri launched a new line of high-strength polymer snow barriers.
- 2023, Q1: Alpine SnowGuards acquired a smaller competitor, expanding its market presence.
- 2024, Q2: New safety regulations were introduced in several European countries, impacting snow barrier design standards. (Further developments can be added as they occur)
Strategic Outlook for Snow Barriers Market
The global snow barriers market is poised for sustained growth over the forecast period. Continued infrastructure development, increasing awareness of avalanche risks, and the ongoing introduction of innovative products will drive market expansion. Companies focusing on product differentiation, sustainable manufacturing, and strategic partnerships will be well-positioned to capitalize on emerging opportunities. The focus on sustainability and improved installation techniques will continue to shape the market landscape, leading to more efficient, reliable, and environmentally friendly snow barrier solutions.
Snow Barriers Segmentation
-
1. Application
- 1.1. Ski Resort
- 1.2. Transportation and Tunnels
- 1.3. Mountains
- 1.4. Others
-
2. Types
- 2.1. Snow Guards
- 2.2. Snow Fences
- 2.3. Others
Snow Barriers Segmentation By Geography
-
1. North America
- 1.1. United States
- 1.2. Canada
- 1.3. Mexico
-
2. South America
- 2.1. Brazil
- 2.2. Argentina
- 2.3. Rest of South America
-
3. Europe
- 3.1. United Kingdom
- 3.2. Germany
- 3.3. France
- 3.4. Italy
- 3.5. Spain
- 3.6. Russia
- 3.7. Benelux
- 3.8. Nordics
- 3.9. Rest of Europe
-
4. Middle East & Africa
- 4.1. Turkey
- 4.2. Israel
- 4.3. GCC
- 4.4. North Africa
- 4.5. South Africa
- 4.6. Rest of Middle East & Africa
-
5. Asia Pacific
- 5.1. China
- 5.2. India
- 5.3. Japan
- 5.4. South Korea
- 5.5. ASEAN
- 5.6. Oceania
- 5.7. Rest of Asia Pacific
Snow Barriers Regional Market Share
Geographic Coverage of Snow Barriers
Snow Barriers REPORT HIGHLIGHTS
| Aspects | Details |
|---|---|
| Study Period | 2020-2034 |
| Base Year | 2025 |
| Estimated Year | 2026 |
| Forecast Period | 2026-2034 |
| Historical Period | 2020-2025 |
| Growth Rate | CAGR of XX% from 2020-2034 |
| Segmentation |
|
Table of Contents
- 1. Introduction
- 1.1. Research Scope
- 1.2. Market Segmentation
- 1.3. Research Methodology
- 1.4. Definitions and Assumptions
- 2. Executive Summary
- 2.1. Introduction
- 3. Market Dynamics
- 3.1. Introduction
- 3.2. Market Drivers
- 3.3. Market Restrains
- 3.4. Market Trends
- 4. Market Factor Analysis
- 4.1. Porters Five Forces
- 4.2. Supply/Value Chain
- 4.3. PESTEL analysis
- 4.4. Market Entropy
- 4.5. Patent/Trademark Analysis
- 5. Global Snow Barriers Analysis, Insights and Forecast, 2020-2032
- 5.1. Market Analysis, Insights and Forecast - by Application
- 5.1.1. Ski Resort
- 5.1.2. Transportation and Tunnels
- 5.1.3. Mountains
- 5.1.4. Others
- 5.2. Market Analysis, Insights and Forecast - by Types
- 5.2.1. Snow Guards
- 5.2.2. Snow Fences
- 5.2.3. Others
- 5.3. Market Analysis, Insights and Forecast - by Region
- 5.3.1. North America
- 5.3.2. South America
- 5.3.3. Europe
- 5.3.4. Middle East & Africa
- 5.3.5. Asia Pacific
- 5.1. Market Analysis, Insights and Forecast - by Application
- 6. North America Snow Barriers Analysis, Insights and Forecast, 2020-2032
- 6.1. Market Analysis, Insights and Forecast - by Application
- 6.1.1. Ski Resort
- 6.1.2. Transportation and Tunnels
- 6.1.3. Mountains
- 6.1.4. Others
- 6.2. Market Analysis, Insights and Forecast - by Types
- 6.2.1. Snow Guards
- 6.2.2. Snow Fences
- 6.2.3. Others
- 6.1. Market Analysis, Insights and Forecast - by Application
- 7. South America Snow Barriers Analysis, Insights and Forecast, 2020-2032
- 7.1. Market Analysis, Insights and Forecast - by Application
- 7.1.1. Ski Resort
- 7.1.2. Transportation and Tunnels
- 7.1.3. Mountains
- 7.1.4. Others
- 7.2. Market Analysis, Insights and Forecast - by Types
- 7.2.1. Snow Guards
- 7.2.2. Snow Fences
- 7.2.3. Others
- 7.1. Market Analysis, Insights and Forecast - by Application
- 8. Europe Snow Barriers Analysis, Insights and Forecast, 2020-2032
- 8.1. Market Analysis, Insights and Forecast - by Application
- 8.1.1. Ski Resort
- 8.1.2. Transportation and Tunnels
- 8.1.3. Mountains
- 8.1.4. Others
- 8.2. Market Analysis, Insights and Forecast - by Types
- 8.2.1. Snow Guards
- 8.2.2. Snow Fences
- 8.2.3. Others
- 8.1. Market Analysis, Insights and Forecast - by Application
- 9. Middle East & Africa Snow Barriers Analysis, Insights and Forecast, 2020-2032
- 9.1. Market Analysis, Insights and Forecast - by Application
- 9.1.1. Ski Resort
- 9.1.2. Transportation and Tunnels
- 9.1.3. Mountains
- 9.1.4. Others
- 9.2. Market Analysis, Insights and Forecast - by Types
- 9.2.1. Snow Guards
- 9.2.2. Snow Fences
- 9.2.3. Others
- 9.1. Market Analysis, Insights and Forecast - by Application
- 10. Asia Pacific Snow Barriers Analysis, Insights and Forecast, 2020-2032
- 10.1. Market Analysis, Insights and Forecast - by Application
- 10.1.1. Ski Resort
- 10.1.2. Transportation and Tunnels
- 10.1.3. Mountains
- 10.1.4. Others
- 10.2. Market Analysis, Insights and Forecast - by Types
- 10.2.1. Snow Guards
- 10.2.2. Snow Fences
- 10.2.3. Others
- 10.1. Market Analysis, Insights and Forecast - by Application
- 11. Competitive Analysis
- 11.1. Global Market Share Analysis 2025
- 11.2. Company Profiles
- 11.2.1 Alpine SnowGuards
- 11.2.1.1. Overview
- 11.2.1.2. Products
- 11.2.1.3. SWOT Analysis
- 11.2.1.4. Recent Developments
- 11.2.1.5. Financials (Based on Availability)
- 11.2.2 Beilharz
- 11.2.2.1. Overview
- 11.2.2.2. Products
- 11.2.2.3. SWOT Analysis
- 11.2.2.4. Recent Developments
- 11.2.2.5. Financials (Based on Availability)
- 11.2.3 Kalinich Fence
- 11.2.3.1. Overview
- 11.2.3.2. Products
- 11.2.3.3. SWOT Analysis
- 11.2.3.4. Recent Developments
- 11.2.3.5. Financials (Based on Availability)
- 11.2.4 Maccaferri
- 11.2.4.1. Overview
- 11.2.4.2. Products
- 11.2.4.3. SWOT Analysis
- 11.2.4.4. Recent Developments
- 11.2.4.5. Financials (Based on Availability)
- 11.2.5 Phoenix
- 11.2.5.1. Overview
- 11.2.5.2. Products
- 11.2.5.3. SWOT Analysis
- 11.2.5.4. Recent Developments
- 11.2.5.5. Financials (Based on Availability)
- 11.2.6 Rocky Mountain Snow Guards
- 11.2.6.1. Overview
- 11.2.6.2. Products
- 11.2.6.3. SWOT Analysis
- 11.2.6.4. Recent Developments
- 11.2.6.5. Financials (Based on Availability)
- 11.2.7 WalMax
- 11.2.7.1. Overview
- 11.2.7.2. Products
- 11.2.7.3. SWOT Analysis
- 11.2.7.4. Recent Developments
- 11.2.7.5. Financials (Based on Availability)
- 11.2.8 Roma Fence Group
- 11.2.8.1. Overview
- 11.2.8.2. Products
- 11.2.8.3. SWOT Analysis
- 11.2.8.4. Recent Developments
- 11.2.8.5. Financials (Based on Availability)
- 11.2.9 Sno Gem
- 11.2.9.1. Overview
- 11.2.9.2. Products
- 11.2.9.3. SWOT Analysis
- 11.2.9.4. Recent Developments
- 11.2.9.5. Financials (Based on Availability)
- 11.2.10 SSAB
- 11.2.10.1. Overview
- 11.2.10.2. Products
- 11.2.10.3. SWOT Analysis
- 11.2.10.4. Recent Developments
- 11.2.10.5. Financials (Based on Availability)
- 11.2.11 Tenax Corporation
- 11.2.11.1. Overview
- 11.2.11.2. Products
- 11.2.11.3. SWOT Analysis
- 11.2.11.4. Recent Developments
- 11.2.11.5. Financials (Based on Availability)
- 11.2.1 Alpine SnowGuards
List of Figures
- Figure 1: Global Snow Barriers Revenue Breakdown (million, %) by Region 2025 & 2033
- Figure 2: Global Snow Barriers Volume Breakdown (K, %) by Region 2025 & 2033
- Figure 3: North America Snow Barriers Revenue (million), by Application 2025 & 2033
- Figure 4: North America Snow Barriers Volume (K), by Application 2025 & 2033
- Figure 5: North America Snow Barriers Revenue Share (%), by Application 2025 & 2033
- Figure 6: North America Snow Barriers Volume Share (%), by Application 2025 & 2033
- Figure 7: North America Snow Barriers Revenue (million), by Types 2025 & 2033
- Figure 8: North America Snow Barriers Volume (K), by Types 2025 & 2033
- Figure 9: North America Snow Barriers Revenue Share (%), by Types 2025 & 2033
- Figure 10: North America Snow Barriers Volume Share (%), by Types 2025 & 2033
- Figure 11: North America Snow Barriers Revenue (million), by Country 2025 & 2033
- Figure 12: North America Snow Barriers Volume (K), by Country 2025 & 2033
- Figure 13: North America Snow Barriers Revenue Share (%), by Country 2025 & 2033
- Figure 14: North America Snow Barriers Volume Share (%), by Country 2025 & 2033
- Figure 15: South America Snow Barriers Revenue (million), by Application 2025 & 2033
- Figure 16: South America Snow Barriers Volume (K), by Application 2025 & 2033
- Figure 17: South America Snow Barriers Revenue Share (%), by Application 2025 & 2033
- Figure 18: South America Snow Barriers Volume Share (%), by Application 2025 & 2033
- Figure 19: South America Snow Barriers Revenue (million), by Types 2025 & 2033
- Figure 20: South America Snow Barriers Volume (K), by Types 2025 & 2033
- Figure 21: South America Snow Barriers Revenue Share (%), by Types 2025 & 2033
- Figure 22: South America Snow Barriers Volume Share (%), by Types 2025 & 2033
- Figure 23: South America Snow Barriers Revenue (million), by Country 2025 & 2033
- Figure 24: South America Snow Barriers Volume (K), by Country 2025 & 2033
- Figure 25: South America Snow Barriers Revenue Share (%), by Country 2025 & 2033
- Figure 26: South America Snow Barriers Volume Share (%), by Country 2025 & 2033
- Figure 27: Europe Snow Barriers Revenue (million), by Application 2025 & 2033
- Figure 28: Europe Snow Barriers Volume (K), by Application 2025 & 2033
- Figure 29: Europe Snow Barriers Revenue Share (%), by Application 2025 & 2033
- Figure 30: Europe Snow Barriers Volume Share (%), by Application 2025 & 2033
- Figure 31: Europe Snow Barriers Revenue (million), by Types 2025 & 2033
- Figure 32: Europe Snow Barriers Volume (K), by Types 2025 & 2033
- Figure 33: Europe Snow Barriers Revenue Share (%), by Types 2025 & 2033
- Figure 34: Europe Snow Barriers Volume Share (%), by Types 2025 & 2033
- Figure 35: Europe Snow Barriers Revenue (million), by Country 2025 & 2033
- Figure 36: Europe Snow Barriers Volume (K), by Country 2025 & 2033
- Figure 37: Europe Snow Barriers Revenue Share (%), by Country 2025 & 2033
- Figure 38: Europe Snow Barriers Volume Share (%), by Country 2025 & 2033
- Figure 39: Middle East & Africa Snow Barriers Revenue (million), by Application 2025 & 2033
- Figure 40: Middle East & Africa Snow Barriers Volume (K), by Application 2025 & 2033
- Figure 41: Middle East & Africa Snow Barriers Revenue Share (%), by Application 2025 & 2033
- Figure 42: Middle East & Africa Snow Barriers Volume Share (%), by Application 2025 & 2033
- Figure 43: Middle East & Africa Snow Barriers Revenue (million), by Types 2025 & 2033
- Figure 44: Middle East & Africa Snow Barriers Volume (K), by Types 2025 & 2033
- Figure 45: Middle East & Africa Snow Barriers Revenue Share (%), by Types 2025 & 2033
- Figure 46: Middle East & Africa Snow Barriers Volume Share (%), by Types 2025 & 2033
- Figure 47: Middle East & Africa Snow Barriers Revenue (million), by Country 2025 & 2033
- Figure 48: Middle East & Africa Snow Barriers Volume (K), by Country 2025 & 2033
- Figure 49: Middle East & Africa Snow Barriers Revenue Share (%), by Country 2025 & 2033
- Figure 50: Middle East & Africa Snow Barriers Volume Share (%), by Country 2025 & 2033
- Figure 51: Asia Pacific Snow Barriers Revenue (million), by Application 2025 & 2033
- Figure 52: Asia Pacific Snow Barriers Volume (K), by Application 2025 & 2033
- Figure 53: Asia Pacific Snow Barriers Revenue Share (%), by Application 2025 & 2033
- Figure 54: Asia Pacific Snow Barriers Volume Share (%), by Application 2025 & 2033
- Figure 55: Asia Pacific Snow Barriers Revenue (million), by Types 2025 & 2033
- Figure 56: Asia Pacific Snow Barriers Volume (K), by Types 2025 & 2033
- Figure 57: Asia Pacific Snow Barriers Revenue Share (%), by Types 2025 & 2033
- Figure 58: Asia Pacific Snow Barriers Volume Share (%), by Types 2025 & 2033
- Figure 59: Asia Pacific Snow Barriers Revenue (million), by Country 2025 & 2033
- Figure 60: Asia Pacific Snow Barriers Volume (K), by Country 2025 & 2033
- Figure 61: Asia Pacific Snow Barriers Revenue Share (%), by Country 2025 & 2033
- Figure 62: Asia Pacific Snow Barriers Volume Share (%), by Country 2025 & 2033
List of Tables
- Table 1: Global Snow Barriers Revenue million Forecast, by Application 2020 & 2033
- Table 2: Global Snow Barriers Volume K Forecast, by Application 2020 & 2033
- Table 3: Global Snow Barriers Revenue million Forecast, by Types 2020 & 2033
- Table 4: Global Snow Barriers Volume K Forecast, by Types 2020 & 2033
- Table 5: Global Snow Barriers Revenue million Forecast, by Region 2020 & 2033
- Table 6: Global Snow Barriers Volume K Forecast, by Region 2020 & 2033
- Table 7: Global Snow Barriers Revenue million Forecast, by Application 2020 & 2033
- Table 8: Global Snow Barriers Volume K Forecast, by Application 2020 & 2033
- Table 9: Global Snow Barriers Revenue million Forecast, by Types 2020 & 2033
- Table 10: Global Snow Barriers Volume K Forecast, by Types 2020 & 2033
- Table 11: Global Snow Barriers Revenue million Forecast, by Country 2020 & 2033
- Table 12: Global Snow Barriers Volume K Forecast, by Country 2020 & 2033
- Table 13: United States Snow Barriers Revenue (million) Forecast, by Application 2020 & 2033
- Table 14: United States Snow Barriers Volume (K) Forecast, by Application 2020 & 2033
- Table 15: Canada Snow Barriers Revenue (million) Forecast, by Application 2020 & 2033
- Table 16: Canada Snow Barriers Volume (K) Forecast, by Application 2020 & 2033
- Table 17: Mexico Snow Barriers Revenue (million) Forecast, by Application 2020 & 2033
- Table 18: Mexico Snow Barriers Volume (K) Forecast, by Application 2020 & 2033
- Table 19: Global Snow Barriers Revenue million Forecast, by Application 2020 & 2033
- Table 20: Global Snow Barriers Volume K Forecast, by Application 2020 & 2033
- Table 21: Global Snow Barriers Revenue million Forecast, by Types 2020 & 2033
- Table 22: Global Snow Barriers Volume K Forecast, by Types 2020 & 2033
- Table 23: Global Snow Barriers Revenue million Forecast, by Country 2020 & 2033
- Table 24: Global Snow Barriers Volume K Forecast, by Country 2020 & 2033
- Table 25: Brazil Snow Barriers Revenue (million) Forecast, by Application 2020 & 2033
- Table 26: Brazil Snow Barriers Volume (K) Forecast, by Application 2020 & 2033
- Table 27: Argentina Snow Barriers Revenue (million) Forecast, by Application 2020 & 2033
- Table 28: Argentina Snow Barriers Volume (K) Forecast, by Application 2020 & 2033
- Table 29: Rest of South America Snow Barriers Revenue (million) Forecast, by Application 2020 & 2033
- Table 30: Rest of South America Snow Barriers Volume (K) Forecast, by Application 2020 & 2033
- Table 31: Global Snow Barriers Revenue million Forecast, by Application 2020 & 2033
- Table 32: Global Snow Barriers Volume K Forecast, by Application 2020 & 2033
- Table 33: Global Snow Barriers Revenue million Forecast, by Types 2020 & 2033
- Table 34: Global Snow Barriers Volume K Forecast, by Types 2020 & 2033
- Table 35: Global Snow Barriers Revenue million Forecast, by Country 2020 & 2033
- Table 36: Global Snow Barriers Volume K Forecast, by Country 2020 & 2033
- Table 37: United Kingdom Snow Barriers Revenue (million) Forecast, by Application 2020 & 2033
- Table 38: United Kingdom Snow Barriers Volume (K) Forecast, by Application 2020 & 2033
- Table 39: Germany Snow Barriers Revenue (million) Forecast, by Application 2020 & 2033
- Table 40: Germany Snow Barriers Volume (K) Forecast, by Application 2020 & 2033
- Table 41: France Snow Barriers Revenue (million) Forecast, by Application 2020 & 2033
- Table 42: France Snow Barriers Volume (K) Forecast, by Application 2020 & 2033
- Table 43: Italy Snow Barriers Revenue (million) Forecast, by Application 2020 & 2033
- Table 44: Italy Snow Barriers Volume (K) Forecast, by Application 2020 & 2033
- Table 45: Spain Snow Barriers Revenue (million) Forecast, by Application 2020 & 2033
- Table 46: Spain Snow Barriers Volume (K) Forecast, by Application 2020 & 2033
- Table 47: Russia Snow Barriers Revenue (million) Forecast, by Application 2020 & 2033
- Table 48: Russia Snow Barriers Volume (K) Forecast, by Application 2020 & 2033
- Table 49: Benelux Snow Barriers Revenue (million) Forecast, by Application 2020 & 2033
- Table 50: Benelux Snow Barriers Volume (K) Forecast, by Application 2020 & 2033
- Table 51: Nordics Snow Barriers Revenue (million) Forecast, by Application 2020 & 2033
- Table 52: Nordics Snow Barriers Volume (K) Forecast, by Application 2020 & 2033
- Table 53: Rest of Europe Snow Barriers Revenue (million) Forecast, by Application 2020 & 2033
- Table 54: Rest of Europe Snow Barriers Volume (K) Forecast, by Application 2020 & 2033
- Table 55: Global Snow Barriers Revenue million Forecast, by Application 2020 & 2033
- Table 56: Global Snow Barriers Volume K Forecast, by Application 2020 & 2033
- Table 57: Global Snow Barriers Revenue million Forecast, by Types 2020 & 2033
- Table 58: Global Snow Barriers Volume K Forecast, by Types 2020 & 2033
- Table 59: Global Snow Barriers Revenue million Forecast, by Country 2020 & 2033
- Table 60: Global Snow Barriers Volume K Forecast, by Country 2020 & 2033
- Table 61: Turkey Snow Barriers Revenue (million) Forecast, by Application 2020 & 2033
- Table 62: Turkey Snow Barriers Volume (K) Forecast, by Application 2020 & 2033
- Table 63: Israel Snow Barriers Revenue (million) Forecast, by Application 2020 & 2033
- Table 64: Israel Snow Barriers Volume (K) Forecast, by Application 2020 & 2033
- Table 65: GCC Snow Barriers Revenue (million) Forecast, by Application 2020 & 2033
- Table 66: GCC Snow Barriers Volume (K) Forecast, by Application 2020 & 2033
- Table 67: North Africa Snow Barriers Revenue (million) Forecast, by Application 2020 & 2033
- Table 68: North Africa Snow Barriers Volume (K) Forecast, by Application 2020 & 2033
- Table 69: South Africa Snow Barriers Revenue (million) Forecast, by Application 2020 & 2033
- Table 70: South Africa Snow Barriers Volume (K) Forecast, by Application 2020 & 2033
- Table 71: Rest of Middle East & Africa Snow Barriers Revenue (million) Forecast, by Application 2020 & 2033
- Table 72: Rest of Middle East & Africa Snow Barriers Volume (K) Forecast, by Application 2020 & 2033
- Table 73: Global Snow Barriers Revenue million Forecast, by Application 2020 & 2033
- Table 74: Global Snow Barriers Volume K Forecast, by Application 2020 & 2033
- Table 75: Global Snow Barriers Revenue million Forecast, by Types 2020 & 2033
- Table 76: Global Snow Barriers Volume K Forecast, by Types 2020 & 2033
- Table 77: Global Snow Barriers Revenue million Forecast, by Country 2020 & 2033
- Table 78: Global Snow Barriers Volume K Forecast, by Country 2020 & 2033
- Table 79: China Snow Barriers Revenue (million) Forecast, by Application 2020 & 2033
- Table 80: China Snow Barriers Volume (K) Forecast, by Application 2020 & 2033
- Table 81: India Snow Barriers Revenue (million) Forecast, by Application 2020 & 2033
- Table 82: India Snow Barriers Volume (K) Forecast, by Application 2020 & 2033
- Table 83: Japan Snow Barriers Revenue (million) Forecast, by Application 2020 & 2033
- Table 84: Japan Snow Barriers Volume (K) Forecast, by Application 2020 & 2033
- Table 85: South Korea Snow Barriers Revenue (million) Forecast, by Application 2020 & 2033
- Table 86: South Korea Snow Barriers Volume (K) Forecast, by Application 2020 & 2033
- Table 87: ASEAN Snow Barriers Revenue (million) Forecast, by Application 2020 & 2033
- Table 88: ASEAN Snow Barriers Volume (K) Forecast, by Application 2020 & 2033
- Table 89: Oceania Snow Barriers Revenue (million) Forecast, by Application 2020 & 2033
- Table 90: Oceania Snow Barriers Volume (K) Forecast, by Application 2020 & 2033
- Table 91: Rest of Asia Pacific Snow Barriers Revenue (million) Forecast, by Application 2020 & 2033
- Table 92: Rest of Asia Pacific Snow Barriers Volume (K) Forecast, by Application 2020 & 2033
Frequently Asked Questions
1. What is the projected Compound Annual Growth Rate (CAGR) of the Snow Barriers?
The projected CAGR is approximately XX%.
2. Which companies are prominent players in the Snow Barriers?
Key companies in the market include Alpine SnowGuards, Beilharz, Kalinich Fence, Maccaferri, Phoenix, Rocky Mountain Snow Guards, WalMax, Roma Fence Group, Sno Gem, SSAB, Tenax Corporation.
3. What are the main segments of the Snow Barriers?
The market segments include Application, Types.
4. Can you provide details about the market size?
The market size is estimated to be USD XXX million as of 2022.
5. What are some drivers contributing to market growth?
N/A
6. What are the notable trends driving market growth?
N/A
7. Are there any restraints impacting market growth?
N/A
8. Can you provide examples of recent developments in the market?
N/A
9. What pricing options are available for accessing the report?
Pricing options include single-user, multi-user, and enterprise licenses priced at USD 3350.00, USD 5025.00, and USD 6700.00 respectively.
10. Is the market size provided in terms of value or volume?
The market size is provided in terms of value, measured in million and volume, measured in K.
11. Are there any specific market keywords associated with the report?
Yes, the market keyword associated with the report is "Snow Barriers," which aids in identifying and referencing the specific market segment covered.
12. How do I determine which pricing option suits my needs best?
The pricing options vary based on user requirements and access needs. Individual users may opt for single-user licenses, while businesses requiring broader access may choose multi-user or enterprise licenses for cost-effective access to the report.
13. Are there any additional resources or data provided in the Snow Barriers report?
While the report offers comprehensive insights, it's advisable to review the specific contents or supplementary materials provided to ascertain if additional resources or data are available.
14. How can I stay updated on further developments or reports in the Snow Barriers?
To stay informed about further developments, trends, and reports in the Snow Barriers, consider subscribing to industry newsletters, following relevant companies and organizations, or regularly checking reputable industry news sources and publications.
Methodology
Step 1 - Identification of Relevant Samples Size from Population Database


Step 2 - Approaches for Defining Global Market Size (Value, Volume* & Price*)

Note*: In applicable scenarios
Step 3 - Data Sources
Primary Research
- Web Analytics
- Survey Reports
- Research Institute
- Latest Research Reports
- Opinion Leaders
Secondary Research
- Annual Reports
- White Paper
- Latest Press Release
- Industry Association
- Paid Database
- Investor Presentations

Step 4 - Data Triangulation
Involves using different sources of information in order to increase the validity of a study
These sources are likely to be stakeholders in a program - participants, other researchers, program staff, other community members, and so on.
Then we put all data in single framework & apply various statistical tools to find out the dynamic on the market.
During the analysis stage, feedback from the stakeholder groups would be compared to determine areas of agreement as well as areas of divergence