
Key Insights
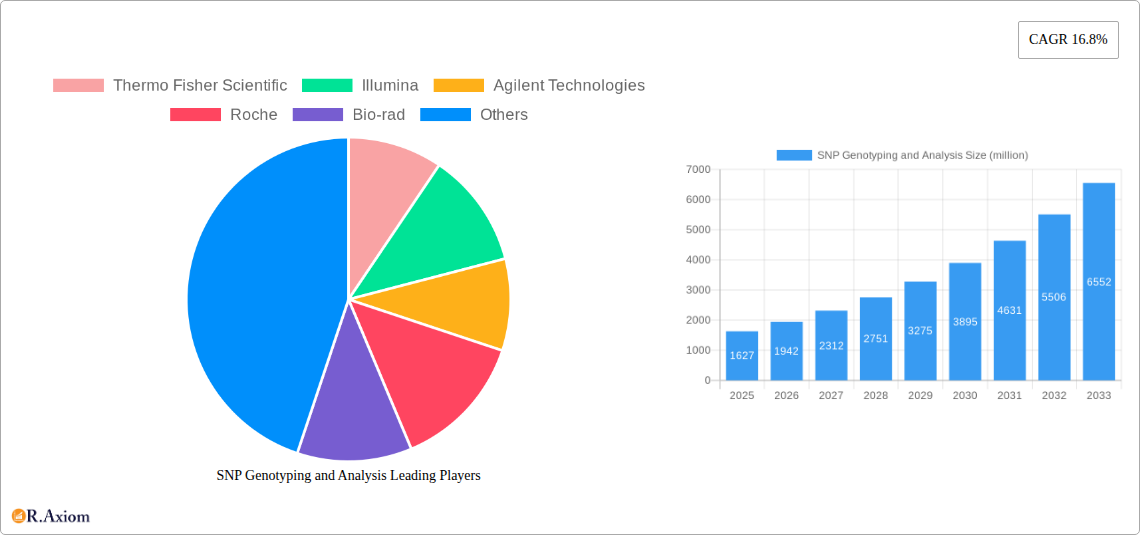
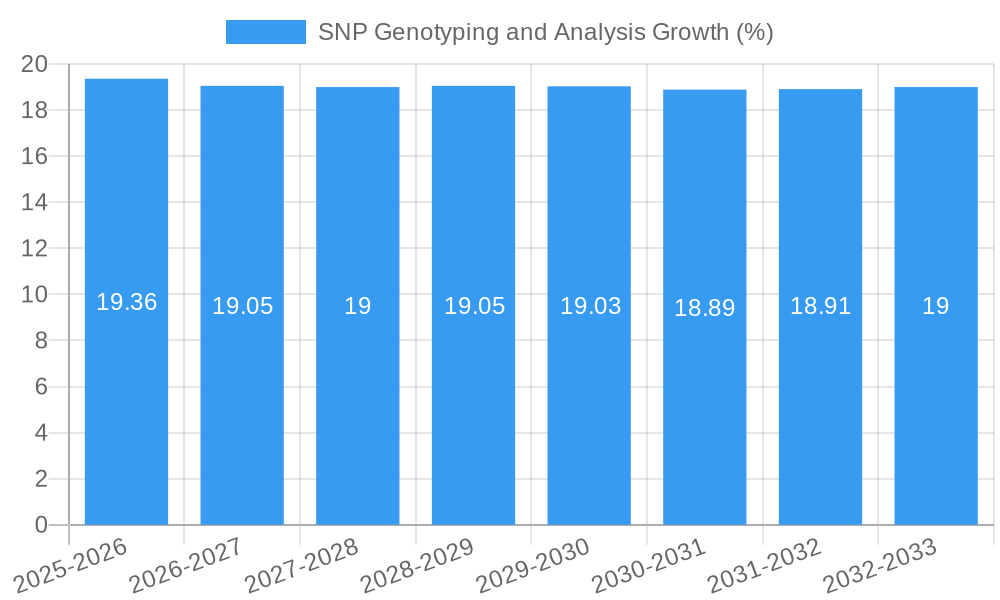
The SNP Genotyping and Analysis market is poised for significant expansion, with a projected market size of USD 1627 million and a robust Compound Annual Growth Rate (CAGR) of 16.8% from 2025 to 2033. This dynamic growth is fueled by an increasing adoption of pharmacogenomics in personalized medicine, driving demand for accurate and efficient SNP genotyping technologies. Pharmaceutical and biotechnology companies are heavily investing in SNP analysis to identify genetic variations that influence drug response, efficacy, and adverse reactions. Furthermore, the burgeoning field of diagnostic research, encompassing disease predisposition studies and early detection, is a major catalyst. The agricultural sector's utilization of SNP genotyping for crop improvement and livestock breeding, enhancing traits like disease resistance and yield, also contributes significantly to market momentum.
Key drivers for this market include advancements in high-throughput SNP genotyping platforms, such as SNP microarrays and molecular beacons, which offer cost-effectiveness and scalability. The growing emphasis on precision agriculture and the need for enhanced food security are further propelling the application of SNP analysis in breeding programs. Restraints, such as the high initial investment cost for advanced genotyping equipment and the need for skilled personnel, are being mitigated by the development of more accessible technologies and increased training initiatives. The market is segmented into diverse applications, with Pharmaceuticals and Pharmacogenomics, and Diagnostic Research representing the largest segments due to their critical role in healthcare innovation. The market is witnessing a surge in innovation, with companies continually developing novel genotyping methodologies and expanding their product portfolios to cater to the evolving needs of researchers and clinicians.
SNP Genotyping and Analysis Market: Comprehensive Research Report
This in-depth report offers a strategic analysis of the global SNP Genotyping and Analysis market, providing critical insights for industry stakeholders. Covering the historical period of 2019-2024 and forecasting through 2033, with a base year of 2025, this report delivers actionable intelligence on market dynamics, trends, and future opportunities.
SNP Genotyping and Analysis Market Concentration & Innovation
The SNP Genotyping and Analysis market exhibits a moderate to high concentration, with key players like Thermo Fisher Scientific, Illumina, and Agilent Technologies holding significant market share, estimated to be around 45% combined. Innovation is a primary driver, fueled by advancements in high-throughput sequencing technologies, bioinformatics, and AI-driven data analysis platforms, projected to boost innovation investments by approximately 20% annually. Regulatory frameworks, particularly in pharmaceuticals and diagnostics, play a crucial role, influencing product development and market entry. The threat of product substitutes, such as whole-genome sequencing for certain applications, is present but offset by the cost-effectiveness and specificity of SNP genotyping for targeted analyses, currently estimated to impact market share by less than 5%. End-user trends highlight a growing demand for personalized medicine and precision agriculture, driving the adoption of SNP-based solutions. Mergers and acquisitions (M&A) are moderately active, with recent deals valued in the hundreds of millions, reflecting a strategic consolidation to expand portfolios and technological capabilities. For instance, a recent M&A of a prominent bioinformatics company by a major instrumentation manufacturer was valued at approximately $750 million.
SNP Genotyping and Analysis Industry Trends & Insights
The global SNP Genotyping and Analysis market is poised for robust expansion, driven by an escalating demand for genetic information across diverse sectors. The market is anticipated to witness a Compound Annual Growth Rate (CAGR) of approximately 12% during the forecast period of 2025–2033. This growth is underpinned by several interconnected trends. Firstly, the increasing prevalence of genetic diseases and the growing emphasis on preventative healthcare are significantly boosting the adoption of SNP genotyping in diagnostic research and personalized medicine. The pharmaceutical sector's investment in pharmacogenomics, aiming to tailor drug treatments based on individual genetic profiles, is another major growth catalyst. This trend is expected to lead to a market penetration of over 60% for SNP-based pharmacogenomic testing in clinical trials by 2030.
Technological disruptions, including the development of more cost-effective and accurate SNP genotyping platforms, such as advanced SNP microarrays and next-generation sequencing (NGS)-based methods, are democratizing access to genetic analysis. The declining cost of sequencing and genotyping, estimated to have decreased by more than 50% over the past five years, is making these technologies accessible to a wider range of research institutions and commercial entities. Consumer preferences are shifting towards proactive health management, with individuals increasingly seeking genetic predispositions for various health conditions. This consumer-driven demand is fueling the growth of direct-to-consumer (DTC) genetic testing services, which utilize SNP genotyping for ancestry, wellness, and health risk assessments.
The competitive dynamics within the industry are characterized by strategic partnerships, technological innovation, and market expansion efforts by leading companies. Companies are focusing on developing user-friendly platforms and comprehensive analytical tools to support researchers and clinicians. The agricultural biotechnology sector is also experiencing significant growth, with SNP genotyping being extensively used for marker-assisted breeding and trait selection in crops and livestock, contributing an estimated 15% of the total market revenue. The animal livestock segment is leveraging SNP analysis for improving breeding efficiency, disease resistance, and overall productivity, with a projected market size exceeding $800 million by 2028. The intricate interplay of these technological advancements, evolving consumer demands, and strategic competitive maneuvers will continue to shape the trajectory of the SNP Genotyping and Analysis market.
Dominant Markets & Segments in SNP Genotyping and Analysis
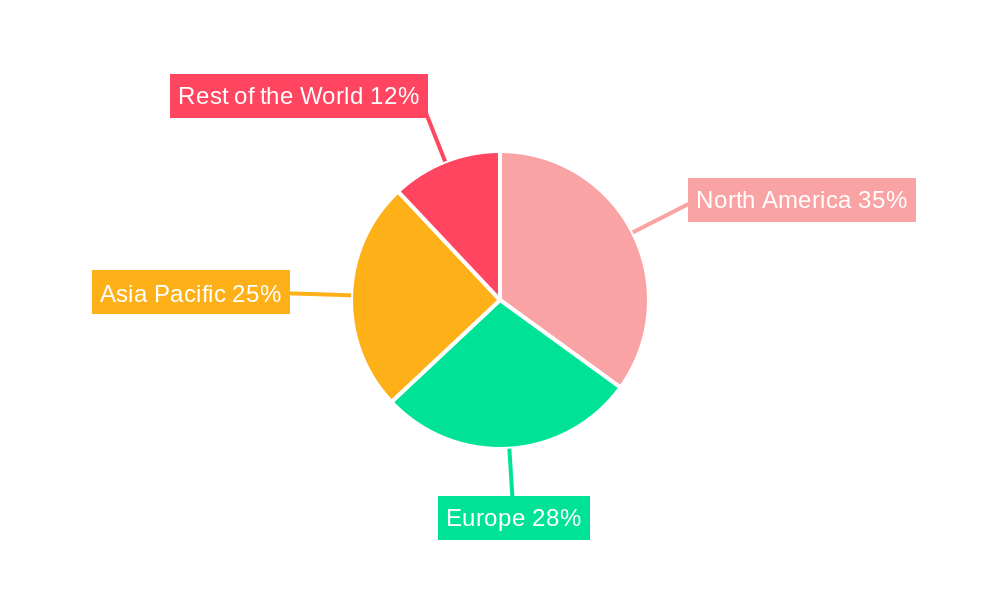
The SNP Genotyping and Analysis market is characterized by distinct regional dominance and segment leadership, driven by a confluence of economic policies, robust research infrastructure, and unmet clinical needs. North America currently holds the largest market share, estimated at 35%, due to substantial investments in pharmaceutical R&D, advanced healthcare systems, and a high prevalence of chronic diseases. The United States, within North America, is a primary contributor, fueled by government funding for genomics research and a well-established biotechnology sector.
Within the applications segment, Pharmaceuticals and Pharmacogenomics represent the most dominant area, accounting for an estimated 40% of the market. This dominance is propelled by the immense demand for personalized medicine, drug discovery and development, and clinical trial optimization. The ability of SNP genotyping to identify genetic variations that influence drug response, efficacy, and adverse reactions makes it indispensable for pharmaceutical companies. Regulatory support from bodies like the FDA for pharmacogenomic applications further solidifies this segment's leadership.
Diagnostic Research follows closely as another significant segment, contributing approximately 30% to the market. The growing application of SNP analysis in diagnosing rare genetic disorders, identifying predispositions to common diseases like cancer and cardiovascular conditions, and enabling early disease detection is a key driver. The expanding use of SNP genotyping in companion diagnostics further strengthens this segment.
The Agricultural Biotechnology segment, while smaller than pharmaceuticals and diagnostics, is experiencing rapid growth, projected to reach a CAGR of 10% over the forecast period. This growth is driven by the need for enhanced crop yields, disease resistance, and climate resilience. SNP genotyping aids in marker-assisted selection (MAS) for superior traits in plants, contributing to global food security. The market for agricultural biotechnology applications is estimated to be around $1.2 billion in 2025.
The Breeding and Animal Livestock segment is also demonstrating strong potential, with a projected market size of $950 million by 2027. SNP analysis is crucial for accelerating breeding programs, improving animal health and productivity, and enhancing disease resistance in livestock, contributing to sustainable animal agriculture.
Regarding technological types, SNP Microarrays currently dominate the market, holding an estimated 55% share, owing to their established reliability, cost-effectiveness for high-throughput genotyping, and widespread adoption in research and clinical settings. However, other technologies are gaining traction. Dynamic Allele-Specific Hybridization (DAsh), while a niche technology, is carving out a space for specific applications requiring high sensitivity and multiplexing capabilities, with its market share projected to grow by 8% annually. Molecular Beacons, known for their real-time detection capabilities, are increasingly integrated into various diagnostic and research assays, contributing an estimated 10% to the overall market, with consistent growth expected.
SNP Genotyping and Analysis Product Developments
The SNP Genotyping and Analysis market is witnessing continuous product innovation driven by the pursuit of higher throughput, increased accuracy, and reduced costs. Companies are focusing on developing advanced SNP microarray platforms offering higher density probes and improved multiplexing capabilities, alongside more sensitive and cost-effective next-generation sequencing (NGS) solutions for SNP discovery and genotyping. Integration of sophisticated bioinformatics tools and AI-powered analytics is enhancing data interpretation and accelerating research outcomes. For example, new assay kits offer enhanced specificity for detecting low-frequency variants, while novel instrumentation provides faster turnaround times for large-scale genotyping projects, catering to the demands of precision medicine and large cohort studies. These advancements are strengthening the competitive advantage of market players by enabling them to offer more comprehensive and efficient solutions.
Report Scope & Segmentation Analysis
This report meticulously segments the SNP Genotyping and Analysis market across key dimensions to provide a granular understanding of its landscape. The market is divided by Application into Pharmaceuticals and Pharmacogenomics, Diagnostic Research, Agricultural Biotechnology, and Breeding and Animal Livestock. The Pharmaceuticals and Pharmacogenomics segment, projected to reach a market size of approximately $7.5 billion by 2033, is driven by personalized drug development. Diagnostic Research is expected to grow to $5.2 billion by 2033, fueled by advancements in genetic testing. Agricultural Biotechnology is forecast to reach $2.3 billion by 2033, supporting sustainable agriculture. Breeding and Animal Livestock is anticipated to expand to $1.8 billion by 2033, enhancing livestock productivity.
By Type, the market is segmented into Dynamic Allele-Specific Hybridization, Molecular Beacons, and SNP Microarrays. SNP Microarrays, currently the largest segment, are projected to maintain their dominance, reaching an estimated $9.1 billion by 2033. Molecular Beacons are expected to grow to $2.1 billion by 2033, driven by their real-time detection capabilities. Dynamic Allele-Specific Hybridization, while smaller, is projected to grow at a CAGR of 9%, indicating its emerging potential in specialized applications.
Key Drivers of SNP Genotyping and Analysis Growth
Several key factors are propelling the growth of the SNP Genotyping and Analysis market. Technological advancements in sequencing and genotyping platforms, leading to increased accuracy, throughput, and reduced costs, are fundamental. The growing demand for personalized medicine and pharmacogenomics in the pharmaceutical sector, enabling tailored drug therapies, is a significant economic driver. Furthermore, the increasing prevalence of genetic disorders and the rising focus on preventative healthcare are boosting diagnostic research applications. Supportive government initiatives and funding for genomic research, coupled with the expanding applications in agricultural biotechnology for crop and livestock improvement, also contribute substantially to market expansion.
Challenges in the SNP Genotyping and Analysis Sector
Despite its growth potential, the SNP Genotyping and Analysis sector faces several challenges. High initial investment costs for advanced instrumentation and infrastructure can be a barrier for smaller research institutions and emerging markets, impacting market penetration. Complex regulatory frameworks, particularly in clinical diagnostics and drug development, can slow down product approvals and market entry, leading to an estimated delay of 12-24 months for new diagnostic assays. Data interpretation and bioinformatics expertise remain critical bottlenecks, requiring specialized skills that are not always readily available, potentially limiting the effective utilization of genotyping data. Ethical concerns and data privacy issues surrounding genetic information also pose challenges, necessitating robust data security measures and transparent communication with individuals.
Emerging Opportunities in SNP Genotyping and Analysis
The SNP Genotyping and Analysis market presents numerous emerging opportunities. The expansion of direct-to-consumer (DTC) genetic testing for health and ancestry offers a rapidly growing consumer market, estimated to grow by 15% annually. Advancements in liquid biopsy technologies for non-invasive cancer detection and monitoring are creating new avenues for SNP analysis. The increasing focus on rare disease diagnosis and the development of targeted therapies for these conditions represent a significant unmet need and a growth opportunity. Furthermore, the application of SNP genotyping in forensic science for identification and kinship analysis, as well as in food safety and authenticity testing, presents untapped potential. The integration of SNP analysis with other 'omics' technologies is also poised to unlock deeper biological insights.
Leading Players in the SNP Genotyping and Analysis Market
- Thermo Fisher Scientific
- Illumina
- Agilent Technologies
- Roche
- Bio-rad
- LGC
- Sequenom
- Beckman Coulter
- QIAGEN
- Fluidigm
Key Developments in SNP Genotyping and Analysis Industry
- 2023 October: Illumina launched a new genotyping platform significantly reducing assay development time and cost, impacting the cost of SNP analysis by an estimated 15%.
- 2022 December: Thermo Fisher Scientific acquired a leading bioinformatics company specializing in AI-driven genetic data interpretation, strengthening their analytical capabilities.
- 2021 June: Agilent Technologies introduced a high-density SNP microarray designed for enhanced resolution in crop breeding applications.
- 2020 March: Roche expanded its portfolio of diagnostic solutions with the integration of advanced SNP genotyping capabilities for infectious disease research.
- 2019 August: Bio-rad released a novel real-time PCR-based SNP detection system offering improved sensitivity for clinical diagnostics.
Strategic Outlook for SNP Genotyping and Analysis Market
The strategic outlook for the SNP Genotyping and Analysis market is exceptionally positive, characterized by sustained innovation and expanding application horizons. The increasing integration of SNP genotyping with whole-genome sequencing and other 'omics' data will unlock deeper insights into complex biological mechanisms, driving demand in precision medicine and agricultural advancements. The development of more user-friendly and automated platforms will democratize access to genetic analysis, further accelerating market growth. Strategic collaborations between technology providers, research institutions, and healthcare organizations will be crucial for translating research findings into clinical applications and commercial success. The market is well-positioned to capitalize on the growing global emphasis on health, sustainability, and data-driven decision-making.
SNP Genotyping and Analysis Segmentation
-
1. Application
- 1.1. Pharmaceuticals and Pharmacogenomics
- 1.2. Diagnostic Research
- 1.3. Agricultural Biotechnology
- 1.4. Breeding and Animal Livestock
-
2. Types
- 2.1. Dynamic Allele-Specific Hybridization
- 2.2. Molecular Beacons
- 2.3. SNP Microarrays
SNP Genotyping and Analysis Segmentation By Geography
-
1. North America
- 1.1. United States
- 1.2. Canada
- 1.3. Mexico
-
2. South America
- 2.1. Brazil
- 2.2. Argentina
- 2.3. Rest of South America
-
3. Europe
- 3.1. United Kingdom
- 3.2. Germany
- 3.3. France
- 3.4. Italy
- 3.5. Spain
- 3.6. Russia
- 3.7. Benelux
- 3.8. Nordics
- 3.9. Rest of Europe
-
4. Middle East & Africa
- 4.1. Turkey
- 4.2. Israel
- 4.3. GCC
- 4.4. North Africa
- 4.5. South Africa
- 4.6. Rest of Middle East & Africa
-
5. Asia Pacific
- 5.1. China
- 5.2. India
- 5.3. Japan
- 5.4. South Korea
- 5.5. ASEAN
- 5.6. Oceania
- 5.7. Rest of Asia Pacific
SNP Genotyping and Analysis REPORT HIGHLIGHTS
| Aspects | Details |
|---|---|
| Study Period | 2019-2033 |
| Base Year | 2024 |
| Estimated Year | 2025 |
| Forecast Period | 2025-2033 |
| Historical Period | 2019-2024 |
| Growth Rate | CAGR of 16.8% from 2019-2033 |
| Segmentation |
|
Table of Contents
- 1. Introduction
- 1.1. Research Scope
- 1.2. Market Segmentation
- 1.3. Research Methodology
- 1.4. Definitions and Assumptions
- 2. Executive Summary
- 2.1. Introduction
- 3. Market Dynamics
- 3.1. Introduction
- 3.2. Market Drivers
- 3.3. Market Restrains
- 3.4. Market Trends
- 4. Market Factor Analysis
- 4.1. Porters Five Forces
- 4.2. Supply/Value Chain
- 4.3. PESTEL analysis
- 4.4. Market Entropy
- 4.5. Patent/Trademark Analysis
- 5. Global SNP Genotyping and Analysis Analysis, Insights and Forecast, 2019-2031
- 5.1. Market Analysis, Insights and Forecast - by Application
- 5.1.1. Pharmaceuticals and Pharmacogenomics
- 5.1.2. Diagnostic Research
- 5.1.3. Agricultural Biotechnology
- 5.1.4. Breeding and Animal Livestock
- 5.2. Market Analysis, Insights and Forecast - by Types
- 5.2.1. Dynamic Allele-Specific Hybridization
- 5.2.2. Molecular Beacons
- 5.2.3. SNP Microarrays
- 5.3. Market Analysis, Insights and Forecast - by Region
- 5.3.1. North America
- 5.3.2. South America
- 5.3.3. Europe
- 5.3.4. Middle East & Africa
- 5.3.5. Asia Pacific
- 5.1. Market Analysis, Insights and Forecast - by Application
- 6. North America SNP Genotyping and Analysis Analysis, Insights and Forecast, 2019-2031
- 6.1. Market Analysis, Insights and Forecast - by Application
- 6.1.1. Pharmaceuticals and Pharmacogenomics
- 6.1.2. Diagnostic Research
- 6.1.3. Agricultural Biotechnology
- 6.1.4. Breeding and Animal Livestock
- 6.2. Market Analysis, Insights and Forecast - by Types
- 6.2.1. Dynamic Allele-Specific Hybridization
- 6.2.2. Molecular Beacons
- 6.2.3. SNP Microarrays
- 6.1. Market Analysis, Insights and Forecast - by Application
- 7. South America SNP Genotyping and Analysis Analysis, Insights and Forecast, 2019-2031
- 7.1. Market Analysis, Insights and Forecast - by Application
- 7.1.1. Pharmaceuticals and Pharmacogenomics
- 7.1.2. Diagnostic Research
- 7.1.3. Agricultural Biotechnology
- 7.1.4. Breeding and Animal Livestock
- 7.2. Market Analysis, Insights and Forecast - by Types
- 7.2.1. Dynamic Allele-Specific Hybridization
- 7.2.2. Molecular Beacons
- 7.2.3. SNP Microarrays
- 7.1. Market Analysis, Insights and Forecast - by Application
- 8. Europe SNP Genotyping and Analysis Analysis, Insights and Forecast, 2019-2031
- 8.1. Market Analysis, Insights and Forecast - by Application
- 8.1.1. Pharmaceuticals and Pharmacogenomics
- 8.1.2. Diagnostic Research
- 8.1.3. Agricultural Biotechnology
- 8.1.4. Breeding and Animal Livestock
- 8.2. Market Analysis, Insights and Forecast - by Types
- 8.2.1. Dynamic Allele-Specific Hybridization
- 8.2.2. Molecular Beacons
- 8.2.3. SNP Microarrays
- 8.1. Market Analysis, Insights and Forecast - by Application
- 9. Middle East & Africa SNP Genotyping and Analysis Analysis, Insights and Forecast, 2019-2031
- 9.1. Market Analysis, Insights and Forecast - by Application
- 9.1.1. Pharmaceuticals and Pharmacogenomics
- 9.1.2. Diagnostic Research
- 9.1.3. Agricultural Biotechnology
- 9.1.4. Breeding and Animal Livestock
- 9.2. Market Analysis, Insights and Forecast - by Types
- 9.2.1. Dynamic Allele-Specific Hybridization
- 9.2.2. Molecular Beacons
- 9.2.3. SNP Microarrays
- 9.1. Market Analysis, Insights and Forecast - by Application
- 10. Asia Pacific SNP Genotyping and Analysis Analysis, Insights and Forecast, 2019-2031
- 10.1. Market Analysis, Insights and Forecast - by Application
- 10.1.1. Pharmaceuticals and Pharmacogenomics
- 10.1.2. Diagnostic Research
- 10.1.3. Agricultural Biotechnology
- 10.1.4. Breeding and Animal Livestock
- 10.2. Market Analysis, Insights and Forecast - by Types
- 10.2.1. Dynamic Allele-Specific Hybridization
- 10.2.2. Molecular Beacons
- 10.2.3. SNP Microarrays
- 10.1. Market Analysis, Insights and Forecast - by Application
- 11. Competitive Analysis
- 11.1. Global Market Share Analysis 2024
- 11.2. Company Profiles
- 11.2.1 Thermo Fisher Scientific
- 11.2.1.1. Overview
- 11.2.1.2. Products
- 11.2.1.3. SWOT Analysis
- 11.2.1.4. Recent Developments
- 11.2.1.5. Financials (Based on Availability)
- 11.2.2 Illumina
- 11.2.2.1. Overview
- 11.2.2.2. Products
- 11.2.2.3. SWOT Analysis
- 11.2.2.4. Recent Developments
- 11.2.2.5. Financials (Based on Availability)
- 11.2.3 Agilent Technologies
- 11.2.3.1. Overview
- 11.2.3.2. Products
- 11.2.3.3. SWOT Analysis
- 11.2.3.4. Recent Developments
- 11.2.3.5. Financials (Based on Availability)
- 11.2.4 Roche
- 11.2.4.1. Overview
- 11.2.4.2. Products
- 11.2.4.3. SWOT Analysis
- 11.2.4.4. Recent Developments
- 11.2.4.5. Financials (Based on Availability)
- 11.2.5 Bio-rad
- 11.2.5.1. Overview
- 11.2.5.2. Products
- 11.2.5.3. SWOT Analysis
- 11.2.5.4. Recent Developments
- 11.2.5.5. Financials (Based on Availability)
- 11.2.6 LGC
- 11.2.6.1. Overview
- 11.2.6.2. Products
- 11.2.6.3. SWOT Analysis
- 11.2.6.4. Recent Developments
- 11.2.6.5. Financials (Based on Availability)
- 11.2.7 Sequenom
- 11.2.7.1. Overview
- 11.2.7.2. Products
- 11.2.7.3. SWOT Analysis
- 11.2.7.4. Recent Developments
- 11.2.7.5. Financials (Based on Availability)
- 11.2.8 Beckman Coulter
- 11.2.8.1. Overview
- 11.2.8.2. Products
- 11.2.8.3. SWOT Analysis
- 11.2.8.4. Recent Developments
- 11.2.8.5. Financials (Based on Availability)
- 11.2.9 QIAGEN
- 11.2.9.1. Overview
- 11.2.9.2. Products
- 11.2.9.3. SWOT Analysis
- 11.2.9.4. Recent Developments
- 11.2.9.5. Financials (Based on Availability)
- 11.2.10 Fluidigm
- 11.2.10.1. Overview
- 11.2.10.2. Products
- 11.2.10.3. SWOT Analysis
- 11.2.10.4. Recent Developments
- 11.2.10.5. Financials (Based on Availability)
- 11.2.1 Thermo Fisher Scientific
List of Figures
- Figure 1: Global SNP Genotyping and Analysis Revenue Breakdown (million, %) by Region 2024 & 2032
- Figure 2: North America SNP Genotyping and Analysis Revenue (million), by Application 2024 & 2032
- Figure 3: North America SNP Genotyping and Analysis Revenue Share (%), by Application 2024 & 2032
- Figure 4: North America SNP Genotyping and Analysis Revenue (million), by Types 2024 & 2032
- Figure 5: North America SNP Genotyping and Analysis Revenue Share (%), by Types 2024 & 2032
- Figure 6: North America SNP Genotyping and Analysis Revenue (million), by Country 2024 & 2032
- Figure 7: North America SNP Genotyping and Analysis Revenue Share (%), by Country 2024 & 2032
- Figure 8: South America SNP Genotyping and Analysis Revenue (million), by Application 2024 & 2032
- Figure 9: South America SNP Genotyping and Analysis Revenue Share (%), by Application 2024 & 2032
- Figure 10: South America SNP Genotyping and Analysis Revenue (million), by Types 2024 & 2032
- Figure 11: South America SNP Genotyping and Analysis Revenue Share (%), by Types 2024 & 2032
- Figure 12: South America SNP Genotyping and Analysis Revenue (million), by Country 2024 & 2032
- Figure 13: South America SNP Genotyping and Analysis Revenue Share (%), by Country 2024 & 2032
- Figure 14: Europe SNP Genotyping and Analysis Revenue (million), by Application 2024 & 2032
- Figure 15: Europe SNP Genotyping and Analysis Revenue Share (%), by Application 2024 & 2032
- Figure 16: Europe SNP Genotyping and Analysis Revenue (million), by Types 2024 & 2032
- Figure 17: Europe SNP Genotyping and Analysis Revenue Share (%), by Types 2024 & 2032
- Figure 18: Europe SNP Genotyping and Analysis Revenue (million), by Country 2024 & 2032
- Figure 19: Europe SNP Genotyping and Analysis Revenue Share (%), by Country 2024 & 2032
- Figure 20: Middle East & Africa SNP Genotyping and Analysis Revenue (million), by Application 2024 & 2032
- Figure 21: Middle East & Africa SNP Genotyping and Analysis Revenue Share (%), by Application 2024 & 2032
- Figure 22: Middle East & Africa SNP Genotyping and Analysis Revenue (million), by Types 2024 & 2032
- Figure 23: Middle East & Africa SNP Genotyping and Analysis Revenue Share (%), by Types 2024 & 2032
- Figure 24: Middle East & Africa SNP Genotyping and Analysis Revenue (million), by Country 2024 & 2032
- Figure 25: Middle East & Africa SNP Genotyping and Analysis Revenue Share (%), by Country 2024 & 2032
- Figure 26: Asia Pacific SNP Genotyping and Analysis Revenue (million), by Application 2024 & 2032
- Figure 27: Asia Pacific SNP Genotyping and Analysis Revenue Share (%), by Application 2024 & 2032
- Figure 28: Asia Pacific SNP Genotyping and Analysis Revenue (million), by Types 2024 & 2032
- Figure 29: Asia Pacific SNP Genotyping and Analysis Revenue Share (%), by Types 2024 & 2032
- Figure 30: Asia Pacific SNP Genotyping and Analysis Revenue (million), by Country 2024 & 2032
- Figure 31: Asia Pacific SNP Genotyping and Analysis Revenue Share (%), by Country 2024 & 2032
List of Tables
- Table 1: Global SNP Genotyping and Analysis Revenue million Forecast, by Region 2019 & 2032
- Table 2: Global SNP Genotyping and Analysis Revenue million Forecast, by Application 2019 & 2032
- Table 3: Global SNP Genotyping and Analysis Revenue million Forecast, by Types 2019 & 2032
- Table 4: Global SNP Genotyping and Analysis Revenue million Forecast, by Region 2019 & 2032
- Table 5: Global SNP Genotyping and Analysis Revenue million Forecast, by Application 2019 & 2032
- Table 6: Global SNP Genotyping and Analysis Revenue million Forecast, by Types 2019 & 2032
- Table 7: Global SNP Genotyping and Analysis Revenue million Forecast, by Country 2019 & 2032
- Table 8: United States SNP Genotyping and Analysis Revenue (million) Forecast, by Application 2019 & 2032
- Table 9: Canada SNP Genotyping and Analysis Revenue (million) Forecast, by Application 2019 & 2032
- Table 10: Mexico SNP Genotyping and Analysis Revenue (million) Forecast, by Application 2019 & 2032
- Table 11: Global SNP Genotyping and Analysis Revenue million Forecast, by Application 2019 & 2032
- Table 12: Global SNP Genotyping and Analysis Revenue million Forecast, by Types 2019 & 2032
- Table 13: Global SNP Genotyping and Analysis Revenue million Forecast, by Country 2019 & 2032
- Table 14: Brazil SNP Genotyping and Analysis Revenue (million) Forecast, by Application 2019 & 2032
- Table 15: Argentina SNP Genotyping and Analysis Revenue (million) Forecast, by Application 2019 & 2032
- Table 16: Rest of South America SNP Genotyping and Analysis Revenue (million) Forecast, by Application 2019 & 2032
- Table 17: Global SNP Genotyping and Analysis Revenue million Forecast, by Application 2019 & 2032
- Table 18: Global SNP Genotyping and Analysis Revenue million Forecast, by Types 2019 & 2032
- Table 19: Global SNP Genotyping and Analysis Revenue million Forecast, by Country 2019 & 2032
- Table 20: United Kingdom SNP Genotyping and Analysis Revenue (million) Forecast, by Application 2019 & 2032
- Table 21: Germany SNP Genotyping and Analysis Revenue (million) Forecast, by Application 2019 & 2032
- Table 22: France SNP Genotyping and Analysis Revenue (million) Forecast, by Application 2019 & 2032
- Table 23: Italy SNP Genotyping and Analysis Revenue (million) Forecast, by Application 2019 & 2032
- Table 24: Spain SNP Genotyping and Analysis Revenue (million) Forecast, by Application 2019 & 2032
- Table 25: Russia SNP Genotyping and Analysis Revenue (million) Forecast, by Application 2019 & 2032
- Table 26: Benelux SNP Genotyping and Analysis Revenue (million) Forecast, by Application 2019 & 2032
- Table 27: Nordics SNP Genotyping and Analysis Revenue (million) Forecast, by Application 2019 & 2032
- Table 28: Rest of Europe SNP Genotyping and Analysis Revenue (million) Forecast, by Application 2019 & 2032
- Table 29: Global SNP Genotyping and Analysis Revenue million Forecast, by Application 2019 & 2032
- Table 30: Global SNP Genotyping and Analysis Revenue million Forecast, by Types 2019 & 2032
- Table 31: Global SNP Genotyping and Analysis Revenue million Forecast, by Country 2019 & 2032
- Table 32: Turkey SNP Genotyping and Analysis Revenue (million) Forecast, by Application 2019 & 2032
- Table 33: Israel SNP Genotyping and Analysis Revenue (million) Forecast, by Application 2019 & 2032
- Table 34: GCC SNP Genotyping and Analysis Revenue (million) Forecast, by Application 2019 & 2032
- Table 35: North Africa SNP Genotyping and Analysis Revenue (million) Forecast, by Application 2019 & 2032
- Table 36: South Africa SNP Genotyping and Analysis Revenue (million) Forecast, by Application 2019 & 2032
- Table 37: Rest of Middle East & Africa SNP Genotyping and Analysis Revenue (million) Forecast, by Application 2019 & 2032
- Table 38: Global SNP Genotyping and Analysis Revenue million Forecast, by Application 2019 & 2032
- Table 39: Global SNP Genotyping and Analysis Revenue million Forecast, by Types 2019 & 2032
- Table 40: Global SNP Genotyping and Analysis Revenue million Forecast, by Country 2019 & 2032
- Table 41: China SNP Genotyping and Analysis Revenue (million) Forecast, by Application 2019 & 2032
- Table 42: India SNP Genotyping and Analysis Revenue (million) Forecast, by Application 2019 & 2032
- Table 43: Japan SNP Genotyping and Analysis Revenue (million) Forecast, by Application 2019 & 2032
- Table 44: South Korea SNP Genotyping and Analysis Revenue (million) Forecast, by Application 2019 & 2032
- Table 45: ASEAN SNP Genotyping and Analysis Revenue (million) Forecast, by Application 2019 & 2032
- Table 46: Oceania SNP Genotyping and Analysis Revenue (million) Forecast, by Application 2019 & 2032
- Table 47: Rest of Asia Pacific SNP Genotyping and Analysis Revenue (million) Forecast, by Application 2019 & 2032
Frequently Asked Questions
1. What is the projected Compound Annual Growth Rate (CAGR) of the SNP Genotyping and Analysis?
The projected CAGR is approximately 16.8%.
2. Which companies are prominent players in the SNP Genotyping and Analysis?
Key companies in the market include Thermo Fisher Scientific, Illumina, Agilent Technologies, Roche, Bio-rad, LGC, Sequenom, Beckman Coulter, QIAGEN, Fluidigm.
3. What are the main segments of the SNP Genotyping and Analysis?
The market segments include Application, Types.
4. Can you provide details about the market size?
The market size is estimated to be USD 1627 million as of 2022.
5. What are some drivers contributing to market growth?
N/A
6. What are the notable trends driving market growth?
N/A
7. Are there any restraints impacting market growth?
N/A
8. Can you provide examples of recent developments in the market?
N/A
9. What pricing options are available for accessing the report?
Pricing options include single-user, multi-user, and enterprise licenses priced at USD 2900.00, USD 4350.00, and USD 5800.00 respectively.
10. Is the market size provided in terms of value or volume?
The market size is provided in terms of value, measured in million.
11. Are there any specific market keywords associated with the report?
Yes, the market keyword associated with the report is "SNP Genotyping and Analysis," which aids in identifying and referencing the specific market segment covered.
12. How do I determine which pricing option suits my needs best?
The pricing options vary based on user requirements and access needs. Individual users may opt for single-user licenses, while businesses requiring broader access may choose multi-user or enterprise licenses for cost-effective access to the report.
13. Are there any additional resources or data provided in the SNP Genotyping and Analysis report?
While the report offers comprehensive insights, it's advisable to review the specific contents or supplementary materials provided to ascertain if additional resources or data are available.
14. How can I stay updated on further developments or reports in the SNP Genotyping and Analysis?
To stay informed about further developments, trends, and reports in the SNP Genotyping and Analysis, consider subscribing to industry newsletters, following relevant companies and organizations, or regularly checking reputable industry news sources and publications.
Methodology
Step 1 - Identification of Relevant Samples Size from Population Database


Step 2 - Approaches for Defining Global Market Size (Value, Volume* & Price*)

Note*: In applicable scenarios
Step 3 - Data Sources
Primary Research
- Web Analytics
- Survey Reports
- Research Institute
- Latest Research Reports
- Opinion Leaders
Secondary Research
- Annual Reports
- White Paper
- Latest Press Release
- Industry Association
- Paid Database
- Investor Presentations

Step 4 - Data Triangulation
Involves using different sources of information in order to increase the validity of a study
These sources are likely to be stakeholders in a program - participants, other researchers, program staff, other community members, and so on.
Then we put all data in single framework & apply various statistical tools to find out the dynamic on the market.
During the analysis stage, feedback from the stakeholder groups would be compared to determine areas of agreement as well as areas of divergence


