

Key Insights
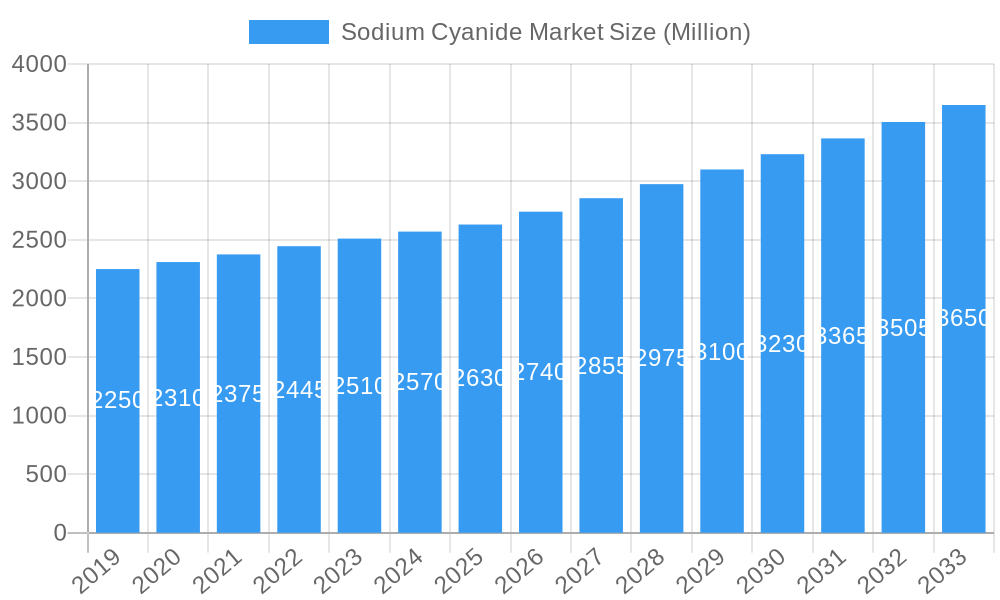
The global Sodium Cyanide market is projected for substantial expansion, driven by robust demand from key industrial sectors. With an estimated market size of 570 million in 2024 and a Compound Annual Growth Rate (CAGR) of 3%, the market is set for steady growth through 2032. The primary growth driver is the indispensable role of sodium cyanide in mining, particularly in gold extraction and processing. The chemical industry is another significant segment, utilizing sodium cyanide for producing intermediates and end products. Emerging economies, with their increasing industrialization and resource extraction, will heavily contribute to market expansion. Technological advancements in production processes are also enhancing efficiency and safety, supporting market development.
Sodium Cyanide Market Market Size (In Million)
Despite strong growth prospects, the market faces constraints. Stringent environmental regulations and toxicity concerns necessitate rigorous safety protocols and waste management, potentially increasing operational costs. However, consistent demand from established industries and potential for new applications are expected to mitigate these challenges. Key players are focusing on expanding production, diversifying portfolios, and investing in R&D for sustainable sodium cyanide solutions. Asia Pacific, particularly China, shows strong growth potential due to extensive mining operations and a burgeoning chemical industry. North America and Europe are also significant markets with established industrial bases and advanced mining techniques.
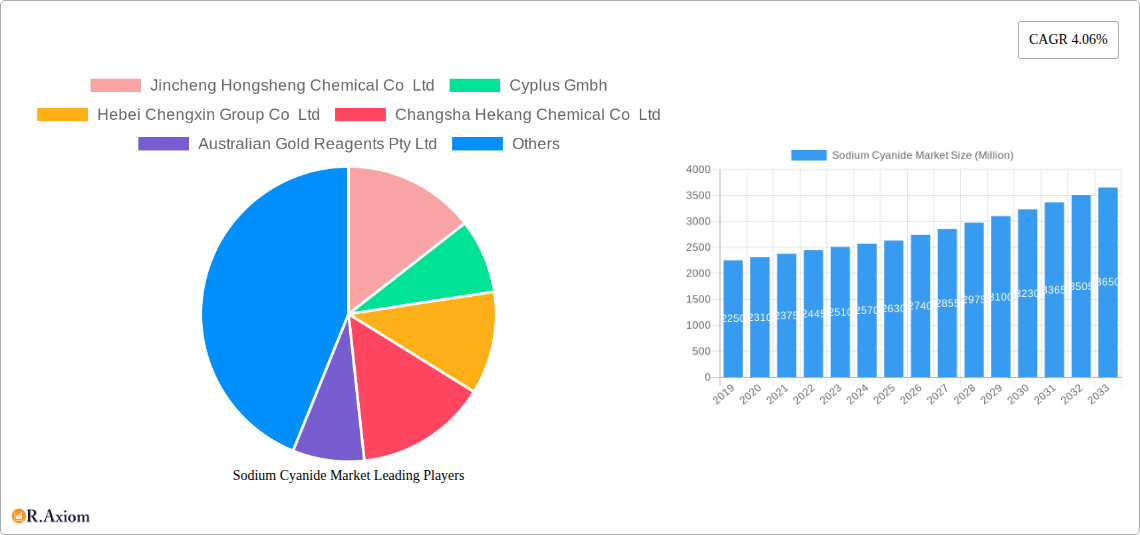
Sodium Cyanide Market Company Market Share
This report delivers an in-depth analysis of the global Sodium Cyanide market, providing critical insights for industry stakeholders from 2023 to 2032. Our detailed examination covers market concentration, innovation, industry trends, dominant markets, product developments, growth drivers, challenges, emerging opportunities, key players, and strategic outlook.
Sodium Cyanide Market Market Concentration & Innovation
The global Sodium Cyanide market exhibits a moderate to high degree of concentration, with a few key players holding significant market share. Leading companies such as Cyanco International LLC, Tongsuh Petrochemical Corp Ltd (Asahi Kasei Corporation), and Orica Limited are instrumental in shaping market dynamics. Innovation in the sodium cyanide sector is primarily driven by advancements in production technologies aimed at improving efficiency, reducing environmental impact, and enhancing product purity. Regulatory frameworks, particularly concerning the safe handling, transportation, and disposal of sodium cyanide, play a crucial role in market entry and operational strategies. While direct product substitutes are limited, advancements in alternative gold extraction methods and evolving mining techniques indirectly influence demand. End-user trends, especially within the mining industry's adoption of more sustainable practices, are prompting manufacturers to invest in cleaner production processes. Mergers and acquisitions (M&A) activities, such as potential collaborations or consolidations among established players, can further consolidate market share and drive innovation. The M&A deal value in this niche market is expected to remain substantial, reflecting the strategic importance of sodium cyanide in key industrial applications.
Sodium Cyanide Market Industry Trends & Insights
The Sodium Cyanide market is poised for steady growth, driven by the indispensable role of sodium cyanide in gold extraction and the burgeoning demand for precious metals. The market is projected to witness a Compound Annual Growth Rate (CAGR) of approximately 4.5% during the forecast period (2025-2033). This growth is underpinned by several key trends. Firstly, the persistent global demand for gold, fueled by its use in jewelry, investment, and industrial applications, directly translates to a sustained need for sodium cyanide for efficient leaching processes. Secondly, the increasing complexity and declining grades of new gold ore deposits necessitate more effective extraction methods, where sodium cyanide remains a leading solution. Technological advancements in production, such as the development of more energy-efficient and environmentally sound manufacturing processes, are also influencing market competitiveness. Furthermore, the growing adoption of sodium cyanide in other chemical synthesis applications, though a smaller segment, contributes to market diversification. Geographically, regions with significant gold mining activities, particularly in the Asia Pacific and North America, are expected to be the primary demand centers. The market penetration of sodium cyanide remains high in established gold-producing nations, while emerging mining frontiers offer potential for increased adoption. Competitive dynamics are characterized by a focus on supply chain reliability, stringent quality control, and adherence to rigorous safety and environmental regulations. Companies are increasingly investing in research and development to optimize their production processes and offer value-added services to their clientele. The market penetration of sodium cyanide is currently estimated at around 70% in key gold mining regions.
Dominant Markets & Segments in Sodium Cyanide Market
The global Sodium Cyanide market is significantly influenced by its dominant end-user industries, with the Mining sector emerging as the largest consumer. Within the Mining segment, the extraction of gold accounts for the lion's share of sodium cyanide consumption, owing to its efficacy in the cyanidation process for dissolving gold from ore. Economic policies supporting mining operations, particularly in countries with substantial gold reserves like China, Australia, and the United States, are critical drivers for this dominance. Infrastructure development, including improved transportation networks for raw materials and finished products, also plays a vital role in facilitating market access and growth. The Chemical segment, while smaller, represents a significant application for sodium cyanide in the synthesis of various organic chemicals, including dyes, pharmaceuticals, and agrochemicals. The growth of these downstream chemical industries directly impacts the demand for sodium cyanide.
- Mining: This segment is characterized by high consumption driven by gold, silver, and other precious metal extraction.
- Key Drivers:
- Global Gold Demand: Sustained demand for gold in investment, jewelry, and industrial applications.
- Ore Grade Decline: Necessity for efficient extraction techniques like cyanidation for lower-grade ores.
- Geopolitical Stability: Favorable economic policies and mining regulations in key gold-producing nations.
- Technological Advancements in Leaching: Continued refinement of cyanidation processes for improved recovery rates.
- Emerging Mining Frontiers: Exploration and development of new gold deposits in Africa, South America, and parts of Asia.
- Key Drivers:
- Chemical: This segment utilizes sodium cyanide as a crucial intermediate in the production of various organic compounds.
- Key Drivers:
- Pharmaceutical Industry Growth: Demand for sodium cyanide in the synthesis of active pharmaceutical ingredients.
- Agrochemical Production: Use in the manufacturing of certain pesticides and herbicides.
- Dye and Pigment Manufacturing: Application in the production of specialized colorants.
- Research and Development: Use in laboratory settings for complex organic synthesis.
- Key Drivers:
- Other End-user Industries: This segment encompasses niche applications, including electroplating, metal treatment, and certain specialized industrial processes.
- Key Drivers:
- Automotive and Aerospace Industries: Demand for electroplated components.
- Specialty Chemical Manufacturing: Use in specific industrial processes requiring cyanide-based reactions.
- Key Drivers:
The Asia Pacific region, particularly China, is a dominant force in both the production and consumption of sodium cyanide, driven by its extensive mining sector and robust chemical industry. North America, with its significant gold mining operations, also represents a key market.
Sodium Cyanide Market Product Developments
Product developments in the Sodium Cyanide market are largely focused on enhancing product purity and optimizing production processes to meet stringent environmental and safety standards. Manufacturers are investing in advanced manufacturing techniques to reduce impurities and ensure consistency in their sodium cyanide offerings, which is critical for sensitive applications like gold leaching. Emphasis is also placed on developing more secure and sustainable packaging and transportation solutions to mitigate risks associated with handling hazardous materials. The competitive advantage for players lies in their ability to offer high-quality sodium cyanide with a reliable supply chain, coupled with robust technical support for end-users.
Report Scope & Segmentation Analysis
This report provides a comprehensive segmentation of the Sodium Cyanide market. The primary segmentation is based on End-user Industry, categorizing the market into:
- Mining: This segment is projected to exhibit robust growth, driven by global gold demand and the exploration of new ore bodies. Its market share is expected to remain dominant throughout the forecast period, with an estimated market size of over $3,500 Million by 2033.
- Chemical: The Chemical segment is anticipated to witness steady expansion, fueled by the growth in pharmaceutical and agrochemical industries. Its market share is projected to increase incrementally, reaching an estimated market size of over $800 Million by 2033.
- Other End-user Industries: This segment, encompassing niche applications, is expected to maintain a stable market share, with growth tied to specific industrial developments. Its estimated market size is projected to be over $200 Million by 2033.
Key Drivers of Sodium Cyanide Market Growth
The growth of the Sodium Cyanide market is primarily propelled by several interconnected factors. The enduring global demand for gold, a key precious metal used in investment, jewelry, and various industrial applications, directly fuels the need for efficient extraction methods like cyanidation. Furthermore, the increasing difficulty in extracting gold from lower-grade ores necessitates the use of effective chemical reagents, making sodium cyanide indispensable. Technological advancements in production processes, aiming for greater efficiency and reduced environmental impact, contribute to market competitiveness. Favorable economic policies and regulatory frameworks in major gold-producing nations also act as significant growth catalysts. The chemical industry's ongoing demand for sodium cyanide as an intermediate for pharmaceuticals, agrochemicals, and dyes further diversifies and strengthens the market.
Challenges in the Sodium Cyanide Market Sector
Despite its crucial role, the Sodium Cyanide market faces significant challenges. The inherent toxicity of sodium cyanide necessitates stringent regulatory oversight concerning its handling, transportation, storage, and disposal, which can increase operational costs and complexity. Environmental concerns and public perception related to cyanide use in mining operations can lead to stricter regulations and potential bans in certain regions. Supply chain disruptions, geopolitical instability in key mining regions, and fluctuations in raw material prices can impact production costs and product availability. Competition from alternative extraction technologies, though currently less widespread, poses a long-term threat. The potential for accidental spills and the associated environmental remediation costs represent a constant challenge for market participants.
Emerging Opportunities in Sodium Cyanide Market
The Sodium Cyanide market is ripe with emerging opportunities. The exploration and development of new gold deposits in underexplored regions, particularly in Africa and South America, present significant growth potential. Advancements in the chemical synthesis sector, leading to new applications for sodium cyanide in the production of advanced materials and specialized chemicals, offer diversification avenues. The development of more environmentally benign production processes and closed-loop recycling systems for cyanide in mining operations could address regulatory concerns and enhance market acceptance. Furthermore, the increasing adoption of digital technologies for supply chain management and process optimization can lead to improved efficiency and cost savings for market players.
Leading Players in the Sodium Cyanide Market Market
- Jincheng Hongsheng Chemical Co Ltd
- Cyplus Gmbh
- Hebei Chengxin Group Co Ltd
- Changsha Hekang Chemical Co Ltd
- Australian Gold Reagents Pty Ltd
- Draslovka
- Ynnovate Sanzheng (Yingkou) Fine Chemicals Co Ltd
- Cyanco International LLC
- Tongsuh Petrochemical Corp Ltd (Asahi Kasei Corporation)
- Unigel
- Orica Limited
- Anhui Shuguang Chemical Group
- Taekwang Industrial Co Ltd
Key Developments in Sodium Cyanide Market Industry
- 2023/Ongoing: Increased focus on sustainable production methods and waste reduction in response to environmental regulations.
- 2023: Investments in R&D for improved cyanide recovery and recycling technologies in mining operations.
- 2022: Strategic partnerships formed to enhance supply chain resilience and global distribution networks.
- 2021: Introduction of advanced safety protocols and transportation logistics for sodium cyanide.
- 2020: Expansion of production capacities in emerging gold-producing regions.
Strategic Outlook for Sodium Cyanide Market Market
The strategic outlook for the Sodium Cyanide market remains positive, driven by the continued essentiality of sodium cyanide in gold extraction and its diverse applications in the chemical industry. Growth catalysts will include ongoing exploration and development of new mineral resources, coupled with the demand for efficient and cost-effective extraction techniques. Companies that invest in technological innovation, focusing on safer and more environmentally sustainable production and handling practices, will be well-positioned for success. Strategic alliances and M&A activities are anticipated to continue, enabling companies to consolidate market presence, expand geographical reach, and enhance their competitive advantage. The market's trajectory will also be influenced by evolving regulatory landscapes and the global economic climate.
Sodium Cyanide Market Segmentation
-
1. End-user Industry
- 1.1. Mining
- 1.2. Chemical
- 1.3. Other End-user Industries
Sodium Cyanide Market Segmentation By Geography
-
1. Asia Pacific
- 1.1. China
- 1.2. Australia
-
2. Indonesia
- 2.1. Rest of Asia Pacific
-
3. North America
- 3.1. United States
- 3.2. Canada
- 3.3. Mexico
-
4. Europe
- 4.1. Russia
- 4.2. CIS Countries
- 5. Rest of Europe
-
6. South America
- 6.1. Brazil
- 6.2. Argentina
- 6.3. Peru
- 6.4. Rest of South America
-
7. Middle East and Africa
- 7.1. Ghana
- 7.2. Sudan
- 7.3. South Africa
- 7.4. Rest of Middle East and Africa
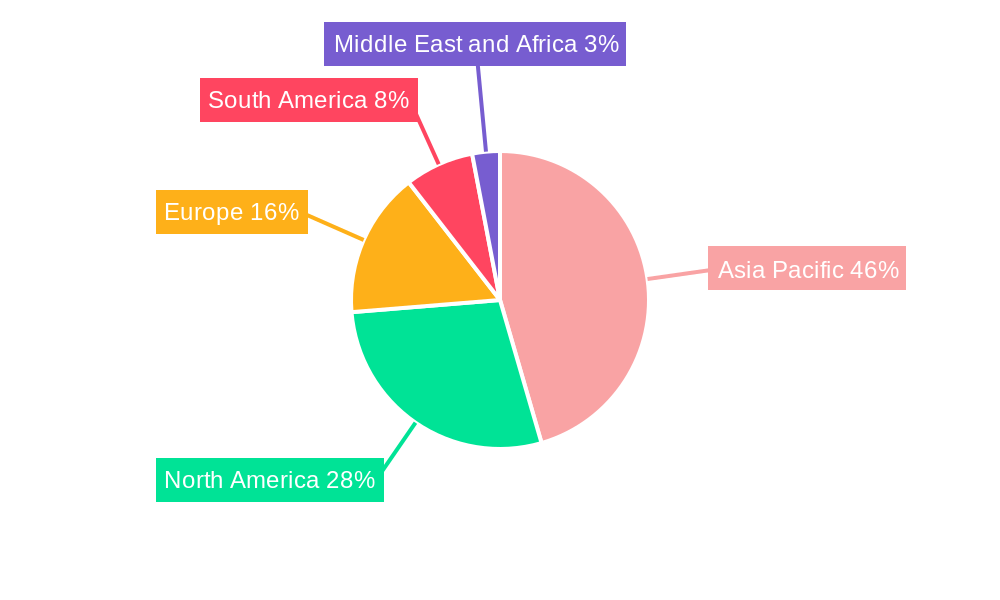
Sodium Cyanide Market Regional Market Share
Geographic Coverage of Sodium Cyanide Market
Sodium Cyanide Market REPORT HIGHLIGHTS
| Aspects | Details |
|---|---|
| Study Period | 2020-2034 |
| Base Year | 2025 |
| Estimated Year | 2026 |
| Forecast Period | 2026-2034 |
| Historical Period | 2020-2025 |
| Growth Rate | CAGR of 3% from 2020-2034 |
| Segmentation |
|
Table of Contents
- 1. Introduction
- 1.1. Research Scope
- 1.2. Market Segmentation
- 1.3. Research Objective
- 1.4. Definitions and Assumptions
- 2. Executive Summary
- 2.1. Market Snapshot
- 3. Market Dynamics
- 3.1. Market Drivers
- 3.2. Market Restrains
- 3.3. Market Trends
- 3.4. Market Opportunities
- 4. Market Factor Analysis
- 4.1. Porters Five Forces
- 4.1.1. Bargaining Power of Suppliers
- 4.1.2. Bargaining Power of Buyers
- 4.1.3. Threat of New Entrants
- 4.1.4. Threat of Substitutes
- 4.1.5. Competitive Rivalry
- 4.2. PESTEL analysis
- 4.3. BCG Analysis
- 4.3.1. Stars (High Growth, High Market Share)
- 4.3.2. Cash Cows (Low Growth, High Market Share)
- 4.3.3. Question Mark (High Growth, Low Market Share)
- 4.3.4. Dogs (Low Growth, Low Market Share)
- 4.4. Ansoff Matrix Analysis
- 4.5. Supply Chain Analysis
- 4.6. Regulatory Landscape
- 4.7. Current Market Potential and Opportunity Assessment (TAM–SAM–SOM Framework)
- 4.8. RAX Analyst Note
- 4.1. Porters Five Forces
- 5. Market Analysis, Insights and Forecast 2021-2033
- 5.1. Market Analysis, Insights and Forecast - by End-user Industry
- 5.1.1. Mining
- 5.1.2. Chemical
- 5.1.3. Other End-user Industries
- 5.2. Market Analysis, Insights and Forecast - by Region
- 5.2.1. Asia Pacific
- 5.2.2. Indonesia
- 5.2.3. North America
- 5.2.4. Europe
- 5.2.5. Rest of Europe
- 5.2.6. South America
- 5.2.7. Middle East and Africa
- 5.1. Market Analysis, Insights and Forecast - by End-user Industry
- 6. Global Sodium Cyanide Market Analysis, Insights and Forecast, 2021-2033
- 6.1. Market Analysis, Insights and Forecast - by End-user Industry
- 6.1.1. Mining
- 6.1.2. Chemical
- 6.1.3. Other End-user Industries
- 6.1. Market Analysis, Insights and Forecast - by End-user Industry
- 7. Asia Pacific Sodium Cyanide Market Analysis, Insights and Forecast, 2020-2032
- 7.1. Market Analysis, Insights and Forecast - by End-user Industry
- 7.1.1. Mining
- 7.1.2. Chemical
- 7.1.3. Other End-user Industries
- 7.1. Market Analysis, Insights and Forecast - by End-user Industry
- 8. Indonesia Sodium Cyanide Market Analysis, Insights and Forecast, 2020-2032
- 8.1. Market Analysis, Insights and Forecast - by End-user Industry
- 8.1.1. Mining
- 8.1.2. Chemical
- 8.1.3. Other End-user Industries
- 8.1. Market Analysis, Insights and Forecast - by End-user Industry
- 9. North America Sodium Cyanide Market Analysis, Insights and Forecast, 2020-2032
- 9.1. Market Analysis, Insights and Forecast - by End-user Industry
- 9.1.1. Mining
- 9.1.2. Chemical
- 9.1.3. Other End-user Industries
- 9.1. Market Analysis, Insights and Forecast - by End-user Industry
- 10. Europe Sodium Cyanide Market Analysis, Insights and Forecast, 2020-2032
- 10.1. Market Analysis, Insights and Forecast - by End-user Industry
- 10.1.1. Mining
- 10.1.2. Chemical
- 10.1.3. Other End-user Industries
- 10.1. Market Analysis, Insights and Forecast - by End-user Industry
- 11. Rest of Europe Sodium Cyanide Market Analysis, Insights and Forecast, 2020-2032
- 11.1. Market Analysis, Insights and Forecast - by End-user Industry
- 11.1.1. Mining
- 11.1.2. Chemical
- 11.1.3. Other End-user Industries
- 11.1. Market Analysis, Insights and Forecast - by End-user Industry
- 12. South America Sodium Cyanide Market Analysis, Insights and Forecast, 2020-2032
- 12.1. Market Analysis, Insights and Forecast - by End-user Industry
- 12.1.1. Mining
- 12.1.2. Chemical
- 12.1.3. Other End-user Industries
- 12.1. Market Analysis, Insights and Forecast - by End-user Industry
- 13. Middle East and Africa Sodium Cyanide Market Analysis, Insights and Forecast, 2020-2032
- 13.1. Market Analysis, Insights and Forecast - by End-user Industry
- 13.1.1. Mining
- 13.1.2. Chemical
- 13.1.3. Other End-user Industries
- 13.1. Market Analysis, Insights and Forecast - by End-user Industry
- 14. Competitive Analysis
- 14.1. Company Profiles
- 14.1.1 Jincheng Hongsheng Chemical Co Ltd
- 14.1.1.1. Company Overview
- 14.1.1.2. Products
- 14.1.1.3. Company Financials
- 14.1.1.4. SWOT Analysis
- 14.1.2 Cyplus Gmbh
- 14.1.2.1. Company Overview
- 14.1.2.2. Products
- 14.1.2.3. Company Financials
- 14.1.2.4. SWOT Analysis
- 14.1.3 Hebei Chengxin Group Co Ltd
- 14.1.3.1. Company Overview
- 14.1.3.2. Products
- 14.1.3.3. Company Financials
- 14.1.3.4. SWOT Analysis
- 14.1.4 Changsha Hekang Chemical Co Ltd
- 14.1.4.1. Company Overview
- 14.1.4.2. Products
- 14.1.4.3. Company Financials
- 14.1.4.4. SWOT Analysis
- 14.1.5 Australian Gold Reagents Pty Ltd
- 14.1.5.1. Company Overview
- 14.1.5.2. Products
- 14.1.5.3. Company Financials
- 14.1.5.4. SWOT Analysis
- 14.1.6 Draslovka
- 14.1.6.1. Company Overview
- 14.1.6.2. Products
- 14.1.6.3. Company Financials
- 14.1.6.4. SWOT Analysis
- 14.1.7 Ynnovate Sanzheng (Yingkou) Fine Chemicals Co Ltd*List Not Exhaustive
- 14.1.7.1. Company Overview
- 14.1.7.2. Products
- 14.1.7.3. Company Financials
- 14.1.7.4. SWOT Analysis
- 14.1.8 Cyanco International LLC
- 14.1.8.1. Company Overview
- 14.1.8.2. Products
- 14.1.8.3. Company Financials
- 14.1.8.4. SWOT Analysis
- 14.1.9 Tongsuh Petrochemical Corp Ltd (Asahi Kasei Corporation)
- 14.1.9.1. Company Overview
- 14.1.9.2. Products
- 14.1.9.3. Company Financials
- 14.1.9.4. SWOT Analysis
- 14.1.10 Unigel
- 14.1.10.1. Company Overview
- 14.1.10.2. Products
- 14.1.10.3. Company Financials
- 14.1.10.4. SWOT Analysis
- 14.1.11 Orica Limited
- 14.1.11.1. Company Overview
- 14.1.11.2. Products
- 14.1.11.3. Company Financials
- 14.1.11.4. SWOT Analysis
- 14.1.12 Anhui Shuguang Chemical Group
- 14.1.12.1. Company Overview
- 14.1.12.2. Products
- 14.1.12.3. Company Financials
- 14.1.12.4. SWOT Analysis
- 14.1.13 Taekwang Industrial Co Ltd
- 14.1.13.1. Company Overview
- 14.1.13.2. Products
- 14.1.13.3. Company Financials
- 14.1.13.4. SWOT Analysis
- 14.1.1 Jincheng Hongsheng Chemical Co Ltd
- 14.2. Market Entropy
- 14.2.1 Company's Key Areas Served
- 14.2.2 Recent Developments
- 14.3. Company Market Share Analysis 2025
- 14.3.1 Top 5 Companies Market Share Analysis
- 14.3.2 Top 3 Companies Market Share Analysis
- 14.4. List of Potential Customers
- 15. Research Methodology
List of Figures
- Figure 1: Global Sodium Cyanide Market Revenue Breakdown (million, %) by Region 2025 & 2033
- Figure 2: Global Sodium Cyanide Market Volume Breakdown (Million, %) by Region 2025 & 2033
- Figure 3: Asia Pacific Sodium Cyanide Market Revenue (million), by End-user Industry 2025 & 2033
- Figure 4: Asia Pacific Sodium Cyanide Market Volume (Million), by End-user Industry 2025 & 2033
- Figure 5: Asia Pacific Sodium Cyanide Market Revenue Share (%), by End-user Industry 2025 & 2033
- Figure 6: Asia Pacific Sodium Cyanide Market Volume Share (%), by End-user Industry 2025 & 2033
- Figure 7: Asia Pacific Sodium Cyanide Market Revenue (million), by Country 2025 & 2033
- Figure 8: Asia Pacific Sodium Cyanide Market Volume (Million), by Country 2025 & 2033
- Figure 9: Asia Pacific Sodium Cyanide Market Revenue Share (%), by Country 2025 & 2033
- Figure 10: Asia Pacific Sodium Cyanide Market Volume Share (%), by Country 2025 & 2033
- Figure 11: Indonesia Sodium Cyanide Market Revenue (million), by End-user Industry 2025 & 2033
- Figure 12: Indonesia Sodium Cyanide Market Volume (Million), by End-user Industry 2025 & 2033
- Figure 13: Indonesia Sodium Cyanide Market Revenue Share (%), by End-user Industry 2025 & 2033
- Figure 14: Indonesia Sodium Cyanide Market Volume Share (%), by End-user Industry 2025 & 2033
- Figure 15: Indonesia Sodium Cyanide Market Revenue (million), by Country 2025 & 2033
- Figure 16: Indonesia Sodium Cyanide Market Volume (Million), by Country 2025 & 2033
- Figure 17: Indonesia Sodium Cyanide Market Revenue Share (%), by Country 2025 & 2033
- Figure 18: Indonesia Sodium Cyanide Market Volume Share (%), by Country 2025 & 2033
- Figure 19: North America Sodium Cyanide Market Revenue (million), by End-user Industry 2025 & 2033
- Figure 20: North America Sodium Cyanide Market Volume (Million), by End-user Industry 2025 & 2033
- Figure 21: North America Sodium Cyanide Market Revenue Share (%), by End-user Industry 2025 & 2033
- Figure 22: North America Sodium Cyanide Market Volume Share (%), by End-user Industry 2025 & 2033
- Figure 23: North America Sodium Cyanide Market Revenue (million), by Country 2025 & 2033
- Figure 24: North America Sodium Cyanide Market Volume (Million), by Country 2025 & 2033
- Figure 25: North America Sodium Cyanide Market Revenue Share (%), by Country 2025 & 2033
- Figure 26: North America Sodium Cyanide Market Volume Share (%), by Country 2025 & 2033
- Figure 27: Europe Sodium Cyanide Market Revenue (million), by End-user Industry 2025 & 2033
- Figure 28: Europe Sodium Cyanide Market Volume (Million), by End-user Industry 2025 & 2033
- Figure 29: Europe Sodium Cyanide Market Revenue Share (%), by End-user Industry 2025 & 2033
- Figure 30: Europe Sodium Cyanide Market Volume Share (%), by End-user Industry 2025 & 2033
- Figure 31: Europe Sodium Cyanide Market Revenue (million), by Country 2025 & 2033
- Figure 32: Europe Sodium Cyanide Market Volume (Million), by Country 2025 & 2033
- Figure 33: Europe Sodium Cyanide Market Revenue Share (%), by Country 2025 & 2033
- Figure 34: Europe Sodium Cyanide Market Volume Share (%), by Country 2025 & 2033
- Figure 35: Rest of Europe Sodium Cyanide Market Revenue (million), by End-user Industry 2025 & 2033
- Figure 36: Rest of Europe Sodium Cyanide Market Volume (Million), by End-user Industry 2025 & 2033
- Figure 37: Rest of Europe Sodium Cyanide Market Revenue Share (%), by End-user Industry 2025 & 2033
- Figure 38: Rest of Europe Sodium Cyanide Market Volume Share (%), by End-user Industry 2025 & 2033
- Figure 39: Rest of Europe Sodium Cyanide Market Revenue (million), by Country 2025 & 2033
- Figure 40: Rest of Europe Sodium Cyanide Market Volume (Million), by Country 2025 & 2033
- Figure 41: Rest of Europe Sodium Cyanide Market Revenue Share (%), by Country 2025 & 2033
- Figure 42: Rest of Europe Sodium Cyanide Market Volume Share (%), by Country 2025 & 2033
- Figure 43: South America Sodium Cyanide Market Revenue (million), by End-user Industry 2025 & 2033
- Figure 44: South America Sodium Cyanide Market Volume (Million), by End-user Industry 2025 & 2033
- Figure 45: South America Sodium Cyanide Market Revenue Share (%), by End-user Industry 2025 & 2033
- Figure 46: South America Sodium Cyanide Market Volume Share (%), by End-user Industry 2025 & 2033
- Figure 47: South America Sodium Cyanide Market Revenue (million), by Country 2025 & 2033
- Figure 48: South America Sodium Cyanide Market Volume (Million), by Country 2025 & 2033
- Figure 49: South America Sodium Cyanide Market Revenue Share (%), by Country 2025 & 2033
- Figure 50: South America Sodium Cyanide Market Volume Share (%), by Country 2025 & 2033
- Figure 51: Middle East and Africa Sodium Cyanide Market Revenue (million), by End-user Industry 2025 & 2033
- Figure 52: Middle East and Africa Sodium Cyanide Market Volume (Million), by End-user Industry 2025 & 2033
- Figure 53: Middle East and Africa Sodium Cyanide Market Revenue Share (%), by End-user Industry 2025 & 2033
- Figure 54: Middle East and Africa Sodium Cyanide Market Volume Share (%), by End-user Industry 2025 & 2033
- Figure 55: Middle East and Africa Sodium Cyanide Market Revenue (million), by Country 2025 & 2033
- Figure 56: Middle East and Africa Sodium Cyanide Market Volume (Million), by Country 2025 & 2033
- Figure 57: Middle East and Africa Sodium Cyanide Market Revenue Share (%), by Country 2025 & 2033
- Figure 58: Middle East and Africa Sodium Cyanide Market Volume Share (%), by Country 2025 & 2033
List of Tables
- Table 1: Global Sodium Cyanide Market Revenue million Forecast, by End-user Industry 2020 & 2033
- Table 2: Global Sodium Cyanide Market Volume Million Forecast, by End-user Industry 2020 & 2033
- Table 3: Global Sodium Cyanide Market Revenue million Forecast, by Region 2020 & 2033
- Table 4: Global Sodium Cyanide Market Volume Million Forecast, by Region 2020 & 2033
- Table 5: Global Sodium Cyanide Market Revenue million Forecast, by End-user Industry 2020 & 2033
- Table 6: Global Sodium Cyanide Market Volume Million Forecast, by End-user Industry 2020 & 2033
- Table 7: Global Sodium Cyanide Market Revenue million Forecast, by Country 2020 & 2033
- Table 8: Global Sodium Cyanide Market Volume Million Forecast, by Country 2020 & 2033
- Table 9: China Sodium Cyanide Market Revenue (million) Forecast, by Application 2020 & 2033
- Table 10: China Sodium Cyanide Market Volume (Million) Forecast, by Application 2020 & 2033
- Table 11: Australia Sodium Cyanide Market Revenue (million) Forecast, by Application 2020 & 2033
- Table 12: Australia Sodium Cyanide Market Volume (Million) Forecast, by Application 2020 & 2033
- Table 13: Global Sodium Cyanide Market Revenue million Forecast, by End-user Industry 2020 & 2033
- Table 14: Global Sodium Cyanide Market Volume Million Forecast, by End-user Industry 2020 & 2033
- Table 15: Global Sodium Cyanide Market Revenue million Forecast, by Country 2020 & 2033
- Table 16: Global Sodium Cyanide Market Volume Million Forecast, by Country 2020 & 2033
- Table 17: Rest of Asia Pacific Sodium Cyanide Market Revenue (million) Forecast, by Application 2020 & 2033
- Table 18: Rest of Asia Pacific Sodium Cyanide Market Volume (Million) Forecast, by Application 2020 & 2033
- Table 19: Global Sodium Cyanide Market Revenue million Forecast, by End-user Industry 2020 & 2033
- Table 20: Global Sodium Cyanide Market Volume Million Forecast, by End-user Industry 2020 & 2033
- Table 21: Global Sodium Cyanide Market Revenue million Forecast, by Country 2020 & 2033
- Table 22: Global Sodium Cyanide Market Volume Million Forecast, by Country 2020 & 2033
- Table 23: United States Sodium Cyanide Market Revenue (million) Forecast, by Application 2020 & 2033
- Table 24: United States Sodium Cyanide Market Volume (Million) Forecast, by Application 2020 & 2033
- Table 25: Canada Sodium Cyanide Market Revenue (million) Forecast, by Application 2020 & 2033
- Table 26: Canada Sodium Cyanide Market Volume (Million) Forecast, by Application 2020 & 2033
- Table 27: Mexico Sodium Cyanide Market Revenue (million) Forecast, by Application 2020 & 2033
- Table 28: Mexico Sodium Cyanide Market Volume (Million) Forecast, by Application 2020 & 2033
- Table 29: Global Sodium Cyanide Market Revenue million Forecast, by End-user Industry 2020 & 2033
- Table 30: Global Sodium Cyanide Market Volume Million Forecast, by End-user Industry 2020 & 2033
- Table 31: Global Sodium Cyanide Market Revenue million Forecast, by Country 2020 & 2033
- Table 32: Global Sodium Cyanide Market Volume Million Forecast, by Country 2020 & 2033
- Table 33: Russia Sodium Cyanide Market Revenue (million) Forecast, by Application 2020 & 2033
- Table 34: Russia Sodium Cyanide Market Volume (Million) Forecast, by Application 2020 & 2033
- Table 35: CIS Countries Sodium Cyanide Market Revenue (million) Forecast, by Application 2020 & 2033
- Table 36: CIS Countries Sodium Cyanide Market Volume (Million) Forecast, by Application 2020 & 2033
- Table 37: Global Sodium Cyanide Market Revenue million Forecast, by End-user Industry 2020 & 2033
- Table 38: Global Sodium Cyanide Market Volume Million Forecast, by End-user Industry 2020 & 2033
- Table 39: Global Sodium Cyanide Market Revenue million Forecast, by Country 2020 & 2033
- Table 40: Global Sodium Cyanide Market Volume Million Forecast, by Country 2020 & 2033
- Table 41: Global Sodium Cyanide Market Revenue million Forecast, by End-user Industry 2020 & 2033
- Table 42: Global Sodium Cyanide Market Volume Million Forecast, by End-user Industry 2020 & 2033
- Table 43: Global Sodium Cyanide Market Revenue million Forecast, by Country 2020 & 2033
- Table 44: Global Sodium Cyanide Market Volume Million Forecast, by Country 2020 & 2033
- Table 45: Brazil Sodium Cyanide Market Revenue (million) Forecast, by Application 2020 & 2033
- Table 46: Brazil Sodium Cyanide Market Volume (Million) Forecast, by Application 2020 & 2033
- Table 47: Argentina Sodium Cyanide Market Revenue (million) Forecast, by Application 2020 & 2033
- Table 48: Argentina Sodium Cyanide Market Volume (Million) Forecast, by Application 2020 & 2033
- Table 49: Peru Sodium Cyanide Market Revenue (million) Forecast, by Application 2020 & 2033
- Table 50: Peru Sodium Cyanide Market Volume (Million) Forecast, by Application 2020 & 2033
- Table 51: Rest of South America Sodium Cyanide Market Revenue (million) Forecast, by Application 2020 & 2033
- Table 52: Rest of South America Sodium Cyanide Market Volume (Million) Forecast, by Application 2020 & 2033
- Table 53: Global Sodium Cyanide Market Revenue million Forecast, by End-user Industry 2020 & 2033
- Table 54: Global Sodium Cyanide Market Volume Million Forecast, by End-user Industry 2020 & 2033
- Table 55: Global Sodium Cyanide Market Revenue million Forecast, by Country 2020 & 2033
- Table 56: Global Sodium Cyanide Market Volume Million Forecast, by Country 2020 & 2033
- Table 57: Ghana Sodium Cyanide Market Revenue (million) Forecast, by Application 2020 & 2033
- Table 58: Ghana Sodium Cyanide Market Volume (Million) Forecast, by Application 2020 & 2033
- Table 59: Sudan Sodium Cyanide Market Revenue (million) Forecast, by Application 2020 & 2033
- Table 60: Sudan Sodium Cyanide Market Volume (Million) Forecast, by Application 2020 & 2033
- Table 61: South Africa Sodium Cyanide Market Revenue (million) Forecast, by Application 2020 & 2033
- Table 62: South Africa Sodium Cyanide Market Volume (Million) Forecast, by Application 2020 & 2033
- Table 63: Rest of Middle East and Africa Sodium Cyanide Market Revenue (million) Forecast, by Application 2020 & 2033
- Table 64: Rest of Middle East and Africa Sodium Cyanide Market Volume (Million) Forecast, by Application 2020 & 2033
Frequently Asked Questions
1. What is the projected Compound Annual Growth Rate (CAGR) of the Sodium Cyanide Market?
The projected CAGR is approximately 3%.
2. Which companies are prominent players in the Sodium Cyanide Market?
Key companies in the market include Jincheng Hongsheng Chemical Co Ltd, Cyplus Gmbh, Hebei Chengxin Group Co Ltd, Changsha Hekang Chemical Co Ltd, Australian Gold Reagents Pty Ltd, Draslovka, Ynnovate Sanzheng (Yingkou) Fine Chemicals Co Ltd*List Not Exhaustive, Cyanco International LLC, Tongsuh Petrochemical Corp Ltd (Asahi Kasei Corporation), Unigel, Orica Limited, Anhui Shuguang Chemical Group, Taekwang Industrial Co Ltd.
3. What are the main segments of the Sodium Cyanide Market?
The market segments include End-user Industry.
4. Can you provide details about the market size?
The market size is estimated to be USD 570 million as of 2022.
5. What are some drivers contributing to market growth?
High Demand from the Gold Mining Industry; Increasing Mining Activities in Canada and Mexico; Other Drivers.
6. What are the notable trends driving market growth?
Mining Segment to Dominate the Market Demand.
7. Are there any restraints impacting market growth?
Toxicity of Sodium Cyanide; Development of Substitute for Gold Extraction.
8. Can you provide examples of recent developments in the market?
N/A
9. What pricing options are available for accessing the report?
Pricing options include single-user, multi-user, and enterprise licenses priced at USD 4750, USD 5250, and USD 8750 respectively.
10. Is the market size provided in terms of value or volume?
The market size is provided in terms of value, measured in million and volume, measured in Million.
11. Are there any specific market keywords associated with the report?
Yes, the market keyword associated with the report is "Sodium Cyanide Market," which aids in identifying and referencing the specific market segment covered.
12. How do I determine which pricing option suits my needs best?
The pricing options vary based on user requirements and access needs. Individual users may opt for single-user licenses, while businesses requiring broader access may choose multi-user or enterprise licenses for cost-effective access to the report.
13. Are there any additional resources or data provided in the Sodium Cyanide Market report?
While the report offers comprehensive insights, it's advisable to review the specific contents or supplementary materials provided to ascertain if additional resources or data are available.
14. How can I stay updated on further developments or reports in the Sodium Cyanide Market?
To stay informed about further developments, trends, and reports in the Sodium Cyanide Market, consider subscribing to industry newsletters, following relevant companies and organizations, or regularly checking reputable industry news sources and publications.
Methodology
Step 1 - Identification of Relevant Samples Size from Population Database


Step 2 - Approaches for Defining Global Market Size (Value, Volume* & Price*)

Note*: In applicable scenarios
Step 3 - Data Sources
Primary Research
- Web Analytics
- Survey Reports
- Research Institute
- Latest Research Reports
- Opinion Leaders
Secondary Research
- Annual Reports
- White Paper
- Latest Press Release
- Industry Association
- Paid Database
- Investor Presentations

Step 4 - Data Triangulation
Involves using different sources of information in order to increase the validity of a study
These sources are likely to be stakeholders in a program - participants, other researchers, program staff, other community members, and so on.
Then we put all data in single framework & apply various statistical tools to find out the dynamic on the market.
During the analysis stage, feedback from the stakeholder groups would be compared to determine areas of agreement as well as areas of divergence