

Key Insights
The global soft surfboard market is projected for significant expansion, fueled by rising surfing participation, especially among novices and younger demographics. Soft surfboards offer enhanced accessibility and user-friendliness, appealing to a broader audience. Innovations in construction—emphasizing durability, performance, and aesthetics—further drive market growth. These advancements include resilient foam cores and improved fin systems, providing a performance comparable to traditional boards with increased safety. The market is diversified by board size, shape, construction materials (polyethylene, EPS foam), and price, serving varied skill levels and preferences. Leading companies like Quiksilver, Hobie, and Firewire are key drivers through product development and market expansion. The growth of surf schools and rental services also stimulates demand, particularly in popular surf destinations.
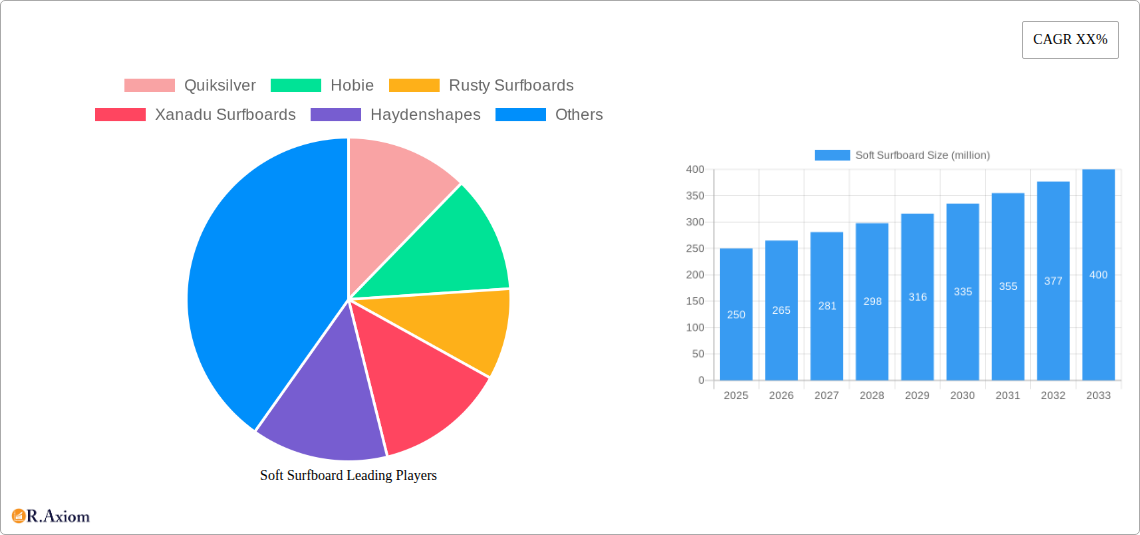
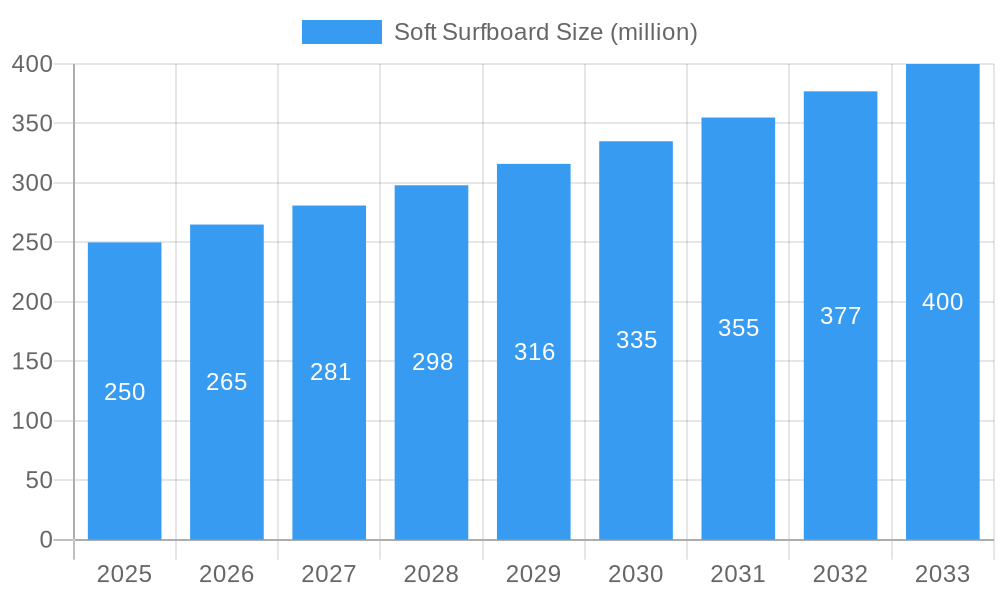
Soft Surfboard Market Size (In Billion)
While the market demonstrates a positive growth trend, challenges such as price sensitivity and competition from traditional hardboard manufacturers exist. Environmental considerations regarding manufacturing and disposal are increasingly influencing industry practices, leading to a focus on sustainable materials and production. Despite these factors, the soft surfboard market is expected to maintain consistent growth, with particularly strong performance anticipated in regions with developing surfing communities and water sports tourism infrastructure. Future success will depend on ongoing innovation, commitment to sustainability, and the continued global promotion of surfing as a recreational pursuit.
Soft Surfboard Company Market Share
The soft surfboard market is anticipated to reach $3.08 billion by 2025, exhibiting a Compound Annual Growth Rate (CAGR) of 4.72% from the base year 2025.
Soft Surfboard Market Report: 2019-2033 - A Comprehensive Analysis of a Thriving Industry
This comprehensive report provides a detailed analysis of the global soft surfboard market, encompassing market size, growth drivers, challenges, and future opportunities from 2019 to 2033. The study period covers historical data (2019-2024), the base year (2025), and a forecast period (2025-2033). This in-depth analysis uses a wealth of data to deliver actionable insights for industry stakeholders, including manufacturers, distributors, investors, and market entrants. The report projects a market valued at several million USD by 2033, showcasing significant growth potential. This report analyzes key market players such as Quiksilver, Hobie, Rusty Surfboards, Xanadu Surfboards, Haydenshapes, Boardworks Surf, Firewire Surfboards, Surftech, McTavish Surfboards, Keeper Sports, True North Gear, Channel Islands, Jason Stevenson (JS), and BIC Sport.
Soft Surfboard Market Concentration & Innovation
The global soft surfboard market exhibits a moderately concentrated structure, with several major players controlling a significant market share. While precise market share figures for each company fluctuate annually, we estimate that the top 5 companies hold approximately xx% of the market in 2025. This concentration is influenced by factors such as brand recognition, established distribution networks, and significant investments in research and development. Innovation within the soft surfboard sector is driven by advancements in material science (e.g., new foam formulations, durable coatings), manufacturing techniques (e.g., automated shaping), and design features (e.g., enhanced stability, improved performance).
- Market Share Concentration: Top 5 players hold approximately xx% in 2025.
- M&A Activity: Over the historical period, M&A activity has been relatively low. However, we predict an increase in the coming years with a potential deal value of xx million USD by 2030. This activity will likely be driven by the need for increased market share and access to new technologies.
- Regulatory Landscape: Regulations impacting materials and manufacturing processes are relatively minimal, creating a favorable environment for growth.
- Product Substitutes: The main substitute for soft surfboards is traditional hard surfboards, but softboards cater to a different market segment with their inherent safety and ease of use.
- End-User Trends: The rising popularity of surfing amongst beginners and a growing focus on safety are key drivers pushing soft surfboard adoption.
Soft Surfboard Industry Trends & Insights
The soft surfboard market demonstrates strong growth potential, driven by several key factors. Technological advancements, including the development of high-performance foam cores and durable outer layers, are enhancing the performance and durability of soft surfboards, leading to increased consumer demand. This has resulted in a compound annual growth rate (CAGR) of xx% during the historical period (2019-2024), and the forecast period is projected to see a CAGR of xx% (2025-2033). Consumer preferences are increasingly shifting towards user-friendly and safe equipment, particularly amongst beginners and children. This trend is expected to drive significant market penetration for soft surfboards in emerging markets with growing interest in surfing. Competitive dynamics are characterized by innovation in design, materials, and pricing strategies across the diverse range of manufacturers.
Dominant Markets & Segments in Soft Surfboard
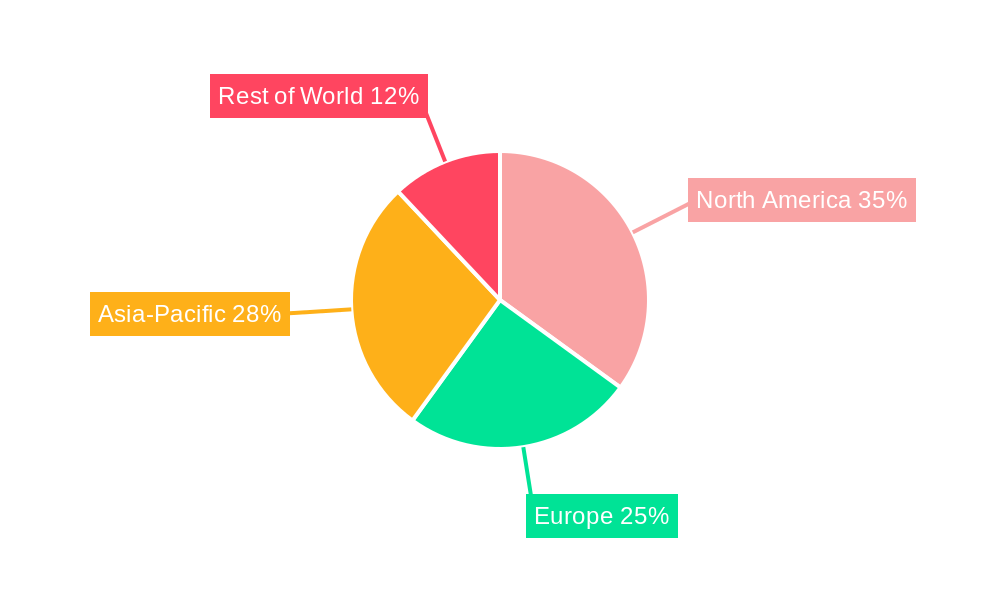
North America and Europe currently dominate the global soft surfboard market, accounting for approximately xx% of the total market value in 2025. This dominance is attributed to several key drivers:
- High Levels of Surfing Participation: Established surfing cultures and significant participation rates contribute to high demand.
- Strong Disposable Income: High disposable income levels enable consumers to afford premium soft surfboards.
- Developed Infrastructure: Well-developed retail channels and distribution networks facilitate market access.
However, Asia-Pacific is expected to exhibit the highest growth rate over the forecast period due to a rapidly expanding middle class and increasing popularity of surfing as a leisure activity. Key segments within the market include beginner-level boards, intermediate boards, longboards, and specialized boards for specific surf conditions.
Soft Surfboard Product Developments
Recent product innovations have focused on improving performance, durability, and user experience. Advances in foam technology have led to lighter and stronger boards, while improved fin designs enhance maneuverability. The incorporation of recycled materials is also gaining traction, reflecting an increasing emphasis on sustainability within the industry. These developments are contributing to stronger market fit and competitive advantages for leading manufacturers.
Report Scope & Segmentation Analysis
This report segments the soft surfboard market based on product type (beginner, intermediate, advanced), material (Ethylene-Vinyl Acetate, polyethylene, other), price range (below $300, $300-$600, above $600), distribution channel (online retailers, specialty stores, others), and geographic region (North America, Europe, Asia-Pacific, Rest of the World). Each segment's growth projections, market size, and competitive dynamics are analyzed in detail within the report. The market size is expected to reach several million USD by 2033.
Key Drivers of Soft Surfboard Growth
Several key factors are driving the growth of the soft surfboard market:
- Increasing Popularity of Surfing: Surfing is becoming a more popular recreational activity globally.
- Technological Advancements: Improvements in materials and designs are leading to higher-performing boards.
- Rising Disposable Incomes: Growing middle classes in developing countries are fueling demand.
- Focus on Safety and Ease of Use: Soft surfboards are safer and easier to use than traditional hardboards.
Challenges in the Soft Surfboard Sector
Despite strong growth prospects, the soft surfboard market faces several challenges:
- Raw Material Costs: Fluctuations in the price of raw materials can impact profitability.
- Competition: Intense competition among established players is creating price pressures.
- Environmental Concerns: The environmental impact of the production and disposal of soft surfboards requires attention. Sustainable material solutions are vital for long-term growth.
- Supply chain disruptions: Global supply chain issues can affect the production and distribution of soft surfboards.
Emerging Opportunities in Soft Surfboard
Several emerging opportunities exist within the soft surfboard market:
- Expansion into Emerging Markets: Developing countries offer significant growth potential.
- Sustainable Materials: The increasing demand for eco-friendly products presents opportunities for manufacturers.
- Specialized Softboards: Developing boards for niche segments (e.g., yoga, fitness) can create new revenue streams.
- Technological Innovations: Further technological innovations can enhance board performance and durability.
Leading Players in the Soft Surfboard Market
- Quiksilver
- Hobie
- Rusty Surfboards
- Xanadu Surfboards
- Haydenshapes
- Boardworks Surf
- Firewire Surfboards
- Surftech
- McTavish Surfboards
- Keeper Sports
- True North Gear
- Channel Islands
- Jason Stevenson (JS)
- BIC Sport
Key Developments in Soft Surfboard Industry
- 2022 Q3: Firewire Surfboards launched a new line of sustainable soft surfboards made from recycled materials.
- 2023 Q1: Quiksilver acquired a smaller soft surfboard manufacturer, expanding its market share. (Value: xx million USD).
- 2024 Q4: Significant investment in automated shaping technology by several major players.
Strategic Outlook for Soft Surfboard Market
The global soft surfboard market is poised for continued growth over the forecast period. Driven by increasing participation in surfing, technological advancements, and the growing focus on safety and sustainability, the market is expected to reach several million USD by 2033. Strategic focus should be on innovation in sustainable materials, expansion into emerging markets, and diversification into niche market segments to maximize growth opportunities.
Soft Surfboard Segmentation
-
1. Application
- 1.1. Entertainment
- 1.2. Sport Competition
- 1.3. Others
-
2. Types
- 2.1. PU (Polyurethane Polyester Laminate)
- 2.2. PE (Polyurethane Core – Epoxy Laminate)
- 2.3. Other
Soft Surfboard Segmentation By Geography
-
1. North America
- 1.1. United States
- 1.2. Canada
- 1.3. Mexico
-
2. South America
- 2.1. Brazil
- 2.2. Argentina
- 2.3. Rest of South America
-
3. Europe
- 3.1. United Kingdom
- 3.2. Germany
- 3.3. France
- 3.4. Italy
- 3.5. Spain
- 3.6. Russia
- 3.7. Benelux
- 3.8. Nordics
- 3.9. Rest of Europe
-
4. Middle East & Africa
- 4.1. Turkey
- 4.2. Israel
- 4.3. GCC
- 4.4. North Africa
- 4.5. South Africa
- 4.6. Rest of Middle East & Africa
-
5. Asia Pacific
- 5.1. China
- 5.2. India
- 5.3. Japan
- 5.4. South Korea
- 5.5. ASEAN
- 5.6. Oceania
- 5.7. Rest of Asia Pacific
Soft Surfboard Regional Market Share
Geographic Coverage of Soft Surfboard
Soft Surfboard REPORT HIGHLIGHTS
| Aspects | Details |
|---|---|
| Study Period | 2020-2034 |
| Base Year | 2025 |
| Estimated Year | 2026 |
| Forecast Period | 2026-2034 |
| Historical Period | 2020-2025 |
| Growth Rate | CAGR of 4.72% from 2020-2034 |
| Segmentation |
|
Table of Contents
- 1. Introduction
- 1.1. Research Scope
- 1.2. Market Segmentation
- 1.3. Research Methodology
- 1.4. Definitions and Assumptions
- 2. Executive Summary
- 2.1. Introduction
- 3. Market Dynamics
- 3.1. Introduction
- 3.2. Market Drivers
- 3.3. Market Restrains
- 3.4. Market Trends
- 4. Market Factor Analysis
- 4.1. Porters Five Forces
- 4.2. Supply/Value Chain
- 4.3. PESTEL analysis
- 4.4. Market Entropy
- 4.5. Patent/Trademark Analysis
- 5. Global Soft Surfboard Analysis, Insights and Forecast, 2020-2032
- 5.1. Market Analysis, Insights and Forecast - by Application
- 5.1.1. Entertainment
- 5.1.2. Sport Competition
- 5.1.3. Others
- 5.2. Market Analysis, Insights and Forecast - by Types
- 5.2.1. PU (Polyurethane Polyester Laminate)
- 5.2.2. PE (Polyurethane Core – Epoxy Laminate)
- 5.2.3. Other
- 5.3. Market Analysis, Insights and Forecast - by Region
- 5.3.1. North America
- 5.3.2. South America
- 5.3.3. Europe
- 5.3.4. Middle East & Africa
- 5.3.5. Asia Pacific
- 5.1. Market Analysis, Insights and Forecast - by Application
- 6. North America Soft Surfboard Analysis, Insights and Forecast, 2020-2032
- 6.1. Market Analysis, Insights and Forecast - by Application
- 6.1.1. Entertainment
- 6.1.2. Sport Competition
- 6.1.3. Others
- 6.2. Market Analysis, Insights and Forecast - by Types
- 6.2.1. PU (Polyurethane Polyester Laminate)
- 6.2.2. PE (Polyurethane Core – Epoxy Laminate)
- 6.2.3. Other
- 6.1. Market Analysis, Insights and Forecast - by Application
- 7. South America Soft Surfboard Analysis, Insights and Forecast, 2020-2032
- 7.1. Market Analysis, Insights and Forecast - by Application
- 7.1.1. Entertainment
- 7.1.2. Sport Competition
- 7.1.3. Others
- 7.2. Market Analysis, Insights and Forecast - by Types
- 7.2.1. PU (Polyurethane Polyester Laminate)
- 7.2.2. PE (Polyurethane Core – Epoxy Laminate)
- 7.2.3. Other
- 7.1. Market Analysis, Insights and Forecast - by Application
- 8. Europe Soft Surfboard Analysis, Insights and Forecast, 2020-2032
- 8.1. Market Analysis, Insights and Forecast - by Application
- 8.1.1. Entertainment
- 8.1.2. Sport Competition
- 8.1.3. Others
- 8.2. Market Analysis, Insights and Forecast - by Types
- 8.2.1. PU (Polyurethane Polyester Laminate)
- 8.2.2. PE (Polyurethane Core – Epoxy Laminate)
- 8.2.3. Other
- 8.1. Market Analysis, Insights and Forecast - by Application
- 9. Middle East & Africa Soft Surfboard Analysis, Insights and Forecast, 2020-2032
- 9.1. Market Analysis, Insights and Forecast - by Application
- 9.1.1. Entertainment
- 9.1.2. Sport Competition
- 9.1.3. Others
- 9.2. Market Analysis, Insights and Forecast - by Types
- 9.2.1. PU (Polyurethane Polyester Laminate)
- 9.2.2. PE (Polyurethane Core – Epoxy Laminate)
- 9.2.3. Other
- 9.1. Market Analysis, Insights and Forecast - by Application
- 10. Asia Pacific Soft Surfboard Analysis, Insights and Forecast, 2020-2032
- 10.1. Market Analysis, Insights and Forecast - by Application
- 10.1.1. Entertainment
- 10.1.2. Sport Competition
- 10.1.3. Others
- 10.2. Market Analysis, Insights and Forecast - by Types
- 10.2.1. PU (Polyurethane Polyester Laminate)
- 10.2.2. PE (Polyurethane Core – Epoxy Laminate)
- 10.2.3. Other
- 10.1. Market Analysis, Insights and Forecast - by Application
- 11. Competitive Analysis
- 11.1. Global Market Share Analysis 2025
- 11.2. Company Profiles
- 11.2.1 Quiksilver
- 11.2.1.1. Overview
- 11.2.1.2. Products
- 11.2.1.3. SWOT Analysis
- 11.2.1.4. Recent Developments
- 11.2.1.5. Financials (Based on Availability)
- 11.2.2 Hobie
- 11.2.2.1. Overview
- 11.2.2.2. Products
- 11.2.2.3. SWOT Analysis
- 11.2.2.4. Recent Developments
- 11.2.2.5. Financials (Based on Availability)
- 11.2.3 Rusty Surfboards
- 11.2.3.1. Overview
- 11.2.3.2. Products
- 11.2.3.3. SWOT Analysis
- 11.2.3.4. Recent Developments
- 11.2.3.5. Financials (Based on Availability)
- 11.2.4 Xanadu Surfboards
- 11.2.4.1. Overview
- 11.2.4.2. Products
- 11.2.4.3. SWOT Analysis
- 11.2.4.4. Recent Developments
- 11.2.4.5. Financials (Based on Availability)
- 11.2.5 Haydenshapes
- 11.2.5.1. Overview
- 11.2.5.2. Products
- 11.2.5.3. SWOT Analysis
- 11.2.5.4. Recent Developments
- 11.2.5.5. Financials (Based on Availability)
- 11.2.6 Boardworks Surf
- 11.2.6.1. Overview
- 11.2.6.2. Products
- 11.2.6.3. SWOT Analysis
- 11.2.6.4. Recent Developments
- 11.2.6.5. Financials (Based on Availability)
- 11.2.7 Firewire Surfboards
- 11.2.7.1. Overview
- 11.2.7.2. Products
- 11.2.7.3. SWOT Analysis
- 11.2.7.4. Recent Developments
- 11.2.7.5. Financials (Based on Availability)
- 11.2.8 Surftech
- 11.2.8.1. Overview
- 11.2.8.2. Products
- 11.2.8.3. SWOT Analysis
- 11.2.8.4. Recent Developments
- 11.2.8.5. Financials (Based on Availability)
- 11.2.9 McTavish Surfboards
- 11.2.9.1. Overview
- 11.2.9.2. Products
- 11.2.9.3. SWOT Analysis
- 11.2.9.4. Recent Developments
- 11.2.9.5. Financials (Based on Availability)
- 11.2.10 Keeper Sports
- 11.2.10.1. Overview
- 11.2.10.2. Products
- 11.2.10.3. SWOT Analysis
- 11.2.10.4. Recent Developments
- 11.2.10.5. Financials (Based on Availability)
- 11.2.11 True North Gear
- 11.2.11.1. Overview
- 11.2.11.2. Products
- 11.2.11.3. SWOT Analysis
- 11.2.11.4. Recent Developments
- 11.2.11.5. Financials (Based on Availability)
- 11.2.12 Channel Islands
- 11.2.12.1. Overview
- 11.2.12.2. Products
- 11.2.12.3. SWOT Analysis
- 11.2.12.4. Recent Developments
- 11.2.12.5. Financials (Based on Availability)
- 11.2.13 Jason Stevenson(JS)
- 11.2.13.1. Overview
- 11.2.13.2. Products
- 11.2.13.3. SWOT Analysis
- 11.2.13.4. Recent Developments
- 11.2.13.5. Financials (Based on Availability)
- 11.2.14 BIC Sport
- 11.2.14.1. Overview
- 11.2.14.2. Products
- 11.2.14.3. SWOT Analysis
- 11.2.14.4. Recent Developments
- 11.2.14.5. Financials (Based on Availability)
- 11.2.1 Quiksilver
List of Figures
- Figure 1: Global Soft Surfboard Revenue Breakdown (billion, %) by Region 2025 & 2033
- Figure 2: Global Soft Surfboard Volume Breakdown (K, %) by Region 2025 & 2033
- Figure 3: North America Soft Surfboard Revenue (billion), by Application 2025 & 2033
- Figure 4: North America Soft Surfboard Volume (K), by Application 2025 & 2033
- Figure 5: North America Soft Surfboard Revenue Share (%), by Application 2025 & 2033
- Figure 6: North America Soft Surfboard Volume Share (%), by Application 2025 & 2033
- Figure 7: North America Soft Surfboard Revenue (billion), by Types 2025 & 2033
- Figure 8: North America Soft Surfboard Volume (K), by Types 2025 & 2033
- Figure 9: North America Soft Surfboard Revenue Share (%), by Types 2025 & 2033
- Figure 10: North America Soft Surfboard Volume Share (%), by Types 2025 & 2033
- Figure 11: North America Soft Surfboard Revenue (billion), by Country 2025 & 2033
- Figure 12: North America Soft Surfboard Volume (K), by Country 2025 & 2033
- Figure 13: North America Soft Surfboard Revenue Share (%), by Country 2025 & 2033
- Figure 14: North America Soft Surfboard Volume Share (%), by Country 2025 & 2033
- Figure 15: South America Soft Surfboard Revenue (billion), by Application 2025 & 2033
- Figure 16: South America Soft Surfboard Volume (K), by Application 2025 & 2033
- Figure 17: South America Soft Surfboard Revenue Share (%), by Application 2025 & 2033
- Figure 18: South America Soft Surfboard Volume Share (%), by Application 2025 & 2033
- Figure 19: South America Soft Surfboard Revenue (billion), by Types 2025 & 2033
- Figure 20: South America Soft Surfboard Volume (K), by Types 2025 & 2033
- Figure 21: South America Soft Surfboard Revenue Share (%), by Types 2025 & 2033
- Figure 22: South America Soft Surfboard Volume Share (%), by Types 2025 & 2033
- Figure 23: South America Soft Surfboard Revenue (billion), by Country 2025 & 2033
- Figure 24: South America Soft Surfboard Volume (K), by Country 2025 & 2033
- Figure 25: South America Soft Surfboard Revenue Share (%), by Country 2025 & 2033
- Figure 26: South America Soft Surfboard Volume Share (%), by Country 2025 & 2033
- Figure 27: Europe Soft Surfboard Revenue (billion), by Application 2025 & 2033
- Figure 28: Europe Soft Surfboard Volume (K), by Application 2025 & 2033
- Figure 29: Europe Soft Surfboard Revenue Share (%), by Application 2025 & 2033
- Figure 30: Europe Soft Surfboard Volume Share (%), by Application 2025 & 2033
- Figure 31: Europe Soft Surfboard Revenue (billion), by Types 2025 & 2033
- Figure 32: Europe Soft Surfboard Volume (K), by Types 2025 & 2033
- Figure 33: Europe Soft Surfboard Revenue Share (%), by Types 2025 & 2033
- Figure 34: Europe Soft Surfboard Volume Share (%), by Types 2025 & 2033
- Figure 35: Europe Soft Surfboard Revenue (billion), by Country 2025 & 2033
- Figure 36: Europe Soft Surfboard Volume (K), by Country 2025 & 2033
- Figure 37: Europe Soft Surfboard Revenue Share (%), by Country 2025 & 2033
- Figure 38: Europe Soft Surfboard Volume Share (%), by Country 2025 & 2033
- Figure 39: Middle East & Africa Soft Surfboard Revenue (billion), by Application 2025 & 2033
- Figure 40: Middle East & Africa Soft Surfboard Volume (K), by Application 2025 & 2033
- Figure 41: Middle East & Africa Soft Surfboard Revenue Share (%), by Application 2025 & 2033
- Figure 42: Middle East & Africa Soft Surfboard Volume Share (%), by Application 2025 & 2033
- Figure 43: Middle East & Africa Soft Surfboard Revenue (billion), by Types 2025 & 2033
- Figure 44: Middle East & Africa Soft Surfboard Volume (K), by Types 2025 & 2033
- Figure 45: Middle East & Africa Soft Surfboard Revenue Share (%), by Types 2025 & 2033
- Figure 46: Middle East & Africa Soft Surfboard Volume Share (%), by Types 2025 & 2033
- Figure 47: Middle East & Africa Soft Surfboard Revenue (billion), by Country 2025 & 2033
- Figure 48: Middle East & Africa Soft Surfboard Volume (K), by Country 2025 & 2033
- Figure 49: Middle East & Africa Soft Surfboard Revenue Share (%), by Country 2025 & 2033
- Figure 50: Middle East & Africa Soft Surfboard Volume Share (%), by Country 2025 & 2033
- Figure 51: Asia Pacific Soft Surfboard Revenue (billion), by Application 2025 & 2033
- Figure 52: Asia Pacific Soft Surfboard Volume (K), by Application 2025 & 2033
- Figure 53: Asia Pacific Soft Surfboard Revenue Share (%), by Application 2025 & 2033
- Figure 54: Asia Pacific Soft Surfboard Volume Share (%), by Application 2025 & 2033
- Figure 55: Asia Pacific Soft Surfboard Revenue (billion), by Types 2025 & 2033
- Figure 56: Asia Pacific Soft Surfboard Volume (K), by Types 2025 & 2033
- Figure 57: Asia Pacific Soft Surfboard Revenue Share (%), by Types 2025 & 2033
- Figure 58: Asia Pacific Soft Surfboard Volume Share (%), by Types 2025 & 2033
- Figure 59: Asia Pacific Soft Surfboard Revenue (billion), by Country 2025 & 2033
- Figure 60: Asia Pacific Soft Surfboard Volume (K), by Country 2025 & 2033
- Figure 61: Asia Pacific Soft Surfboard Revenue Share (%), by Country 2025 & 2033
- Figure 62: Asia Pacific Soft Surfboard Volume Share (%), by Country 2025 & 2033
List of Tables
- Table 1: Global Soft Surfboard Revenue billion Forecast, by Application 2020 & 2033
- Table 2: Global Soft Surfboard Volume K Forecast, by Application 2020 & 2033
- Table 3: Global Soft Surfboard Revenue billion Forecast, by Types 2020 & 2033
- Table 4: Global Soft Surfboard Volume K Forecast, by Types 2020 & 2033
- Table 5: Global Soft Surfboard Revenue billion Forecast, by Region 2020 & 2033
- Table 6: Global Soft Surfboard Volume K Forecast, by Region 2020 & 2033
- Table 7: Global Soft Surfboard Revenue billion Forecast, by Application 2020 & 2033
- Table 8: Global Soft Surfboard Volume K Forecast, by Application 2020 & 2033
- Table 9: Global Soft Surfboard Revenue billion Forecast, by Types 2020 & 2033
- Table 10: Global Soft Surfboard Volume K Forecast, by Types 2020 & 2033
- Table 11: Global Soft Surfboard Revenue billion Forecast, by Country 2020 & 2033
- Table 12: Global Soft Surfboard Volume K Forecast, by Country 2020 & 2033
- Table 13: United States Soft Surfboard Revenue (billion) Forecast, by Application 2020 & 2033
- Table 14: United States Soft Surfboard Volume (K) Forecast, by Application 2020 & 2033
- Table 15: Canada Soft Surfboard Revenue (billion) Forecast, by Application 2020 & 2033
- Table 16: Canada Soft Surfboard Volume (K) Forecast, by Application 2020 & 2033
- Table 17: Mexico Soft Surfboard Revenue (billion) Forecast, by Application 2020 & 2033
- Table 18: Mexico Soft Surfboard Volume (K) Forecast, by Application 2020 & 2033
- Table 19: Global Soft Surfboard Revenue billion Forecast, by Application 2020 & 2033
- Table 20: Global Soft Surfboard Volume K Forecast, by Application 2020 & 2033
- Table 21: Global Soft Surfboard Revenue billion Forecast, by Types 2020 & 2033
- Table 22: Global Soft Surfboard Volume K Forecast, by Types 2020 & 2033
- Table 23: Global Soft Surfboard Revenue billion Forecast, by Country 2020 & 2033
- Table 24: Global Soft Surfboard Volume K Forecast, by Country 2020 & 2033
- Table 25: Brazil Soft Surfboard Revenue (billion) Forecast, by Application 2020 & 2033
- Table 26: Brazil Soft Surfboard Volume (K) Forecast, by Application 2020 & 2033
- Table 27: Argentina Soft Surfboard Revenue (billion) Forecast, by Application 2020 & 2033
- Table 28: Argentina Soft Surfboard Volume (K) Forecast, by Application 2020 & 2033
- Table 29: Rest of South America Soft Surfboard Revenue (billion) Forecast, by Application 2020 & 2033
- Table 30: Rest of South America Soft Surfboard Volume (K) Forecast, by Application 2020 & 2033
- Table 31: Global Soft Surfboard Revenue billion Forecast, by Application 2020 & 2033
- Table 32: Global Soft Surfboard Volume K Forecast, by Application 2020 & 2033
- Table 33: Global Soft Surfboard Revenue billion Forecast, by Types 2020 & 2033
- Table 34: Global Soft Surfboard Volume K Forecast, by Types 2020 & 2033
- Table 35: Global Soft Surfboard Revenue billion Forecast, by Country 2020 & 2033
- Table 36: Global Soft Surfboard Volume K Forecast, by Country 2020 & 2033
- Table 37: United Kingdom Soft Surfboard Revenue (billion) Forecast, by Application 2020 & 2033
- Table 38: United Kingdom Soft Surfboard Volume (K) Forecast, by Application 2020 & 2033
- Table 39: Germany Soft Surfboard Revenue (billion) Forecast, by Application 2020 & 2033
- Table 40: Germany Soft Surfboard Volume (K) Forecast, by Application 2020 & 2033
- Table 41: France Soft Surfboard Revenue (billion) Forecast, by Application 2020 & 2033
- Table 42: France Soft Surfboard Volume (K) Forecast, by Application 2020 & 2033
- Table 43: Italy Soft Surfboard Revenue (billion) Forecast, by Application 2020 & 2033
- Table 44: Italy Soft Surfboard Volume (K) Forecast, by Application 2020 & 2033
- Table 45: Spain Soft Surfboard Revenue (billion) Forecast, by Application 2020 & 2033
- Table 46: Spain Soft Surfboard Volume (K) Forecast, by Application 2020 & 2033
- Table 47: Russia Soft Surfboard Revenue (billion) Forecast, by Application 2020 & 2033
- Table 48: Russia Soft Surfboard Volume (K) Forecast, by Application 2020 & 2033
- Table 49: Benelux Soft Surfboard Revenue (billion) Forecast, by Application 2020 & 2033
- Table 50: Benelux Soft Surfboard Volume (K) Forecast, by Application 2020 & 2033
- Table 51: Nordics Soft Surfboard Revenue (billion) Forecast, by Application 2020 & 2033
- Table 52: Nordics Soft Surfboard Volume (K) Forecast, by Application 2020 & 2033
- Table 53: Rest of Europe Soft Surfboard Revenue (billion) Forecast, by Application 2020 & 2033
- Table 54: Rest of Europe Soft Surfboard Volume (K) Forecast, by Application 2020 & 2033
- Table 55: Global Soft Surfboard Revenue billion Forecast, by Application 2020 & 2033
- Table 56: Global Soft Surfboard Volume K Forecast, by Application 2020 & 2033
- Table 57: Global Soft Surfboard Revenue billion Forecast, by Types 2020 & 2033
- Table 58: Global Soft Surfboard Volume K Forecast, by Types 2020 & 2033
- Table 59: Global Soft Surfboard Revenue billion Forecast, by Country 2020 & 2033
- Table 60: Global Soft Surfboard Volume K Forecast, by Country 2020 & 2033
- Table 61: Turkey Soft Surfboard Revenue (billion) Forecast, by Application 2020 & 2033
- Table 62: Turkey Soft Surfboard Volume (K) Forecast, by Application 2020 & 2033
- Table 63: Israel Soft Surfboard Revenue (billion) Forecast, by Application 2020 & 2033
- Table 64: Israel Soft Surfboard Volume (K) Forecast, by Application 2020 & 2033
- Table 65: GCC Soft Surfboard Revenue (billion) Forecast, by Application 2020 & 2033
- Table 66: GCC Soft Surfboard Volume (K) Forecast, by Application 2020 & 2033
- Table 67: North Africa Soft Surfboard Revenue (billion) Forecast, by Application 2020 & 2033
- Table 68: North Africa Soft Surfboard Volume (K) Forecast, by Application 2020 & 2033
- Table 69: South Africa Soft Surfboard Revenue (billion) Forecast, by Application 2020 & 2033
- Table 70: South Africa Soft Surfboard Volume (K) Forecast, by Application 2020 & 2033
- Table 71: Rest of Middle East & Africa Soft Surfboard Revenue (billion) Forecast, by Application 2020 & 2033
- Table 72: Rest of Middle East & Africa Soft Surfboard Volume (K) Forecast, by Application 2020 & 2033
- Table 73: Global Soft Surfboard Revenue billion Forecast, by Application 2020 & 2033
- Table 74: Global Soft Surfboard Volume K Forecast, by Application 2020 & 2033
- Table 75: Global Soft Surfboard Revenue billion Forecast, by Types 2020 & 2033
- Table 76: Global Soft Surfboard Volume K Forecast, by Types 2020 & 2033
- Table 77: Global Soft Surfboard Revenue billion Forecast, by Country 2020 & 2033
- Table 78: Global Soft Surfboard Volume K Forecast, by Country 2020 & 2033
- Table 79: China Soft Surfboard Revenue (billion) Forecast, by Application 2020 & 2033
- Table 80: China Soft Surfboard Volume (K) Forecast, by Application 2020 & 2033
- Table 81: India Soft Surfboard Revenue (billion) Forecast, by Application 2020 & 2033
- Table 82: India Soft Surfboard Volume (K) Forecast, by Application 2020 & 2033
- Table 83: Japan Soft Surfboard Revenue (billion) Forecast, by Application 2020 & 2033
- Table 84: Japan Soft Surfboard Volume (K) Forecast, by Application 2020 & 2033
- Table 85: South Korea Soft Surfboard Revenue (billion) Forecast, by Application 2020 & 2033
- Table 86: South Korea Soft Surfboard Volume (K) Forecast, by Application 2020 & 2033
- Table 87: ASEAN Soft Surfboard Revenue (billion) Forecast, by Application 2020 & 2033
- Table 88: ASEAN Soft Surfboard Volume (K) Forecast, by Application 2020 & 2033
- Table 89: Oceania Soft Surfboard Revenue (billion) Forecast, by Application 2020 & 2033
- Table 90: Oceania Soft Surfboard Volume (K) Forecast, by Application 2020 & 2033
- Table 91: Rest of Asia Pacific Soft Surfboard Revenue (billion) Forecast, by Application 2020 & 2033
- Table 92: Rest of Asia Pacific Soft Surfboard Volume (K) Forecast, by Application 2020 & 2033
Frequently Asked Questions
1. What is the projected Compound Annual Growth Rate (CAGR) of the Soft Surfboard?
The projected CAGR is approximately 4.72%.
2. Which companies are prominent players in the Soft Surfboard?
Key companies in the market include Quiksilver, Hobie, Rusty Surfboards, Xanadu Surfboards, Haydenshapes, Boardworks Surf, Firewire Surfboards, Surftech, McTavish Surfboards, Keeper Sports, True North Gear, Channel Islands, Jason Stevenson(JS), BIC Sport.
3. What are the main segments of the Soft Surfboard?
The market segments include Application, Types.
4. Can you provide details about the market size?
The market size is estimated to be USD 3.08 billion as of 2022.
5. What are some drivers contributing to market growth?
N/A
6. What are the notable trends driving market growth?
N/A
7. Are there any restraints impacting market growth?
N/A
8. Can you provide examples of recent developments in the market?
N/A
9. What pricing options are available for accessing the report?
Pricing options include single-user, multi-user, and enterprise licenses priced at USD 3350.00, USD 5025.00, and USD 6700.00 respectively.
10. Is the market size provided in terms of value or volume?
The market size is provided in terms of value, measured in billion and volume, measured in K.
11. Are there any specific market keywords associated with the report?
Yes, the market keyword associated with the report is "Soft Surfboard," which aids in identifying and referencing the specific market segment covered.
12. How do I determine which pricing option suits my needs best?
The pricing options vary based on user requirements and access needs. Individual users may opt for single-user licenses, while businesses requiring broader access may choose multi-user or enterprise licenses for cost-effective access to the report.
13. Are there any additional resources or data provided in the Soft Surfboard report?
While the report offers comprehensive insights, it's advisable to review the specific contents or supplementary materials provided to ascertain if additional resources or data are available.
14. How can I stay updated on further developments or reports in the Soft Surfboard?
To stay informed about further developments, trends, and reports in the Soft Surfboard, consider subscribing to industry newsletters, following relevant companies and organizations, or regularly checking reputable industry news sources and publications.
Methodology
Step 1 - Identification of Relevant Samples Size from Population Database


Step 2 - Approaches for Defining Global Market Size (Value, Volume* & Price*)

Note*: In applicable scenarios
Step 3 - Data Sources
Primary Research
- Web Analytics
- Survey Reports
- Research Institute
- Latest Research Reports
- Opinion Leaders
Secondary Research
- Annual Reports
- White Paper
- Latest Press Release
- Industry Association
- Paid Database
- Investor Presentations

Step 4 - Data Triangulation
Involves using different sources of information in order to increase the validity of a study
These sources are likely to be stakeholders in a program - participants, other researchers, program staff, other community members, and so on.
Then we put all data in single framework & apply various statistical tools to find out the dynamic on the market.
During the analysis stage, feedback from the stakeholder groups would be compared to determine areas of agreement as well as areas of divergence